

Abstract
Background
Acute alcohol administration affects impulsive behavior, although these effects vary as a function of alcohol dose, assessment instrument, and time of measurement following administration.
Methods
We concurrently examined the dose-dependent effects of alcohol on three distinct types of impulsivity tasks (continuous performance [IMT], stop-signal [GoStop], and delay-discounting [SKIP] tasks). Ninety healthy alcohol drinkers were assigned to one of the three task groups (n = 30 each), each group experienced placebo, 0.2, 0.4, 0.6, and 0.8 g/kg alcohol doses across 5 experimental days, and task performance was assessed at 0.5 h before and 0.25, 1.0, and 2.0 h after alcohol administration. We hypothesized that impulsive responding on all tasks would be increased by acute alcohol administration both across time and during the peak BrAC, but the magnitude would depend on the task being tested. Analyses included the time-course and the peak BrAC effects. Task comparisons of peak behavioral changes following each dose are illustrated using standardized scores.
Results
While alcohol consumption increased impulsive responding during all three tasks to some extent, our hypothesis was only partially supported. During the IMT, the 0.6 and 0.8 g/kg doses produced increased impulsive responding across time and at the peak BrAC. However, during the GoStop and SKIP, impulsivity increased across time regardless of the alcohol dose size, with no differences in impulsive responding among dose conditions at peak BrAC.
Conclusions
This study demonstrated alcohol-induced changes in impulsivity are not uniformly affected by alcohol. These data, in conjunction with previous studies, further support that impulsivity is not a unitary construct.
Keywords: Alcohol, Doses, Impulsivity, Behavior, Task Comparison, Human, Adults
1. Introduction
Impulsivity, which can be measured in many different ways, has been implicated as an important mechanism for understanding alcohol-related problems. Alcohol-dependent patients have reported histories of elevated impulsive behavior (Patton et al., 1995), and the severity of dependence was shown to be positively associated with higher self-reported impulsive traits (Irwin et al., 1990). Compared to late-onset alcoholics, early-onset alcoholics reported higher trait impulsivity (Buydens-Branchey et al., 1989; Dom et al., 2006), with an inverse association between the age of onset and self-reported impulsivity (Irwin et al., 1990). Studies have shown elevated self-reported impulsivity to be related to alcohol use disorders in adolescents (Soloff et al., 2000) and to alcohol abuse among undergraduate college women (N = 335; Benjamin & Wulfert, 2005). Other studies have shown that histories of impulsive behavior predict alcohol use in college students (Zuckerman & Kuhlman, 2000), as well as the later development of alcohol dependence (Poikolainen, 2000). However, these and many other studies have relied on measures of self-reported impulsivity that reflect long-term global personality traits. These trait-dependent measures rely on subjective recall and are typically insensitive to rapid state-dependent changes. To study the acute effects of alcohol on impulsivity, researchers have focused on laboratory measures of behavior, which have been useful for monitoring state-dependent changes produced by pharmacological manipulations (e.g., Dougherty et al., 1999, 2000, 2003a; Mulvihill et al., 1997).
Impulsivity is a multi-dimensional construct (Acheson et al., 2006; Barratt & Patton, 1983; de Wit et al., 2002; Dougherty et al., 2003a; McDonald et al., 2003; Ortner et al., 2003; Reynolds et al., 2004, 2006) that can be operationally defined as "a predisposition toward rapid, unplanned reactions to internal or external stimuli without regard to the negative consequences of these reactions to the impulsive individual or to others" (Moeller et al., 2001; p. 1784). This definition encompasses at least three individual aspects of impulsivity, which have been proposed as a conceptualization of impulsive behavior (Dougherty et al., 2005a). This conceptual model was tested in a recent study with over 400 healthy participants, which revealed that each of three different types of laboratory impulsivity measures was shown to represent distinct behavioral processes (Dougherty et al., in press). These three components of impulsivity include: (1) rapid responding that occurs prior to complete processing and evaluation of a stimulus (i.e., response initiation); (2) failures to inhibit an already initiated response (i.e., response inhibition); and (3) reward-directed responding that persists despite less than optimal outcomes (i.e., consequence sensitivity). These distinctions between components of impulsivity are important because the impulsive behaviors observed in different individuals may be expressed as similar behaviors, but the underlying processes that determine these behaviors may be very different (Dougherty et al., 2005a).
Studies have examined the effects of acute alcohol administration on specific state-dependent measures of impulsivity, but the effects observed across studies appear to differ as a function of the component of impulsivity being measured. For example, studies examining the effects of alcohol on the response inhibition have found that low (0.20 g/kg), moderate (0.65 g/kg), and high (1.00 g/kg) doses of alcohol increase impulsive performance among moderate alcohol drinkers recruited from the community (Dougherty et al., 1999, 2000). Similarly, a moderate dose of alcohol (0.62 g/kg) increased response inhibition failures measured among college students (Mulvihill et al., 1997). Among college students defined as binge drinkers, alcohol (0.65 g/kg) increased response inhibition failures relative to non-binge drinkers (Marcinski et al., 2007). On the other hand, studies examining the relationship and effects of alcohol on consequence sensitivity responding (i.e., delay-discounting measures) have shown mixed results. Elevated impulsive responding (i.e., increased numbers of shorter-sooner reward choices) was found in a sample of alcohol abusers (Petry, 2001), but among healthy adults, there was no effect on impulsive responding following consumption of either moderate or large alcohol doses (0.50, 0.80 g/kg doses; Richards et al., 1999). Conversely, another study showed that alcohol consumption (0.70 g/kg dose) among college students actually reduced impulsive choices (Ortner et al., 2003). Collectively, these findings suggest that the effects of alcohol may vary as a function of the type of impulsivity being measured, the behavioral task demands, and the underlying mechanisms they assess. However, most studies examined the effects of a single dose (or limited range of doses) of alcohol on one measure of impulsivity at one point in time (e.g., expected peak breath alcohol level). As a result, conclusions that can be drawn regarding alcohol's relative effects on the different components of impulsivity are limited. To further clarify the acute effects of alcohol on behavioral impulsivity, systematic studies are needed that examine the effects of multiple alcohol doses, while concurrently comparing the effects on different components of impulsivity at multiple time points across the breath alcohol concentration (BrAC) curve.
The purpose of the current study was to examine the effects of alcohol on laboratory-measured impulsivity to extend previous findings in three important ways. This study was designed to: (1) examine the time course of alcohol's effects on behavior by characterizing performance at multiple time points during the BrAC curve; (2) characterize the effects of a wide range of alcohol doses on impulsive responding (i.e., placebo, 0.2, 0.4, 0.6, and 0.8 g/kg 95% alcohol) at the peak BrAC; and (3) compare the peak behavioral changes of the individual components of impulsivity tested in this study (i.e., response initiation, response inhibition, and consequence sensitivity) to determine the relative strength of the effects of alcohol consumption among the three task types. Based on previous research, we hypothesized that impulsive responding on all tasks would be increased by acute alcohol administration both across time and during the peak BrAC, but the magnitude of these observed effects would depend on the component of impulsivity being measured. We expected to find more impulsive responding on measures of response initiation and inhibition following alcohol consumption, but less impulsive responding on measures of consequence sensitivity. Additionally, we hypothesized that the greatest increases in impulsivity would occur at the peak breath alcohol concentration for all doses, and that this effect would occur in a dose-dependent manner.
2. Methods
2.1 Participants
Participants were recruited from the community through radio, newspaper, and television advertisements. Respondents to advertising completed an initial telephone interview to assess suitability for study participation and potential participants were invited to the laboratory for a more comprehensive screening interview. This interview included assessment of physical and psychiatric health, drug/alcohol use history, and intelligence. A physician assistant conducted a physical examination, which included a detailed health history and height/weight measurements. Psychiatric health was assessed using the Structured Clinical Interview for DSM-IV psychiatric disorders (SCID-IV, First et al., 2001); this interview included questions about over-the-counter and prescription medication, as well as illicit drug use. Intelligence was estimated using the Wechsler Abbreviated Scale of Intelligence (WASI; Psychological Corporation, 1999). Healthy alcohol drinkers, ages 21 through 40, who did not meet DSM-IV criteria for alcohol abuse or dependence and were height/weight proportionate were included in the study. Additionally, to qualify for participation, we required a self-report of recent drinking history that would be expected to produce an intoxicating dose equivalent to the maximal dose administered to that individual during the study (e.g., considering factors such as height, weight, and sex). Exclusionary criteria included: a physical condition that would interfere with task performance, DSM-IV Axis I disorder, positive alcohol or drug screen, or IQ < 80. During the screening procedure, participants also completed the Barratt Impulsiveness Scale (BIS-11; Patton et al., 1995) to characterize self-reported impulsivity traits. Participant assignment to task group was pseudo-randomized, matching sex and ethnicity across the three tasks. Written informed consent was obtained prior to study participation, and the Institutional Review Board of Wake Forest University Health Sciences reviewed and approved the experimental protocol.
2.2 Experimental Design
Once enrolled, study participation lasted for 7 days. Upon arrival each morning at 8:00 am, participants provided breath and urine samples for alcohol (AlcoTest® 7110 MKIII C, Draeger Safety Inc., Durango, CO) and drug screening (THC, cocaine, benzodiazepines, opiates, and amphetamines; Panel/Dip Drugs of Abuse Testing Device, Redwood Biotech, Santa Rosa, CA). During the first two days of testing, participants completed questionnaires and behavioral testing with placebo drink administration, which served to stabilize performance of the three different tasks and allowed participants to become accustomed to the study procedures and setting. During each of the remaining five days of testing, using a repeated-measures design, participants consumed one of each of the five alcohol doses (described below). The order of the alcohol dose administration was counterbalanced (13 dose orders) across the 15 men and 15 women within each task group.
On each day, study participants completed baseline pre-drink performance testing at 8:30 am (−0.50 h), alcohol/placebo administration at 9:00 am, and post-drink behavioral testing at three time points during the first two hours of the breath alcohol curve (BrAC) at 9:30 (0.25 h), 10:15 (1.0 h), and 11:15 am (2.0 h). Testing was conducted in a sound-attenuated chamber equipped with a 17-inch computer monitor and a computer mouse. Participants were assigned a waiting lounge where they were permitted to read, watch television, or relax (but not sleep) between testing periods. Research staff monitored participants in waiting lounges by closed-circuit television. After completing all behavioral testing, participants received a meal and remained in their assigned waiting lounge. Participants were released at 4:30 pm each day, by which time all participants' BrAC measurements had returned to .000% (also measured when placebos were administered to maintain the experimental blind).
2.3 Alcohol Administration Procedure
Beverages consisted of 0.0, 0.2, 0.4, 0.6, or 0.8 g/kg dose of 95% alcohol, with alcohol doses reduced by 8% for women to equate the expected peak BrAC levels between men and women (Hindmarch et al., 1991). Alcohol doses were divided into three cups with tonic water added to a total volume of 236.6 ml (8 oz) per cup. Placebo beverages (0.0 g/kg) consisted of three cups containing 8 oz of tonic water with 2.0 ml (0.07 oz) of the 95% alcohol applied to the rim of each cup to provide the illusion of an alcoholic beverage (producing no measurable BrAC). Alcohol consumption occurred across 15 min at a rate of one cup every 5 min. Consumption was monitored by research staff who were blind to the alcohol dose condition. BrACs were measured immediately before and after each computer session. To help standardize rates of alcohol absorption, all participants were instructed to fast starting at midnight prior to each day of testing, and upon arrival at the laboratory each morning, participants were provided two breakfast bars (Nutri-Grain®; Kellogg Sales Co., Battle Creek, MI) that were consumed between 8:00 and 8:30 am.
2.4 Behavioral Measures of Impulsivity
Participants were assigned to perform one of three impulsivity tasks that have been operationally defined as response initiation, response inhibition, or consequence sensitivity tasks. Standardized behavioral task instructions (Dougherty and Marsh 2003; Dougherty et al., 2003d, 2003e) were administered prior to the participant's first behavioral performance session at the start of the study. A description of each task appears below.
To provide incentive for effortful performance, participant payment was based partly on how accurately they performed on the behavioral task. At the end of each day, participants received a payment voucher which served to provide them with feedback regarding their overall performance for the day. Participants earned points based on the accuracy of their performance in each session (points displayed on the monitor at the end of each computer session). To determine their performance-based payment, the sum of each day’s points was computed as a ratio of the first baseline day’s performance. For instance, testing performance equal to the first day of stabilization resulted in a payment of $15, testing performance 25% below the baseline day’s performance resulted in payment of $12.50, and 25% above the first day of stabilization resulted in payment of $17.50. These performance-based earnings were added to a flat payment of $60 per day, so that on average, participants were compensated between $70–80 per day.
2.41 Immediate Memory Task (IMT)
The IMT is a modified Continuous Performance Task (CPT; Beck et al., 1956) that can be used to measure response initiation aspects of impulsivity (Dougherty and Marsh, 2003; Dougherty et al., 2002, 2003c). In this task, a series of 5-digit numbers (e.g., 38391) are displayed on a computer monitor in black and centered on a white background; each digit measures 2.0 cm wide by 3.3 cm high. The sequence of numbers is randomly generated and each number appears for 500 msec at a rate of one per second. The participant is instructed to click a mouse button when the 5-digit number they see is identical to the one that preceded it. The three main types of numeric stimuli are target, catch, and filler stimuli. A target stimulus is a 5-digit number that is identical to the preceding number. The participant is instructed to respond to these numbers and these responses are recorded as correct detections. A catch stimulus is a number that differs from the preceding number by only one digit (its position and value determined randomly). Responses to catch stimuli are recorded as commission errors, which is the primary measure of impulsivity in this task. A filler stimulus is a random 5-digit number that appears whenever a target or catch trial is not scheduled to appear. Responses to filler stimuli are designated filler errors. In this 10-min session, the probabilities of either target or catch stimulus presentations are 33% each and the probability of a filler stimulus presentation is 34%. The IMT Ratio, (i.e., the proportion of commission errors to correct detections; Dougherty et al., 2002) is the primary dependent measure of impulsivity for this task.
2.42 GoStop Impulsivity Paradigm (GoStop)
The GoStop Impulsivity Paradigm (Dougherty et al., 2003d) is a stop-signal task that measures response inhibition aspects of impulsivity (Dougherty et al., 2005b). Similar to the IMT (above), the GoStop involves rapid presentation of a series of 5-digit numbers during a 12-min session; each stimulus is displayed for 500 msec with a 1,500 msec inter-stimulus interval. Unlike the IMT, half of the 5-digit numbers are target trials (matching stimuli) and half are filler trials (non-matching stimuli). The primary feature of this response inhibition task are the "stop" trials; for half of all target trials, the second (matching) number changes from black to red at intervals that vary from 50 to 350 msec after the stimulus appears on the monitor. Participants are instructed to respond while a number is still on the monitor, but to withhold responding if that number turns red (the stop signal). In other words, a "go" stimulus is occasionally followed (at varying delays) by a "stop" cue (a text-color change). On Stop trials, the duration that the matching number appears in black (go) before turning red (stop) is 50, 150, 250, or 350 msec. The failure to withhold a response to the stop stimulus is a response inhibition failure. Participants are also instructed that late responses (i.e., after the stimulus disappears from the screen) will not be counted as points earned for that response even though the response may be correct. This is intended to prevent consistent late responding to avoid responding if a stop signal appears. Late responses and the length of the total delay from stimulus onset are recorded separately for each stimulus type (i.e., correct responses and responses following each stop delay). The primary dependent measure is the GoStop Ratio (Dougherty et al., in press), which is calculated as the number of response inhibition failures (i.e., incorrect responses to stop trials) relative to the number of responses to go trials. The GoStop Ratio has been validated as a measure of the ability to inhibit an already initiated response. Since alcohol is known to affect reaction time, it is important to assess the number of inhibition failures rather than the speed of inhibition. Data from the 150 msec stop delay are most often used because this variable typically provides the best group discrimination (e.g., Marsh et al., 2002).
2.43 Single Key Impulsivity Paradigm (SKIP)
The SKIP (Dougherty et al., 2003e) is a modified delay-discounting procedure that measures consequence sensitivity aspects of impulsivity (Dougherty et al., 2005b). The SKIP is a free-operant procedure (rather than the traditional discrete-choice delay-discounting task). For this task, participants are instructed to respond by clicking on a mouse button to earn points that are exchangeable for money. In a 20-min session, the participant can respond as often as desired by clicking a computer mouse to accumulate points. Each response adds points to a cumulative point counter and the points earned increase exponentially as the length of the delay between responses increases. The standardized instructions explained the delay/reward contingency: "Nothing in this task will tell you when to press the button. You can press the button whenever you want to, but keep in mind, the longer you wait before pressing the button, the more points that press will be worth. " The delay/reward contingency was calculated as [seconds elapsed + (3 * [seconds elapsed]2)] / 1000. Two counters are displayed on the computer screen. The Total Points Earned counter displays the cumulative point total throughout the session. The Points Earned for this Response counter indicates the number of points awarded for the most recent response; this information appears for up to 2 sec after each response to provide immediate feedback of the delay-reward contingency. Any response prior to the completion of the 2 sec feedback period, immediately updated both the cumulative and most recent response counters. The primary dependent measure is the SKIP Longest Delay between two consecutive reward responses (Dougherty et al., 2005b). The Longest Delay reflects the longest reinforcement period an individual is willing to tolerate in a single session, which is consistent with our proposed conceptual model of impulsivity (Dougherty et al., 2005a) in that this reflects the maximal delay that an individual is actively willing to delay for reward.
2.5 Data Analyses
The primary aim of this study was to characterize the effects of multiple alcohol doses on impulsive responding by: (1) comparing the time-course effects of alcohol on behavioral impulsivity at three points across the breath alcohol concentration (BrAC) curve; (2) comparing the peak effects of alcohol doses on individual components of impulsivity (i.e., response initiation, response inhibition, and consequence sensitivity); and (3) comparing the relative strength of the effects of alcohol consumption among the three task types. Participant characteristics among the three groups (i.e., age, education, IQ, number of alcoholic drinks in the past month, cigarette smoking, and BIS-11) were compared with univariate analyses of variance (ANOVA). Ethnic distribution was compared with a Chi-square test. For behavioral task analyses, in cases where the assumption of sphericity required for ANOVA was not met, results of repeated-measures multivariate analyses of variance (MANOVA) are reported. Preliminary analyses of the BrAC and behavioral task data were conducted to determine whether sex, group, or baseline dose order differences existed. Initial analyses of the mean BrAC measurements indicated no main effects or interactions involving group or sex, and the BrAC data were collapsed across both sex and group in the analyses of the four active alcohol doses of each testing day. Similarly, initial analyses of the baseline behavioral task variables indicated no main effects or interactions involving sex or dose order, therefore behavioral task data were collapsed across these variables in subsequent analyses. No pre-drink baseline performance differences across the five experimental conditions were found within IMT, GoStop, or SKIP tasks (p > .05); however inspection of the SKIP baseline data revealed a single outlier that may have influenced these results. The same analysis after removal of the outlier also showed no baseline performance differences; however, all SKIP analyses are reported both with and without the inclusion of the outlier data. During the GoStop, the 150 msec stop delay produced the best group discrimination relative to the other stop delays and was used to calculate the GoStop 150 msec Ratio used in the subsequent analyses. The two baseline stabilization days performed prior to the experimental manipulations were not included in data analyses.
Three types of behavioral analyses are presented: (1) Time-Course Effects of Alcohol; (2) Peak BrAC Effects of Alcohol; and (3) Task Comparisons of Peak Behavioral Changes following each of the alcohol doses. Bonferroni correction was used for all follow-up testing and corrected values are reported for all follow-up analyses. Our first set of analyses, to examine time-course effects of the 5 alcohol doses (0.0, 0.2, 0.4, 0.6, and 0.8 g/kg), were conducted separately within each of the behavioral tasks with 5 × 4 (Alcohol Dose × Time of Testing) repeated-measures ANOVAs for each of the three primary behavioral task variables (i.e., IMT Ratio, GoStop 150 msec Ratio, and SKIP Longest Delay). Our second set of analyses compared the effects of alcohol on task performance at the peak BrAC using two-tailed paired t-tests within each of the three tasks for each active alcohol dose both between doses and relative to placebo. Comparisons of peak BrAC effects with placebo were at the 0.25 h post-drink measurement for the 0.2 g/kg and 0.4 g/kg doses and at the 1.0 h post-drink measurement for the 0.6 g/kg and 0.8 g/kg doses to help control for variance attributable to fluctuations in performance across the day.
To determine the relative between-task effects of the four active alcohol doses, the primary task variables were compared at the peak behavioral change for each alcohol dose. To allow comparison on a common scale and prevent domination of variables with large values (i.e., SKIP task), variables were converted to standardized scores (similar to the procedure used in Dougherty et al., 2003b) calculated in two steps. First, a difference score variable was created for each of the active alcohol dose conditions by subtracting the placebo performance data from the peak performance data for each task. Second, the mean of each difference score variable was divided by its standard deviation, resulting in standardized scores. However, during the SKIP task, decreasing scores (smaller delays for reward) indicate increasing impulsive responding, while during the IMT and GoStop, increasing scores indicate increasing impulsive responding. Therefore, to match the directionality for comparing changes in impulsive responding, the standardized scores for the SKIP task Longest Delay were inverted so that increasing scores of all tasks indicated increased impulsive responding. SPSS© version 15.0 (SPSS, Inc., Chicago, IL) was used for all data analyses, and the significance criterion for all comparisons was set at p < .05.
3. Results
3.1. Participant Characteristics
A total of 90 healthy adult alcohol drinkers completed the study; 15 men and 15 women were assigned to each of the three impulsivity task groups (i.e., IMT, GoStop, and SKIP). As shown in Table 1, the demographic and other characteristics (including alcohol consumption in the last month and BIS impulsiveness self-reports) did not differ among the groups or within groups by sex. Furthermore, each group's scores on the self-report measure of trait impulsivity (Barratt Impulsiveness Scale-11) were near the normative mean for this instrument (M = 64, SD = 10.7; Patton et al., 1995), and the BIS-11 subscale and total scores were not correlated with either baseline impulsivity performance or impulsivity at any dose or time point following alcohol consumption for any of the tasks.
Table 1.
Demographic Characteristics by Group and Sex
| IMT | GoStop | SKIP | Group Comparisons | |||||||||||||||||
|---|---|---|---|---|---|---|---|---|---|---|---|---|---|---|---|---|---|---|---|---|
| Men n = 15 |
Women n = 15 |
Men n = 15 |
Women n = 15 |
Men n = 15 |
Women n = 15 |
ANOVA | ||||||||||||||
| Characteristics | Mean | SD | Mean | SD | t | p | Mean | SD | Mean | SD | t | p | Mean | SD | Mean | SD | t | p | F | p |
| Age (yrs) | 31.0 | 6.1 | 26.9 | 6.0 | 1.90 | .07 | 27.7 | 4.4 | 31.0 | 6.5 | 1.60 | .12 | 29.8 | 5.4 | 24.5 | 5.4 | 2.70 | .01 | 1.17 | .31 |
| Education (yrs) | 13.3 | 1.6 | 14.5 | 2.1 | 1.80 | .08 | 14.3 | 2.3 | 14.1 | 2.1 | 0.25 | .80 | 14.5 | 1.7 | 14.0 | 2.0 | 0.78 | .44 | 0.30 | .74 |
| WASI (Total) | 104.4 | 12.6 | 99.7 | 12.8 | 1.00 | .32 | 106.5 | 14.8 | 102.4 | 9.8 | 0.90 | .38 | 106.1 | 10.8 | 100.9 | 11.1 | 1.30 | .20 | 0.59 | .74 |
| Cigarettes/day | 6.3 | 8.3 | 5.6 | 6.4 | 0.27 | .79 | 6.1 | 7.2 | 2.6 | 3.9 | 1.60 | .11 | 5.0 | 6.0 | 3.9 | 6.3 | 0.49 | .63 | 0.59 | .56 |
| BMI | 25.4 | 3.1 | 23.7 | 3.1 | 1.50 | .14 | 24.7 | 4.1 | 25.7 | 4.8 | 0.58 | .56 | 26.3 | 2.6 | 25.3 | 3.3 | 0.94 | .36 | 0.98 | .38 |
| BIS-11 | 61.6 | 7.2 | 61.1 | 9.8 | 0.15 | .88 | 60.1 | 9.8 | 64.2 | 10.6 | 1.10 | .29 | 58.7 | 8.1 | 60.1 | 7.5 | 0.47 | .64 | 0.30 | .47 |
| Men n = 15 | Women n = 15 | ANCOVA* | Men n = 15 | Women n = 15 | ANCOVA* | Men n = 15 | Women n = 15 | ANCOVA* | ANCOVA* | |||||||||||
| Mean | SD | Mean | SD | F | p | Mean | SD | Mean | SD | F | p | Mean | SD | Mean | SD | F | p | F | p | |
| Drinks/month | 51.7 | 38.3 | 36.0 | 25.3 | 0.49 | .83 | 41.8 | 34.8 | 23.2 | 14.8 | 2.67 | .11 | 46.9 | 28.7 | 39.3 | 32.1 | 0.75 | .39 | 1.71 | .19 |
| Ethnicity | % | % | χ2 | p | % | % | χ2 | p | % | % | χ2 | p | χ2 | p | ||||||
| African American | 53.3 | 46.7 | 1.1 | .59 | 26.7 | 60.0 | 5.2 | .08 | 26.7 | 53.3 | 4.4 | .22 | 3.5 | .75 | ||||||
| Caucasian | 46.7 | 46.6 | 73.3 | 33.3 | 53.3 | 46.7 | ||||||||||||||
| Hispanic | 0.0 | 6.7 | 0.0 | 6.7 | 6.7 | 0.0 | ||||||||||||||
| Other | 0.0 | 0.0 | 0.0 | 0.0 | 1.3 | 0.0 | ||||||||||||||
Height/Weight covaried; BIS-11 = Barratt Impulsiveness Scale version 11; BMI = Body Mass Index (kg × m2); WASI = Wechsler Abbreviated Scale of Intelligence
One-hundred thirty-five adults were initially enrolled in this study. Attrition was nearly equal across the task groups (IMT n = 17, GoStop n = 16, and SKIP n = 14). The two most common reasons for withdrawal from the study were having obtained other employment and intolerance for the taste or consumption of the tonic/alcoholic beverage. One participant was dropped from participation because of a positive urine-drug test for marijuana.
The alcohol consumption estimated by participants was wide ranging. Because alcohol consumption patterns vary by week, the usual number of alcohol drinks per occasion was used to characterize the current drinking pattern. The usual number of alcoholic beverages reported per occasion ranged from 1 to 13 for women (Median = 3.5 drinks), and 1 to 20 for men (Median = 4.0 drinks). Because the range of drinking among these participants was broad, we conducted Pearson's product moment correlations to determine whether the reported drinking histories may have influenced performance on the impulsivity tasks. Correlations conducted between the number of drinks consumed in the most recent month and baseline impulsivity (including BIS-11 and behavioral measures) showed no significant relationships with alcohol consumption outside the laboratory.
3.2 Breath Alcohol Concentration
As expected, analyses of the mean breath alcohol concentrations (BrAC; Figure 1) at each time point (0.25, 1.00, and 2.00 h) following alcohol consumption indicated a robust Alcohol Dose × Time of Testing interaction (F6,84 = 114.93, p ≤ .001). Peak BrACs occurred at 0.25 h after dosing for the 0.2 (i.e., .011%) and 0.4 g/kg (i.e., .034%) alcohol doses and at 1.0 h after dosing for the 0.6 (i.e., .063%) and 0.8 g/kg (i.e., .089%) doses.
Figure 1.
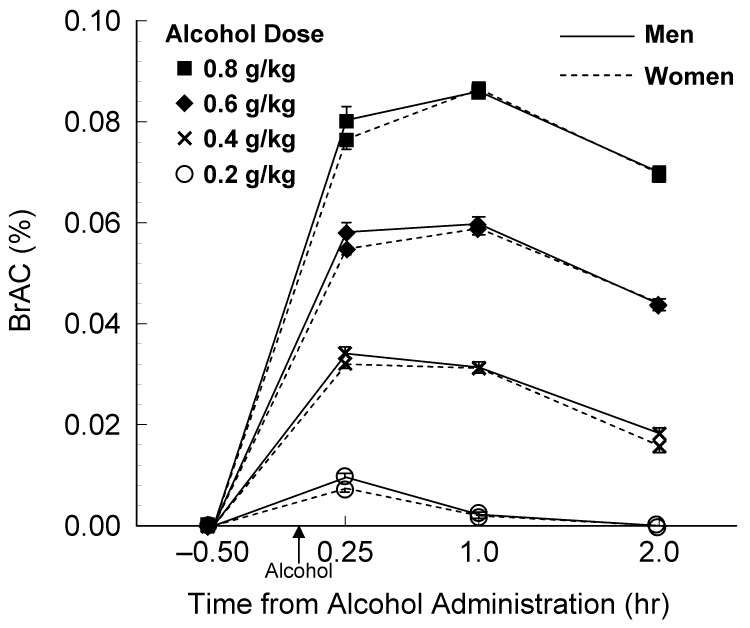
Breath alcohol concentrations (BrAC) across the four testing Times for both men and women (mean ± SEM).
3.3 Time-Course Effects of Alcohol Doses on Impulsivity
To determine the effects of each alcohol dose on laboratory impulsivity at three points of the BrAC curves (i.e., ascending, peak, and descending), analyses in this section were conducted examining task performance across time within each task type (i.e., within-group comparisons). The analyses for each of the individual tasks are described below.
3.31 Immediate Memory Task (IMT)
Performance following alcohol dosing showed a significant increase of impulsive responding (i.e., IMT Ratio) that was dependent on both the size of the alcohol dose and the time of testing (Alcohol Dose × Time of Testing interaction: F12,348 = 2.41, p = .005; Figure 2A). Follow-up analyses of time-course differences for the three comparisons within each dose condition showed that, relative to the respective pre-drink baseline performance, impulsivity was elevated at all post-drink measurements following consumption of the 0.8 g/kg dose (t29 = 4.46 to 7.07, p < .003), and the 0.6 g/kg dose (t29 = 2.90 to 4.03, p = .021 to < .001). There were no significant time-course differences for the placebo, 0.2 g/kg, or 0.4 g/kg dose conditions.
Figure 2.
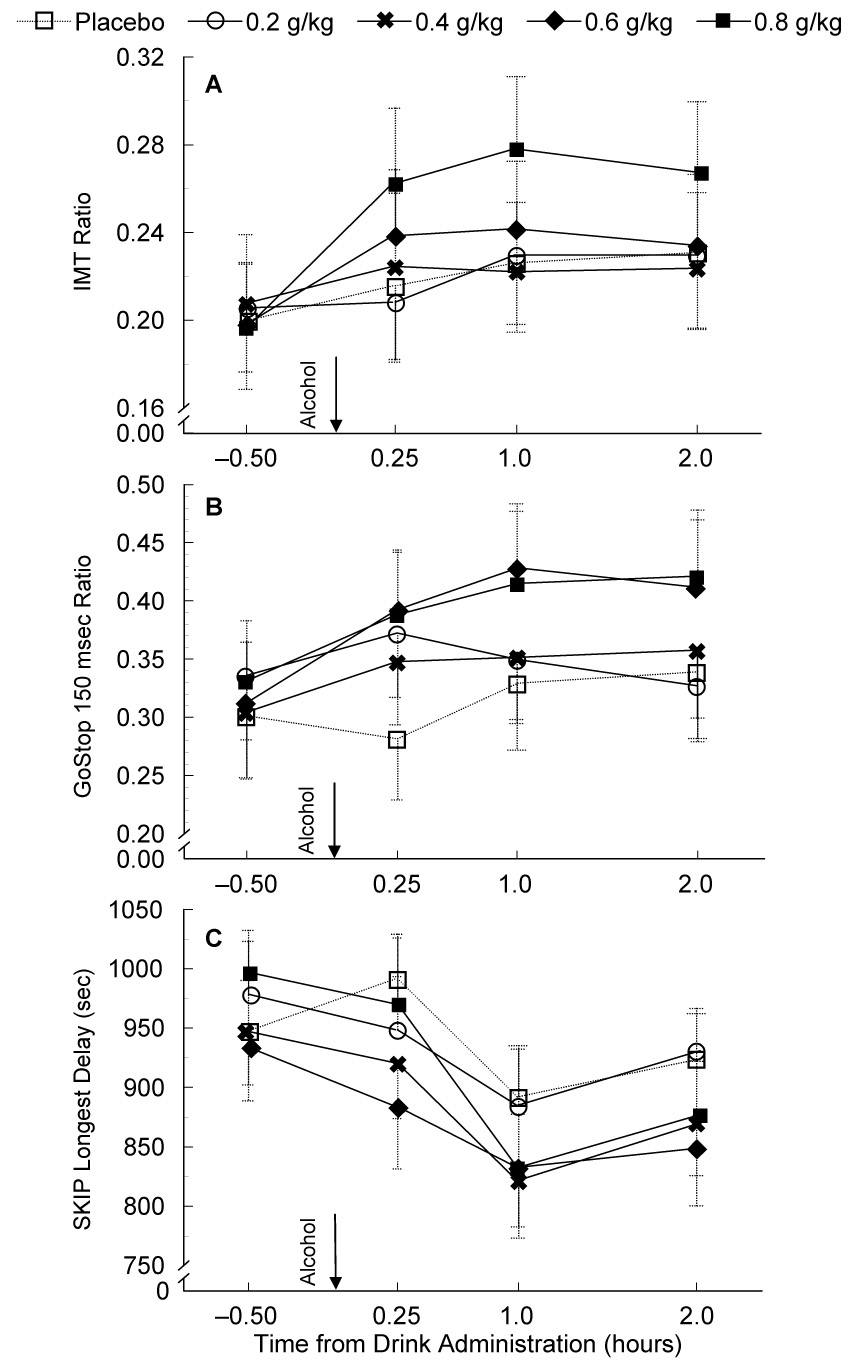
Time course evaluation of alcohol's effects on IMT, GoStop, and SKIP performance across pre-drink baseline and post-drink testing times (mean ± SEM).
3.32 GoStop Impulsivity Paradigm (GoStop)
In contrast to the IMT performance differences, during GoStop performance (150 msec delay, Figure 2B), there was a significant increase in impulsive responding (i.e., GoStop 150 msec Ratio) from pre-drink baseline through 2 h post-drink testing regardless of the dose condition (main effect of Time of Testing: F3,27 = 6.31, p = .002). Relative to the pre-drink baseline session, paired t-tests showed that impulsive responding increased at each time point following dosing (t29 = 3.22 to 3.70, p = .003 to .009). There was a trend for a main effect of (F3,26 = 2.61, p = .059), but no Alcohol Dose × Time of Testing interaction.
3.33 Single Key Impulsivity Paradigm (SKIP)
Alcohol consumption diminished the tolerance for delay (i.e., reduced the Longest Delay between consecutive responses) across all post-drink measurements (main effect of Time: F3,87 = 7.62, p < .001; Figure 2C). While there was a trend for a main effect of Alcohol Dose, this difference was not significant (F4,116 = 2.38, p = .055). There was no Alcohol Dose × Time of Testing interaction. Follow-up comparisons showed that the tolerance for delay at 1.0 h post-drink testing was significantly shorter (i.e., reduced time between consecutive responses) than the pre-drink baseline (t29 = 3.50, p = .006) regardless of the alcohol dose, and there was a trend for a shorter tolerance for delay at 2.0 h relative to pre-drink baseline (t29 = 2.42, p = .066). Secondary analyses after removing the outlier, showed significantly shorter tolerance for delay at both the 1.0 and 2.0 h post-drink testing (t29 = 3.03 and 4.18, p = .015 and < .001, respectively).
3.4 Peak Effects of Alcohol Dose on Impulsivity
The effects on impulsive behavior during the peak BrAC were of specific interest in this study. The following analyses describe the comparisons of task performance during the peak BrAC following each alcohol dose. The BrAC peaks occurred at 0.25 h after dosing for the 0.2 and 0.4 g/kg doses and at 1.0 h after dosing for the 0.6 and 0.8 g/kg doses (see Figure 1). Results of the analyses for each task are described below.
3.41 Immediate Memory Task (IMT)
Of the four active alcohol dose conditions, only the 0.8 g/kg dose produced significantly increased impulsive responding (i.e., IMT Ratio) at the peak BrAC (Figure 3A) compared to all other active alcohol doses and placebo (t29 = 2.78 to 4.32, p = .05 to < .001). The 0.6 g/kg showed increased impulsivity compared to the 0.2 g/kg dose only (t29 = 3.11, p = .024). There were no other significant differences in impulsive responding at the peak BrAC for any dose.
Figure 3.
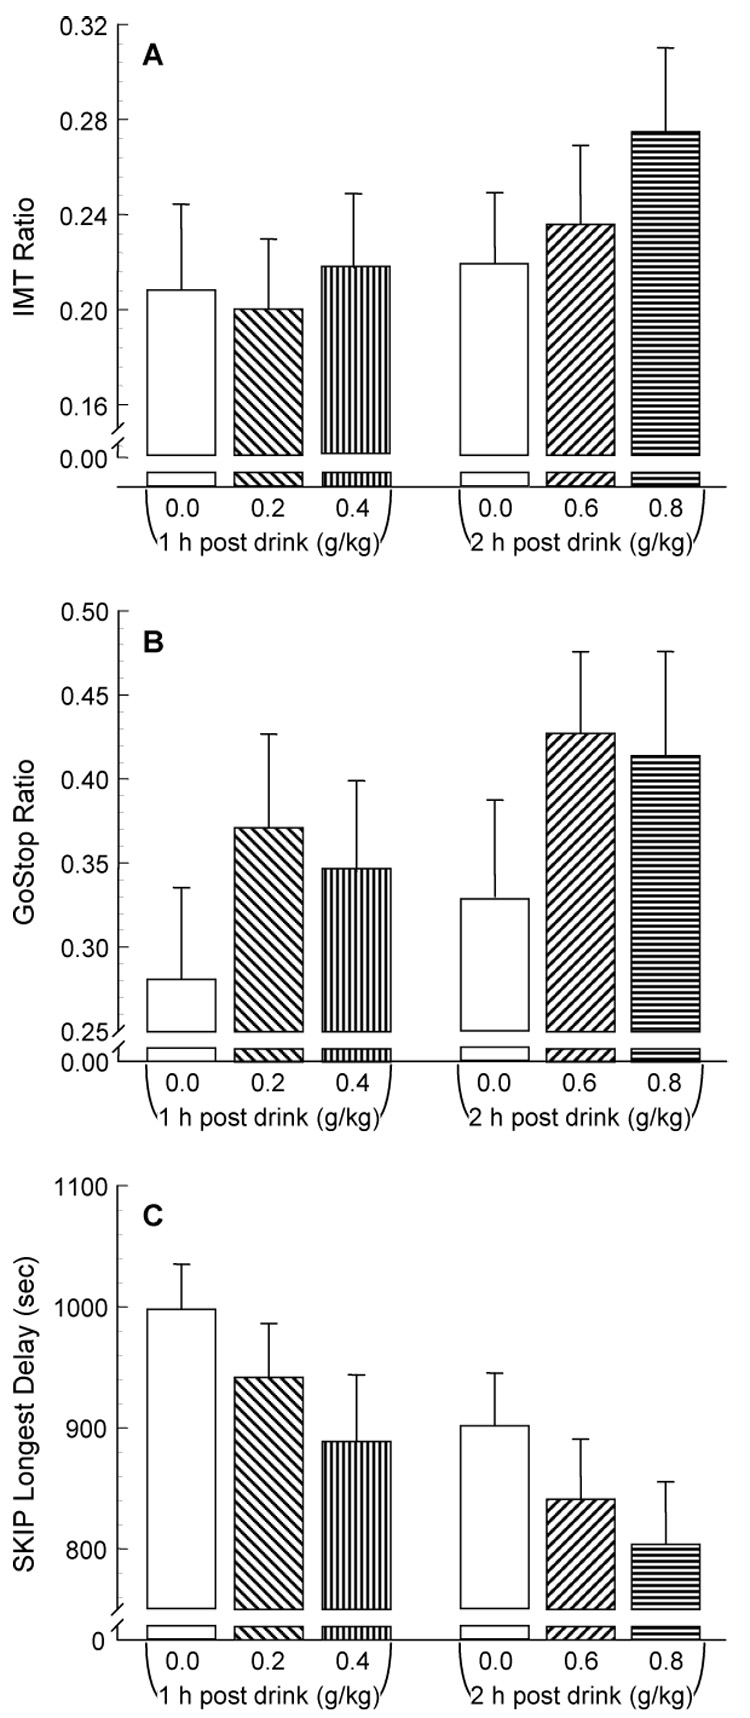
Alcohol's effects on IMT, GoStop, and SKIP performance (mean ± SEM) during peak breath alcohol concentration (i.e., 0.25 h for 0.2 and 0.4 g/kg, 1.0 h for 0.6 and 0.8 g/kg doses).
3.42 GoStop Impulsivity Paradigm (GoStop)
In contrast to the IMT, at the peak BrAC, impulsive responding during the GoStop (150 msec Ratio) showed no differences among any of the dose conditions, nor any differences from placebo (Figure 3B).
3.43 Single Key Impulsivity Paradigm (SKIP)
Regardless of the inclusion or exclusion of data from the outlier, at the peak BrAC, impulsive responding during the SKIP task (i.e., participants' willingness to tolerate longer delays) showed no significant differences among any of the dose conditions, nor any differences from placebo (Figure 3c).
3.5 Task Comparisons Using Standardized Scores
The peak change in behavior following each of the alcohol doses was compared among the three impulsivity tasks. The peak behavioral effects for each task at all doses occurred at 1.0 h following alcohol consumption, except for the IMT Ratio following 0.4 g/kg alcohol where the peak behavioral change occurred at 0.25 h post drink. To compare these effects on a common scale, standardized scores were calculated for the IMT Ratio, GoStop 150 msec Ratio, and SKIP Longest Delay (see Methods, Data Analyses). The task comparison of the standardized scores is illustrated in Figure 4.
Figure 4.
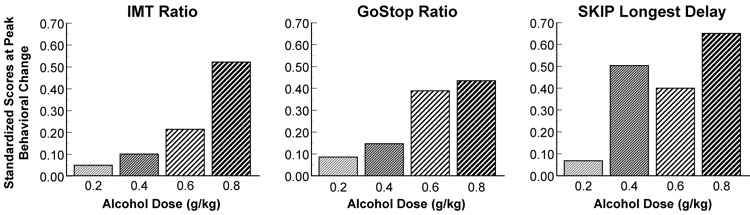
Task comparisons of standardized scores at the peak behavioral changes following each of the four alcohol doses.
4. Discussion
The purpose of this study was to test the effects of alcohol on three different behavioral impulsivity measures across time and at peak breath alcohol concentration (BrAC). Our hypothesis was supported in that the IMT showed clear dose-dependent performance differences across time, while the GoStop and SKIP did not. This suggests the magnitude of the effects of alcohol on impulsive behavior is different among the three measures. More specifically, relative to baseline performance, impulsive responding during the IMT was increased across all post-drink measurements, but only following the two largest alcohol doses (0.6 and 0.8 g/kg). In contrast, impulsive performance during the GoStop was increased at all three post-drink time points regardless of dose condition, while impulsive performance during the SKIP was increased only at 1.0 and 2.0 h following dosing regardless of dose condition. During the peak BrAC, the IMT showed the largest alcohol dose (i.e., 0.8 g/kg) increase impulsive responding more than all other active doses and placebo, but the GoStop and SKIP tasks showed no impulsive performance differences among the dose conditions. Lastly, examining the peak changes in behavior (Figure 4), a stepwise increase in impulsive responding relative to the size of the alcohol dose was observed for the IMT, while increased impulsive responding was observed to be elevated only after the 0.6 and 0.8 g/kg alcohol doses for the GoStop, and after all but the 0.2 g/kg alcohol dose for the SKIP. These results suggest there may be differential effects of alcohol dependent on the type of task used to test impulsive behavior.
The results of the current study are consistent with findings of a number of previous studies that examined the effect of alcohol on impulsivity (e.g., Dougherty et al., 1999, 2000; Mulvihill et al., 1997; Reynolds et al., 2006), although these studies often used a smaller range of doses and a single measurement time point. The current study provides an important extension of that past work by expanding those testing parameters to directly compare multiple measurements of impulsive behavior following a range of doses within each task group. Since this study compared time and dose within task groups, these results are also important to consider in the context of the discrepancies between results of different studies that have used similar tasks, but different methodologies (e.g., dose size, sample tested; Ortner et al., 2003; Richards et al., 1999). What our study does not provide, however, is a definitive interpretation of performance differences among the components of impulsivity represented by the three tasks used here. The results from our between-group comparisons, therefore, are only suggestive of differential effects of alcohol on the processes measured by these tasks. While there were distinct dose differences in performance both across time and at peak BrAC for the IMT, the GoStop and SKIP only showed trends for performance differences among dose conditions. Since our primary goal was to test a broader range of dose sizes and to assess the effects across multiple time points, the lack of stronger differences on the GoStop or SKIP may be due, in part, to lower power for detecting significant effects. The performance differences found in the present study are likely to be understated because we selected a sample of normal healthy adults with a very normal range of self-reported impulsivity. Thus, our results are likely to be a conservative estimate of the changes in impulsive behavior between the task types that might be expected from samples with more impulsive traits, such as binge drinkers (Marcinski et al., 2007) or individuals with alcohol or drug dependence (e.g., Allen et al., 1998; Soloff et al., 2000). Our results may also have been impacted by the heterogeneity among the different task groups. More rigorous matching to produce more homogeneous groups, or using a within-group design for testing task differences, would likely reduce variance and clarify dose-response effects, particularly for the GoStop and SKIP tasks. Although these caveats should be observed, our time and dose comparison of three types of impulsivity tasks nevertheless supports results of previous studies showing that the use of different types of impulsivity measures can produce a variety of outcomes as a result of different alcohol dose sizes and/or the time of measurement of alcohol's effects.
While the scope of this study was broad, and testing performance on three types of impulsivity tasks at multiple time points following consumption of a wide range of alcohol doses is an important contribution to the literature, there are considerations that need to be acknowledged when interpreting these results. For instance, this study used a single bolus dosing procedure for alcohol administration during the morning, which does not reflect typical drinking patterns of alcohol drinkers. Furthermore, within each of our task groups, there was a broad range of reported number of drinks consumed in the most recent month that may also have contributed to the variability in task performance since very light drinkers might be expected to respond differently to an alcohol challenge than heavier drinkers. Finally, this study only tested the effects of alcohol on three behavioral measures of impulsivity and there may be other parameters of cognition important to the understanding of alcohol's behavioral effects. Future research could extend the current findings by using a within-subjects design, including additional behavioral measures of impulsivity or cognition, using a cumulative alcohol dosing procedure, and/or examining behavioral performance among problem alcohol drinkers (e.g., binge drinkers) or other substance abusing samples to test the effects of alcohol on impulsivity.
Previous theory has described impulsivity as a very complex construct (e.g., Barratt & Patton, 1983) and we recently conducted an empirical test of this complexity in a sample of 400 healthy participants who each completed all three of the laboratory behavioral impulsivity measures used in the current study. We demonstrated that these three tasks are statistically independent under normal (no alcohol) conditions (Dougherty et al., in press). The present study demonstrated that each of these impulsivity measures was affected by alcohol consumption to some extent, but the measures were not uniformly affected. These results, combined with other studies that have found alcohol-induced changes in impulsive behavior using different types of impulsivity tasks, add to the mounting support that impulsivity is not a unitary construct and that alcohol consumption can result in a variety of effects that are dependent on a number of different factors, including the type of impulsivity being tested. Because of this, as others have stated previously, it would be best to apply multiple measures to adequately characterize impulsive behavior (e.g., Barratt & Patton, 1983; Dougherty et al., 2003; Reynolds et al., 2004, 2006).
Acknowledgements
This research was sponsored by grants from the National Institutes of Health (R01-AA12046, R01-AA014988, and T32-AA-007565). Dr. Dougherty gratefully acknowledges support from the William & Marguerite Wurzbach Distinguished Professorship. We thank Karen Klein, MA, ELS (Research Support Core, Wake Forest University Health Sciences) for her editorial contributions to this manuscript.
Footnotes
Publisher's Disclaimer: This is a PDF file of an unedited manuscript that has been accepted for publication. As a service to our customers we are providing this early version of the manuscript. The manuscript will undergo copyediting, typesetting, and review of the resulting proof before it is published in its final citable form. Please note that during the production process errors may be discovered which could affect the content, and all legal disclaimers that apply to the journal pertain.
While the data described in this manuscript was collected and initially analyzed at Wake Forest University Health Sciences, during subsequent revision of this manuscript Drs. Dougherty, Marsh-Richard, and Mathias relocated and are now affiliated with the University of Texas Health Science Center at San Antonio, TX.
References
- Acheson A, Reynolds B, Richards JB, de Wit H. Dazepam impairs behavioral inhibition but not delay discounting or risk taking in healthy adults. Exp. Clin. Psychopharmacol. 2006;14:190–198. doi: 10.1037/1064-1297.14.2.190. [DOI] [PubMed] [Google Scholar]
- Allen TJ, Moeller FG, Rhoades HM, Cherek DR. Impulsivity and history of drug dependence. Drug. Alc. Dep. 1998;50:137–145. doi: 10.1016/s0376-8716(98)00023-4. [DOI] [PubMed] [Google Scholar]
- Barratt ES, Patton JH. Impulsivity: Cognitive, behavioral and psychophysiological correlates. In: Zuckerman M, editor. Biological Bases of Sensation Seeking, Impulsivity, and Anxiety. Hillsdale, NJ: Lawrence Earlbaum Associates; 1983. pp. 77–121. [Google Scholar]
- Beck LH, Bransome ED, Jr, Mirsky A, Rosvold HE, Sarason I. A continuous performance test of brain damage. J Consult Psychol. 1956;20:343–350. doi: 10.1037/h0043220. [DOI] [PubMed] [Google Scholar]
- Benjamin L, Wulfert E. Dispositional correlates of addictive behaviors in college women: Binge eating and heavy drinking. Eat. Behav. 2005;6:197–209. doi: 10.1016/j.eatbeh.2003.08.001. [DOI] [PubMed] [Google Scholar]
- Buydens-Branchey L, Branchey MH, Noumair D. Age of alcoholism onset: I. Relationship to psychopathology. Arch. Gen. Psychiatry. 1989;46:225–231. doi: 10.1001/archpsyc.1989.01810030031004. [DOI] [PubMed] [Google Scholar]
- de Wit H, Enggasser JL, Richards JB. Acute administration of d-amphetamine decreases impulsivity in healthy volunteers. Neuropsychopharmacology. 2002;27:813–825. doi: 10.1016/S0893-133X(02)00343-3. [DOI] [PubMed] [Google Scholar]
- Dom G, Hulstijn W, Sabbe B. Differences in impulsivity and sensation seeking between early-and late-onset alcoholics. Addict. Behav. 2006;31:298–308. doi: 10.1016/j.addbeh.2005.05.009. [DOI] [PubMed] [Google Scholar]
- Dougherty DM, Bjork JM, Harper RA, Marsh DM, Moeller FG, Mathias CW, Swann AC. Behavioral impulsivity paradigms: A comparison in hospitalized adolescents with disruptive behavior disorders. J. Child. Psychol. Psychiatry. 2003b;44:1145–1157. doi: 10.1111/1469-7610.00197. [DOI] [PubMed] [Google Scholar]
- Dougherty DM, Bjork JM, Harper RA, Mathias CW, Moeller FG, Marsh DM. Validation of the Immediate and Delayed Memory Tasks in hospitalized adolescents with disruptive behavior disorders. Psychol. Rec. 2003c;53:509–532. doi: 10.1111/1469-7610.00197. [DOI] [PubMed] [Google Scholar]
- Dougherty DM, Marsh DM. Immediate and Delayed Memory Tasks (IMT/DMT 2.0): a research tool for studying attention, memory, and impulsive behavior [Manual] Houston, TX: Neurobehavioral Research Laboratory and Clinic, University of Texas Health Science Center at Houston; 2003. [Google Scholar]
- Dougherty DM, Marsh DM, Mathias CW. Immediate and Delayed Memory Tasks: A computerized measure of memory, attention, and impulsivity. Behav. Res. Methods. Instrum. Comput. 2002;34:391–398. doi: 10.3758/bf03195467. [DOI] [PubMed] [Google Scholar]
- Dougherty DM, Marsh DM, Mathias CW, Swann AC. The conceptualization and role of impulsivity: Bipolar disorder and substance abuse. Psychiatric Times July. 2005a:32–35. [Google Scholar]
- Dougherty DM, Marsh DM, Moeller FG, Chokshi RV, Rosen VC. Effects of moderate and high doses of alcohol on attention, impulsivity, discriminability, and response bias in immediate and delayed memory task performance. Alcohol. Clin. Exp. Res. 2000;24:1702–1711. [PubMed] [Google Scholar]
- Dougherty DM, Mathias CW, Marsh DM. Laboratory Measures of Impulsivity. In: Coccaro EF, editor. Aggression: Assessment and Treatment. New York: Marcel Dekker Publishers; 2003a. pp. 247–265. [Google Scholar]
- Dougherty DM, Mathias CW, Marsh DM. GoStop Impulsivity Paradigm (Version 1.0) [Manual] Houston, TX: Neurobehavioral Research Laboratory and Clinic, University of Texas Health Science Center at Houston; 2003d. [Google Scholar]
- Dougherty DM, Mathias CW, Marsh DM, Jagar AA. Laboratory behavioral measures of impulsivity. Behav. Res. Methods. 2005b;37:82–90. doi: 10.3758/bf03206401. [DOI] [PubMed] [Google Scholar]
- Dougherty DM, Mathias CW, Papageorgiou TD, Marsh DM. Single Key Impulsivity Paradigm (Version 1.0) [Manual] Houston, TX: Neurobehavioral Research Laboratory and Clinic, University of Texas Health Science Center at Houston; 2003e. [Google Scholar]
- Dougherty DM, Moeller FG, Steinberg JL, Marsh DM, Hines SE, Bjork JM. Alcohol increases commission error rates for a Continuous Performance Test. Alcohol. Clin. Exp. Res. 1999;23:1342–1351. [PubMed] [Google Scholar]
- Dougherty DM, Mathias CW, Marsh-Richard DM, Furr RM, Nouvion SO, Dawes MA. Distinctions in behavioral impulsivity: Implications for substance abuse research. Addict Disord Treat. doi: 10.1097/ADT.0b013e318172e488. In Press. [DOI] [PMC free article] [PubMed] [Google Scholar]
- First MB, Spitzer RL, Gibbon M, Williams JBW. Biometrics Research. NY: New York State Psychiatric Institute; 2001. Structured Clinical Interview for DSM-IV-TR Axis I Disorders, Research Version, Non-patient Edition (SCID-I/NP) [Google Scholar]
- Hindmarch I, Kerr JS, Sherwood N. The effects of alcohol and other drugs on psychomotor performance and cognitive function. Alcohol Alcohol. 1991;26:71–79. [PubMed] [Google Scholar]
- Irwin M, Schuckit M, Smith TL. Clinical importance of age at onset in Type 1 and Type 2 primary alcoholics. Arch. Gen. Psychiatry. 1990;47:320–324. doi: 10.1001/archpsyc.1990.01810160020003. [DOI] [PubMed] [Google Scholar]
- Marcinski CA, Combs SW, Fillmore MT. Increased sensitivity to the disinhibiting effects of alcohol in binge drinkers. Psychol. Addict. Behav. 2007;21:346–354. doi: 10.1037/0893-164X.21.3.346. [DOI] [PubMed] [Google Scholar]
- Marsh DM, Dougherty DM, Mathias CW, Moeller FG, Hicks LR. Comparison of women with high and low trait impulsivity using laboratory impulsivity models of response –disinhibition and reward-choice. Pers. Individ. Dif. 2002;33:1291–1310. [Google Scholar]
- McDonald J, Schleifer L, Richards JB, de Wit H. Effects of THC on behavioral measures of impulsivity in humans. Neuropsychopharm. 2003;28:1356–1365. doi: 10.1038/sj.npp.1300176. [DOI] [PubMed] [Google Scholar]
- Moeller FG, Barratt ES, Dougherty DM, Schmitz JM, Swann AC. Psychiatric aspects of impulsivity. Am. J. Psychiatry. 2001;158:1783–1793. doi: 10.1176/appi.ajp.158.11.1783. [DOI] [PubMed] [Google Scholar]
- Mulvihill LE, Skilling TA, Vogel-Sprott M. Alcohol and the ability to inhibit behavior in men and women. J. Stud. Alc. 1997;58:600–605. doi: 10.15288/jsa.1997.58.600. [DOI] [PubMed] [Google Scholar]
- Ortner CNM, MacDonald TK, Olmstead MC. Alcohol intoxication reduces impulsivity in the delay-discounting paradigm. Alcohol Alcohol. 2003;38:151–156. doi: 10.1093/alcalc/agg041. [DOI] [PubMed] [Google Scholar]
- Patton JH, Stanford MS, Barratt ES. Factor structure of the Barratt Impulsiveness Scale. J. Clin. Psychol. 1995;51:768–774. doi: 10.1002/1097-4679(199511)51:6<768::aid-jclp2270510607>3.0.co;2-1. [DOI] [PubMed] [Google Scholar]
- Petry NM. Delay discounting of money and alcohol in activity using alcoholics, currently abstinent alcoholics, and controls. Psychopharmacol. 2001;154:243–250. doi: 10.1007/s002130000638. [DOI] [PubMed] [Google Scholar]
- Poikolainen K. Risk factors for alcohol dependence: A case-control study. Alcohol Alcohol. 2000;35:190–196. doi: 10.1093/alcalc/35.2.190. [DOI] [PubMed] [Google Scholar]
- Psychological Corporation. Wechsler Abbreviated Scale of Intelligence (WASI) Manual. San Antonio, TX: Harcourt Brace and Company; 1999. [Google Scholar]
- Reynolds B, Richards JB, Dassinger M, de Wit H. Therapeutic doses of diazepam do not alter impulsive behavior in humans. Pharmacol. Biochem. Behav. 2004;79:17–24. doi: 10.1016/j.pbb.2004.06.011. [DOI] [PubMed] [Google Scholar]
- Reynolds B, Richards JB, de Wit H. Acute-alcohol effects on the Experiential Discounting Task (EDT) and a question-based measure of delay discounting. Pharmacol. Biochem. Behav. 2006;83:194–202. doi: 10.1016/j.pbb.2006.01.007. [DOI] [PubMed] [Google Scholar]
- Richards JB, Zhang L, Mitchell SH, de Wit H. Delay or probability discounting in a model of impulsive behavior: Effect of alcohol. J. Exp. Anal. Behav. 1999;71:121–143. doi: 10.1901/jeab.1999.71-121. [DOI] [PMC free article] [PubMed] [Google Scholar]
- Soloff PH, Lynch KG, Moss HB. Serotonin, impulsivity, and alcohol use disorders in the older adolescent: A psychobiological study. Alcohol. Clin. Exp. Res. 2000;24:1609–1619. [PubMed] [Google Scholar]
- Zuckerman M, Kuhlman DM. Personality and risk-taking: Common biosocial factors. J. Pers. 2000;68:999–1029. doi: 10.1111/1467-6494.00124. [DOI] [PubMed] [Google Scholar]