Abstract
A polypurine (guanine)/polypyrimidine (cytosine)–rich sequence within the proximal promoter region of the human RET oncogene has been shown to be essential for RET basal transcription. Specifically, the polypurine-rich strand within this region consists of five consecutive runs of guanines, which is consistent with the general motif capable of forming intramolecular G-quadruplexes. Here we demonstrate that in the presence of 100 mM K+, this polypurine-rich strand has the ability to adopt two intramolecular G-quadruplex structures in vitro. Moreover, comparative circular dichroism (CD) and DMS footprinting studies have revealed that the 3′-G-quadruplex structure is a parallel-type intramolecular structure containing three G-tetrads. The G-quadruplex-interactive agents TMPyP4 and telomestatin further stabilize this G-quadruplex structure. In addition, we demonstrate that the complementary C-rich strand forms an i-motif structure in vitro, as shown by CD spectroscopy and chemical footprinting. This 19-mer duplex sequence is predicted to form stable intramolecular G-quadruplex and i-motif species having minimum symmetrical loop sizes of 1:3:1 and 2:3:2, respectively. Together, our results indicate that stable G-quadruplex and i-motif structures can form within the proximal promoter region of the human RET oncogene, suggesting that these secondary structures play an important role in transcriptional regulation of this gene.
Keywords: G-quadruplex, i-motif, RET, G-quadruplex-interactive agents
INTRODUCTION
The RET proto-oncogene encodes a receptor-type tyrosine kinase that has been implicated in the development of several human cancers, especially thyroid cancer.1–6 In particular, the majority of cancer patients diagnosed with multiple endocrine neoplasia types 2A and 2B and familial medullary thyroid carcinomas are known to carry germline mutations in the exon region, encoding one of three specific cysteine residues found in the extracellular domain of the RET protein. RET protein levels have also been found to be overexpressed in medullary thyroid carcinomas and pheochromocytomas.7–10 Therefore, the RET protein has been investigated as a potential therapeutic target in preclinical approaches for the treatment of RET-associated cancers using small molecules, monoclonal antibodies, or gene therapy.3,11
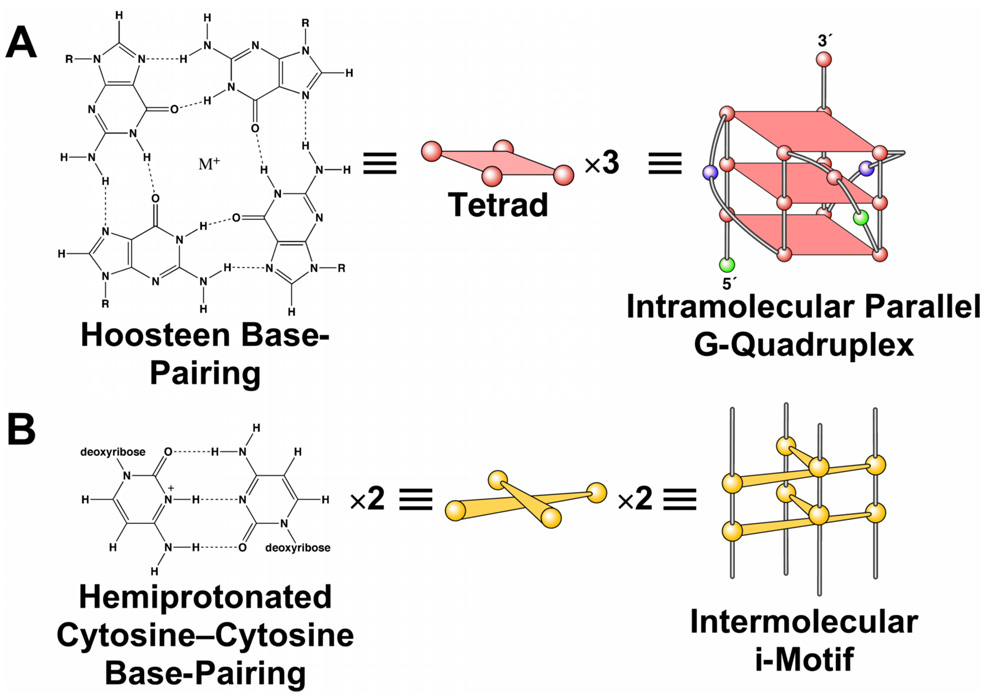
A study of the transcriptional regulation of the RET proto-oncogene in a TT cell line revealed that the human RET promoter is a TATA-less promoter and has three GC boxes corresponding to three Sp1 binding sites in the proximal promoter region.12,13 Two of the GC boxes (Figure 1) that are located between −59 and −25 relative to the transcription start site have been shown to be essential for basal promoter activity.12,13 In this region the top and bottom strands are extremely C-rich and G-rich, respectively (Figure 1). The G-rich and C-rich sequences, which are found in the promoter region of genes responsible for cell growth and proliferation, are very dynamic in nature and have the ability to adopt different non-B-DNA conformations, such as single-stranded DNA and hairpin structures.14,15 More specifically, the G-rich sequences can fold into G-quadruplex structures, while the C-rich sequences may adopt i-motif structures.16,17 A G-quadruplex structure is formed by stacked G-tetrads, a planar association of four guanines held together by Hoogsteen bonds (Figure 2A).18 Once the G-quadruplex forms in the G-rich strand, the less stable complementary C-rich strand has the opportunity to fold into an i-motif structure, a tetrameric structure formed of two parallel duplexes through the intercalation of hemiprotonated cytosine–cytosine base pairs at slightly acidic pH levels (Figure 2B). Recently it has been shown that these putative regions, which also are identified as NHEs, are enriched in the upstream regions from transcriptional start site by as much as 24-fold.19
Figure 1.
Schematic diagram of the proximal promoter region of the RET proto-oncogene. Two GC boxes are labeled. Five runs of guanines (I, II, III, IV and V) are underlined.
Figure 2.
Schematic diagram of a G-quadruplex and an i-motif structure. (A) Four guanines form a G-tetrad through Hoogsteen bonds, and three G-tetrads form a parallel G-quadruplex structure in the c-Myc promoter. (B) Hemiprotonated cytosine–cytosine base pair. Two C+–C pairs form an intermolecular i-motif structure.
G-quadruplex structures have been reported to form in vitro in the human telomere ends and the promoters of different oncogenes, such as c-Myc, c-kit, VEGF, Bcl-2, and Rb.20–31 In addition, the G-quadruplex structure formed by the G-rich sequence of the c-Myc promoter has been identified as a repressor element in the regulation of c-Myc expression. The compound TMPyP4 has been shown to downregulate the expression of c-Myc by inducing and stabilizing G-quadruplex formation to inhibit its promoter activity.20 This suggests that these unique secondary DNA structures could be used as targets for anticancer drug design. However, the structures and functions of these structures are still not fully understood.
Since the proximal promoter region of the human RET proto-oncogene contains a polypurine/polypyrimidine tract, we investigated whether the G-rich and C-rich strands in this oncogene are able to form G-quadruplex and i-motif structures. Here we demonstrate that the G-rich strand and the complementary C-rich strand in the proximal promoter of the RET gene are capable of forming G-quadruplex and i-motif structures in vitro, respectively. Furthermore, G-quadruplex-interactive agents such as TMPyP4 and telomestatin are shown to stabilize the G-quadruplex structure formed by the G-rich strand of the RET promoter.
RESULTS
Formation of G-Quadruplex Structures in the G-Rich Strand of the RET Promoter
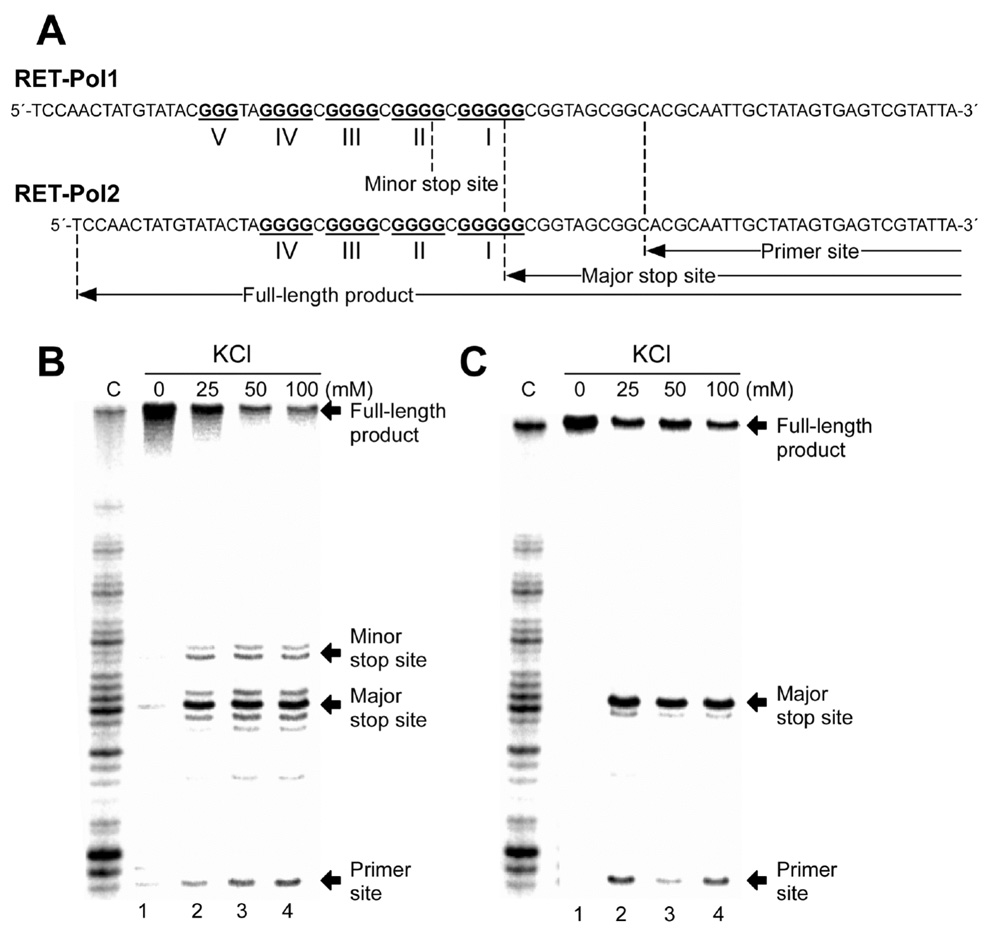
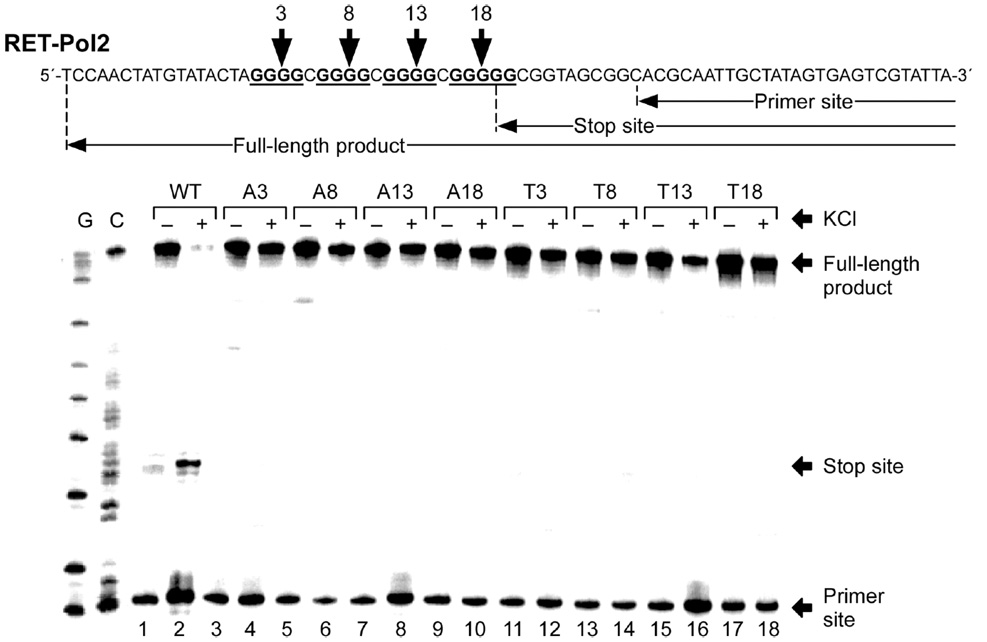
To determine if the G-rich strand of the RET promoter could form G-quadruplex structures in vitro, a DNA polymerase stop assay was performed, as previously described.28 If the DNA template is capable of forming any secondary structures, such as a G-quadruplex, the elongation of the Taq polymerase will be arrested during primer extension because the enzyme is unable to bypass the secondary structures. We first performed a DNA polymerase stop assay with the wild-type RET-Pol1 template containing five runs of guanines (I, II, III, IV, and V) (Figure 3A). The results showed that in the absence of KCl, there is no arrest of DNA synthesis (Figure 3B, lane 1). However, in the presence of KCl (25–100 mM), a significant amount of arrested synthesis product appears at the 3′-end of guanine repeat I (Figure 3B, lanes 2–4). The minor stop product at the 3′-end of guanine repeat II indicates the formation of the G-quadruplex by guanine repeats II–V. This data suggests that the four consecutive guanine repeats I–IV in the G-rich strand of the RET promoter form the major G-quadruplex in the presence of K+. This suggestion is further supported by the presence of the same arrested synthesis product in a DNA polymerase stop assay with the wild-type RET-Pol2 template (Figure 3A), which does not contain guanine repeat V (Figure 3C, lanes 2–4). To specifically determine the guanine residues involved in the formation of the G-quadruplex structure, several point mutations (G-to-A or G-to-T) were introduced at positions 3, 8, 13, and 18 within the template DNA and investigated using the polymerase stop assay. As shown in Figure 4, a point mutation at these specific guanine positions can disrupt the formation of the G-quadruplex structure in the presence of 100 mM KCl (Figure 4, lanes 3–18), which suggests that G3, G8, G13 and G18 are involved in the formation of G-tetrads. Clearly, the results of the polymerase stop assay using the two wild-type (RET-Pol1 and RET-Pol2) and eight different mutant templates demonstrate that guanine repeats I–IV in the RET proto-oncogene promoter are able to form a G-quadruplex structure in the presence of K+.
Figure 3.
Taq polymerase stop assay of the G-rich region of the RET promoter. (A) The sequences of the RET-Pol1 and RET-Pol2 templates used in the Taq polymerase stop assay. The five runs of guanines are labeled I–V. The full-length product, minor stop site, major stop site, and primer site are indicated with arrows. (B) and (C) show the Taq polymerase stop assay with RET-Pol1 and RET-Pol2, respectively, with increasing concentrations of KCl (lane 1, 0 mM KCl; lane 2, 25 mM KCl; lane 3, 50 mM KCl, lane 4, 100 mM KCl). For both (B) and (C), the full-length product, minor stop site, major stop site, and primer site are indicated with arrows on the right. The sequencing reaction for C is shown on the left side of each gel.
Figure 4.
Taq polymerase stop assay with the wild-type template (RET-Pol2) and mutant templates. The wild-type template (RET-Pol2) is shown on the top, with arrows indicating the primer site, stop site and full-length product. The four consecutive runs of guanines are underlined in bold, with guanines 3, 8, 13, and 18 indicated. For mutant templates (A3, A8, A13, A18, T3, T8, T13, and T18), the letter refers to the mutated nucleotide and the number refers to the position (3, 8, 13, or 18) on RET-Pol2. For example, A3 means a G-to-A mutation at position 3 on RET-Pol2. The Taq polymerase stop assay was carried out in the absence of (−) or in the presence of 100 mM KCl (+). Sequencing reactions for G and C are shown on the left side of the gel. Lanes 1 and 2 are reactions with the wild-type template (RET-Pol2). Lanes 3–18 are reactions with the different mutant templates. The full-length product, stop site, and primer site are indicated with arrows on the right.
DMS Footprinting Suggests an Intramolecular G-Quadruplex
DMS footprinting is used to determine which guanines are involved in the formation of the G-quadruplex. The N7 position of each of the guanines involved in the formation of a G-quadruplex through Hoogsteen bonding is protected against methylation by DMS, which attacks these guanine positions.20 In the absence of potassium, RET31 (Table 1), a sequence containing guanine repeats I–IV, was cleaved randomly at every guanine, which suggests that it is mainly in a unstructured form (Figure 5A, lane 3). However, in the presence of 100 mM potassium, some guanines were either partially or fully protected from piperidine cleavage (G2–G4, G6–G9, G12–G14, and G16–G19), whereas others showed enhanced cleavage (G1, G11, and G20) (Figure 5A, lane 4). On the basis of the DMS footprinting pattern, we propose that the G-quadruplex has three planar tetrads formed by four runs of guanines, specifically G2–G4, G6–G8, G12–G14 and G16–G18. G1, G9, G11, G19 and G20 are most likely located either exterior to the G-quadruplex (G1, G19, G20) or in the connecting loops of the G-tetrads (G9, G11) since they show cleavage.
Table 1.
Oligonucleotides Used in This Study.*
| RET31 | 5′-TTTTTAGGGGCGGGGCGGGGCGGGGGTTTTT-3′ |
| Myc-1245 | 5′-TGGGGAGGGTTTTTAGGGTGGGGA-3′ |
| RET1 | 5′-CCGCCCCCGCCCCGCCCCGCCCCTA-3′ |
See Figure 3 for sequences of wild-type RET-Pol1 and RET-Pol2.
Figure 5.
DMS footprinting, CD spectra, and melting curve of the G-quadruplex structure formed by RET31. (A) DMS footprinting of an intramolecular G-quadruplex structure. Lanes 1 and 2 are the AG and TC sequencing reactions, lane 3 is the DMS footprinting in the absence of KCl, and lane 4 is the one in the presence of 100 mM KCl. The partial sequence of RET31 is shown to the right of the gel. The protected guanines are indicated by open circles. Guanines 1, 9, 11, 19, and 20 show enhanced cleavage (closed circles) and partial protection (semi-open circles). (B) The superimposition of the CD spectrum of RET31 and that of myc-1245. (C) The CD melting curve of the G-quadruplex structure. (D) The proposed G-quadruplex structure formed by RET31
The G-Rich Strand of the RET Promoter Forms a Stable Parallel G-Quadruplex
CD spectroscopy is generally used to determine the strand orientation of a G-quadruplex structure, especially to distinguish between parallel and antiparallel G-quadruplex structures, which have positive peaks at ~260 nm and ~295 nm, respectively.25,29–31 Myc-1245 (Table 1), a modified form of the G-rich sequence from the NHE III1 in the c-Myc promoter, has been shown by NMR analysis to form a stable intramolecular parallel-stranded G-quadruplex containing three double-chain reversal loops containing 1, 6, and 1 bases in the connecting loops.21 The CD spectra of myc-1245 and RET31 in the presence of 100 mM K+ were compared and found to be similar, with positive peaks at ~262 nm and small negative peaks at ~240 nm (Figure 5B), which are consistent with a parallel G-quadruplex structure.
To further understand the stability of the G-quadruplex structure formed by RET31, the CD melting curve of the structure in the presence of 100 mM K+ was determined by monitoring the molar ellipticity at 262 nm. We found that the melting temperature in the presence of 100 mM K+ is ~80 °C (Figure 5C), which suggests that the G-quadruplex structure is a very stable secondary structure (Figure 5D).
G-Quadruplex-Interactive Agents Stabilize the G-Quadruplex Structure in the RET Promoter
The DNA polymerase stop assay using RET-Pol2 (Figure 3C) as a DNA template was performed to evaluate the ability of the G-quadruplex-interactive agents TMPyP4 and telomestatin to stabilize the G-quadruplex structure formed by the G-rich strand of the RET promoter region. TMPyP4 is a cationic porphyrin that has been shown to interact specifically with G-quadruplex structures.32,33 Telomestatin is a natural product and has been shown to be a potent telomerase inhibitor through interaction with G-quadruplex structures in the human telomeric sequence.34,35 Our results revealed that TMPyP4 and telomestatin both stabilize the G-quadruplex in RET-Pol2 in the presence of 10 mM KCl/NaCl in a concentration-dependent manner (Figure 6A). It is worthwhile to note that the concentration of potassium (10 mM) required to stabilize the RET G-quadruplex structures in the presence of TMPyP4 or telomestatin was much lower than that (100 mM) required to stabilize the RET G-quadruplex structures without TMPyP4 or telomestatin. These G-quadruplex-interactive agents might have a synergistic effect with potassium ions in stabilizing RET G-quadruplex structures by binding to them through external stacking at the ends of the G-quadruplexes rather than through intercalation between the G-tetrads. The CD titrations of TMPyP4 and telomestatin with RET31 (Figure 6, B and C) do not show any change in positive or negative peaks at ~262 nm and ~240 nm, except for a reduction in the intensity in the case of TMPyP4. Thus, no change in folding pattern is anticipated.
Figure 6.
DNA polymerase stop assay using RET-Pol2 as the template with the addition of increasing concentrations of TMPyP4 (0, 1, 2 and 5 µM) and telomestatin (0, 0.1, 0.5 and 2 µM) in 10 mM KCl/NaCl. Sequencing reactions for G and C are shown on the left side of the gel. (B) CD spectra of RET31 with increasing concentrations of TMPyP4 from 1-mole equivalence to 4-mole equivalence in Tris-HCl buffer (20 mM, pH 7.6), 10 mM KCl. (C) CD spectra of RET31 with increasing concentrations of telomestatin from 1-mole equivalence to 4-mole equivalence in Tris-HCl buffer (20 mM, pH 7.6), 10 mM KCl.
Formation of an i-Motif structure in the C-Rich strand of the RET Promoter
CD spectroscopy
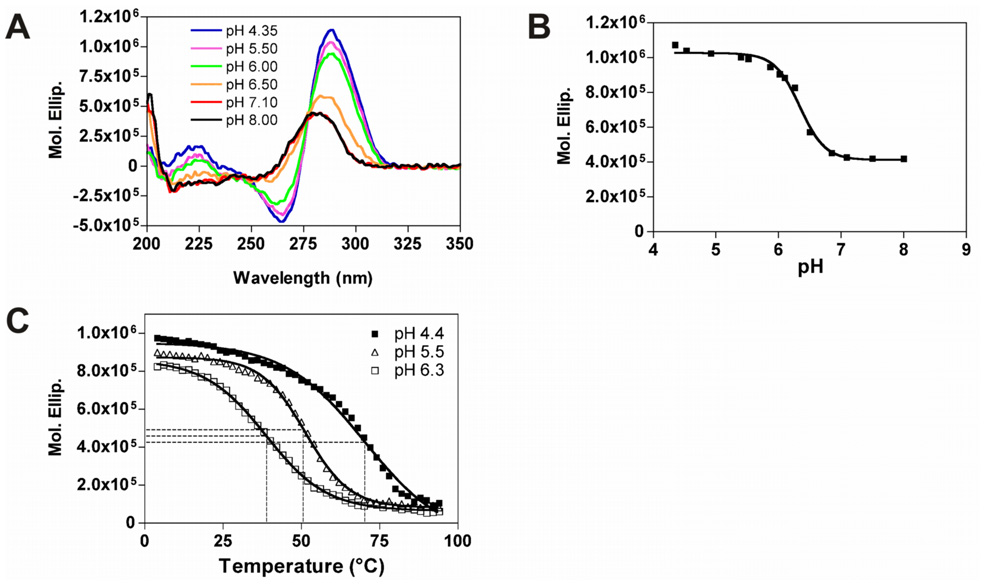
CD spectroscopy is widely used to determine the formation of i-motif structures because their CD spectra show a positive peak at ~290 nm.36 The CD spectra of RET1 (Table 1), whose sequence is identical to the region of the C-rich strand of the human RET promoter, were collected at different pHs (from 4.4 to 8.0). As shown in Figure 7A, at acidic pH levels (<6.3), the spectra have positive peaks at ~288 nm and negative peaks at ~264 nm, which are indicative of i-motif structure formation,16,26,37 while at pH levels greater than 7, the positive peaks decrease and shift to ~280 nm. The transition mid-point at pH 6.4 (± 0.2) was determined by plotting the molar ellipticity at 288 nm versus pH (Figure 7B).
Figure 7.
CD spectra of RET1 recorded at room temperature in Tris-acetate buffer (50 mM). (A) Fifteen spectra were collected, and selected spectra at pH 4.35, pH 5.50, pH 6.00, pH 6.50, pH 7.10, and pH 8.00 are shown. (B) pH dependence of the molar ellipticity at 288 nm (C) The CD melting curves of RET1 at three different pHs.
We next examined the stability of the i-motif structure formed by RET1 at three different pH levels (pH 4.4, pH 5.5, and pH 6.3). The CD melting curves of the i-motif structure formed by RET1 were collected by monitoring the molar ellipticity at 288 nm in a temperature range from 4 °C to 95 °C (Figure 7C). By plotting the molar ellipticity at 288 nm against temperature, the Tm levels of RET31 at pH 4.4, pH 5.5, and pH 6.3 were determined to be 70.1 °C, 51.3 °C, and 38.7 °C, respectively, which shows that the stability of the i-motif structure is pH dependent and that the acidic pH is able to stabilize the i-motif structure.
Br2 footprinting
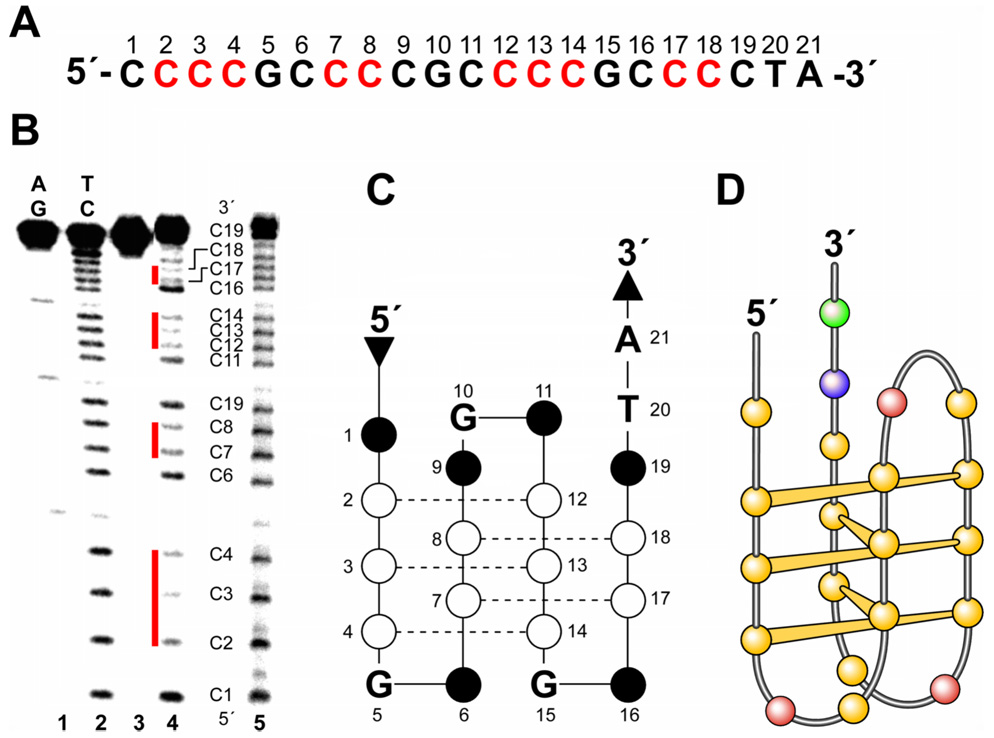
The oligonucleotide RET1 (Figure 8A) contains four cytosine repeats comprising four consecutive cytosines, corresponding to the sequence motifs that are generally known to fold into the i-motif intramolecularly at acidic pH levels. In this study, Br2 protection experiments were carried out to identify the specific cytosine residues of RET1 that are involved in base pairings and intercalations to form the i-motif structure. Br2 is known to react selectively with the (5,6) double bond of the cytosine within DNA, resulting in 5-bromodeoxycytidine.38 In particular, Br2 reacts with the cytosine residues in a single-stranded region 10-fold higher than those in duplex DNA.38 Therefore, we presumed that the cytosine residues in the loop regions of the i-motif structure would be more reactive to Br2 than other cytosine residues involved in base pairing and intercalation, allowing us to deduce specific cytosine residues required for base pairing and intercalation in i-motif structure. As shown in the autoradiogram in Figure 8B, we found that three consecutive cytosine residues within the first and third cytosine repeats were protected from bromination by Br2, while two consecutive cytosine residues were protected from bromination within the second and fourth cytosine repeats (red letters in Figure 8A) at acidic pH (5.2). Interestingly, other cytosine residues adjacent to the cytosine residues protected from bromination within the same repeat showed enhanced reactivity to Br2, suggesting their location in the loop regions of the i-motif. However, reactivity of Br2 toward cytosine residues appears to be uniform under alkaline condition (pH = 8.0), which is unfavorable for the formation of i-motif structures (compare lanes 3 and 5 in Figure 8B). On the basis of the results from Br2 footprinting, we deduced the base-pairing and intercalation topology of the i-motif formed by the intramolecular folding of the RET1 sequence (Figure 8, C and D). We propose that one parallel double helix is formed by three C+–C base pairings between the first and third cytosine-repeat forms of RET1, while the other is formed by two C+–C base pairings between the second and fourth cytosine repeats, to maximize π-stacking.
Figure 8.
Br2 footprinting of the unimolecular i-motif structures formed by RET1. (A) Sequence of RET1 oligonucleotide used in Br2 protection experiments. (B) Autoradiogram of 20% denaturing PAGE experiment to determine cytosine residues involved in base pairing and intercalation to form intramolecular i-motif structures. Lanes 1 (AG) and 2 (TC) represent the purine- and pyrimidine-specific reactions, respectively, to generate sequencing markers. Lanes 3–5 represent reactions without Br2, with Br2 at pH 5.2, and with Br2 at pH 8.0, respectively. (C) Summary of Br2 cleavage. The open circles represent the protected cytosine residues, while closed circles represent enhanced cleavage at the cytosine residues. (D) Folding pattern of the proposed i-motif structure formed by RET1.
DISCUSSION
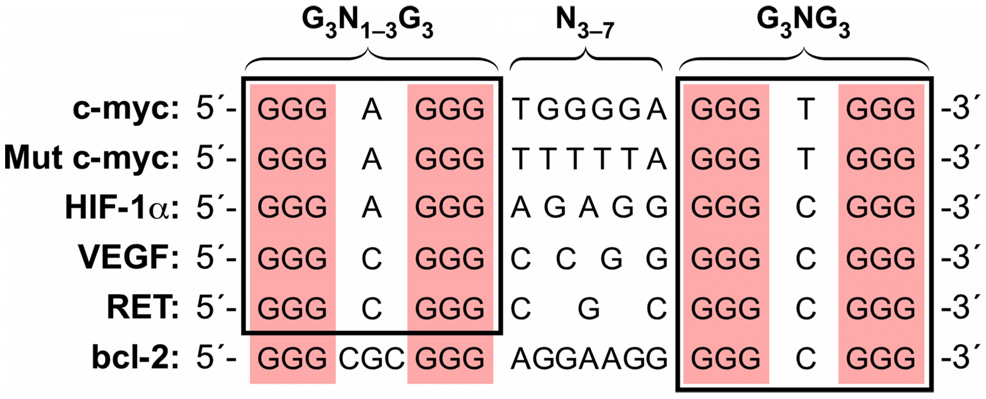
In this report, we describe the formation of the DNA secondary structures by both the G-rich and C-rich stands of the polypurine/polypyrimidine tracts within the RET proximal promoter region. Evidence of the formation of the intramolecular G-quadruplexes by the G-rich strand of the RET promoter region initially came from the results of DMS footprinting experiments carried out with RET31 in the presence of K+. Further CD spectroscopic study revealed that the CD spectrum of RET31 was almost superimposed with that of myc-1245, which was shown to form a parallel G-quadruplex by NMR study, suggesting that the RET31 would also form a parallel G-quadruplex structure. The G-quadruplex adopted by myc-1245 involves a core of three stacked G-tetrads formed by four parallel G-stretches with all anti conformations in the nucleosides and three double-chain reversal loops bridging the three G-tetrad layers.21 On the basis of the CD and DMS footprinting of RET31, we proposed a model of the G-quadruplex (Figure 5D) consisting of three tetrads with four parallel strands connected by three double-chain reversal loops containing 1, 3, and 1 nucleotides, respectively. The principle differences between RET31 and myc-1245 are the size (3 versus 6) and base composition in the central loop. However, among four guanine repeats of RET31, three contain four guanines (G1–G4, G6–G9, and G11–G14) and the remaining repeat contains five guanines (G16–G20). Therefore, in each run of guanines, the three guanines associated with the tetrads can use either the three guanines at the 5′-end (e.g., G1, G2, and G3) or the three at the 3′-end (e.g., G2, G3, and G4), a phenomenon termed guanine slippage.25,39 For stability, two 3:1:3 double-chain reversals are preferentially formed. For this reason, the proposed G-quadruplex structure is probably the major form of the G-quadruplex structures formed by RET31. However, minor structures are still possible. The RET guanine-rich promoter sequence belongs to the growing number of consensus promoter sequences in which at least one G3NG3 motif is found within this element to provide stability to the overall G-quadruplex structure (Figure 9).25
Figure 9.
Comparison of truncated G-quadruplex-forming sequences within selected gene promoters.
In this study, we also demonstrated, on the basis of the RET1 CD spectra, that the C-rich strand of the polypurine/polypyrimidine tracts of the RET promoter is capable of forming an i-motif structure at acidic pH in vitro. Similar observations have been made in previous studies using the C-rich strands of centromeric and telomeric regions of human chromosomes, as well as the promoter regions of the human c-Myc and Rb genes.16,17,26,36,40 In the present study, detailed information on the i-motif topology of RET1 was obtained from the results of Br2 protection experiments, allowing us to deduce the cytosine residues involved in base pairing and intercalation to form an i-motif structure by RET1. On the basis of the results from CD and Br2 protection experiments, the model structure for the RET i-motif was built, involving five C+–C base pairs by four antiparallel C-stretches and three loops bridging four C-stretches (see Figure 8D). Our prediction of an antiparallel i-motif model for RET1 is also based on a similar CD spectrum observed in i-motif structures of the human telomeric C-strand determined by NMR in previous studies.41–43 Interestingly, cytosine residues adjacent to those protected from Br2 showed enhanced reactivity toward Br2, suggesting that they are bases contained in linker loops connecting the tetrads, since Br2 protection experiments have been successfully used to probe the presence of C-bulges or unpaired cytosine residues in double-stranded DNA.38 In summary, our results from both CD and Br2 protection experiments strongly suggest that the C-rich sequence from the RET promoter could fold intramolecularly into a regular i-motif structure rather than an unusual one. In addition, the results from our Br2 protection experiments suggest that this chemical footprinting technique can be a very useful tool for easy and rapid examination of unique DNA structures involving C+–C base pairing in i-motif structures, analogous to the DMS footprinting technique used to characterize G-quadruplex structures. A composite structure of the G-quadruplex and i-motif within a duplex region is shown in Figure 10.
Figure 10.
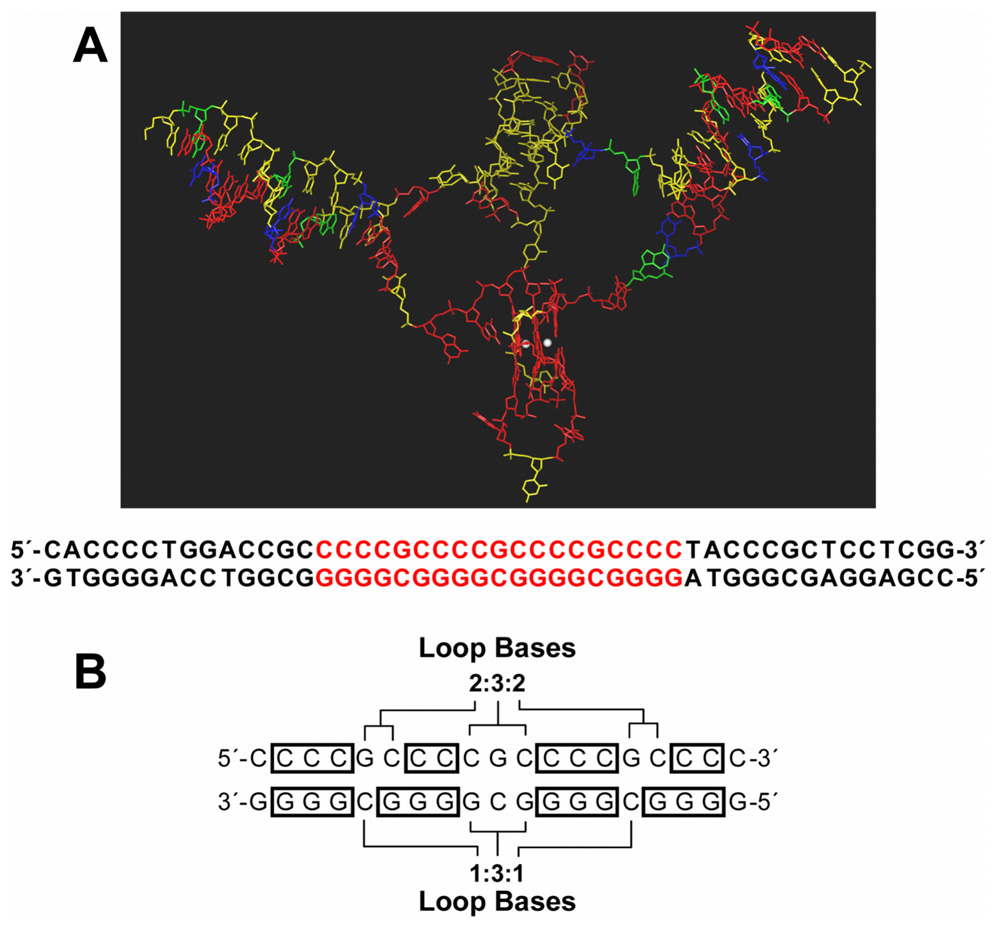
(A) Stable low energy model of the RET promoter sequence (−66 to −19) with i-motif, G-quadruplex, and duplex DNA regions, displayed as capped sticks (adenine = green, guanine = red, thymine = blue, and cytosine = yellow) with potassium ions as CPK model (white). Hydrogen atoms are not shown for clarity. The corresponding RET promoter sequence is shown below the model. DNA bases involved in i-motif and G-quadruplex structure formation are shown in red. (B) Symmetrical arrangement of RET C-rich and G-rich sequences, indicating loop bases and bases participating in the formation of i-motifs and G-quadruplexes (boxes).
Figure 10A shows the molecular model of the RET promoter sequence (−66 to −19) with G-quadruplex, i-motif, and adjacent duplex regions. Both the G-quadruplex and i-motif are conveniently connected with the duplex region at their respective 5′- and 3′-ends without undue distortion of the overall structure. This topological arrangement results in a structure such that G-tetrads of the quadruplex are parallel to the direction of the base pairs (in the duplex region), while C+–C pairs in the i-motif are perpendicular to the duplex. The duplex junction region on each side of the quadruplex and i-motif is structurally deformed. Four base pairs on each side of this region are present as single-stranded helical bases rather than conventional B-DNA base pairs. This allows the structure the degree of flexibility required for the formation and stability of the quadruplex and i-motif within the duplex sequence. The G-quadruplex and i-motif structures are both stable, and the presence of G19 as a capping structure provides additional stability to the G-quadruplex, as compared to the i-motif.
Figure 10B shows the RET G-rich and C-rich sequences, indicating the bases participating in the formation of secondary structures (G-tetrad or C+–C base pair) and loop bases. Significantly, this symmetrical arrangement of bases uses a minimal number of base pairs to give a maximum number of G-tetrads and cytosine–cytosine base pairs to give rise to stable secondary structures. A total of 17 bases form three G-tetrads and three loops (1:3:1 loop sizes) in the G-quadruplex. Similarly, 17 bases on the complementary C-rich strand form five C+–C base pairs and three loops (2:3:2 loop sizes) in the i-motif. These are the minimum number of bases in the loops required to give rise to the formation of stable G-quadruplex and i-motif structures on the complimentary strands. It is tempting to speculate that Nature has selected this precise sequence to maximize G-quadruplex and i-motif stability while still preserving three Sp1 binding sites on duplex DNA. Transcriptional factors, such as hnRNP K, that might bind to the single-stranded elements have not yet been explored.
Targeting DNA secondary structures, specifically a G-quadruplex, in the promoter region is a novel strategy to interfere with oncogene expression, as demonstrated in our previous study of the G-quadruplex in the c-Myc promoter.20 In the c-Myc promoter, the polypurine/polypyrimidine region has been shown to be very dynamic and able to easily adopt non-B-DNA conformations, such as single-stranded DNA, under transcriptionally associated torsional strain in vivo.14 In the event of replication or transcription, the local and transient unwinding of duplex DNA can occur, thus exposing the single-stranded DNA in the GC-rich region of a promoter and allowing G-quadruplex and i-motif structures to form. Recently, the polypurine/polypyrimidine tracks in the proximal promoter regions of genes, such as c-Myc, VEGF, Bcl-2, c-kit, and Rb, which are generally associated with cell growth and proliferation, have been shown to form G-quadruplex and/or i-motif structures in vitro.15,16,20,22,24–26 These unique DNA secondary structures provide additional opportunity and selectivity versus duplex DNA for drug targeting. Previous work in our laboratory has shown that small molecules capable of stabilizing G-quadruplexes in the promoter region of the c-Myc oncogene are able to downregulate its transcription in vivo.20,44 The formation of the G-quadruplex or i-motif in the polypurine/polypyrimidine tracts of the RET promoter in vivo and its role in the transcriptional regulation have yet to be determined.
MATERIALS AND METHODS
Materials
TMPyP4 was purchased from Frontier Scientific, Inc., and dissolved in dimethyl sulfoxide. Telomestatin was kindly provided by Dr. Kazuo Shin-ya (University of Tokyo, Japan). T4 polymerase kinase was purchased from Promega (Madison, WI). Taq DNA polymerase was purchased from Fermentas (Hanover, MD). The oligonucleotides were purchased from Sigma Genosys (Woodlands, Texas).
Preparation and End-Labeling of Oligonucleotides
The 5′-termini of single-stranded oligonucleotides were labeled by incubating oligonucleotides with T4 polynucleotide kinase and [γ-32P]ATP for 1 h at 37 °C. The labeled DNA was purified with a Bio-Spin 6 chromatography column (BioRad) to remove free 32P after inactivation of the kinase by heating at 95 °C for 3 min.
Polymerase Stop Assay
The polymerase stop assay template was designed by placing the RET promoter G-rich sequence (containing either four or five runs of guanines) or the various mutant G-rich sequences in a polymerase stop assay cassette, as described previously.24,28,29,45 5′-end-labeled primer p28 (100 µM) d(TAATACGACTCACTATAGCAATTGCGTG) and template DNA (100 µM) were annealed in an annealing buffer (50 µM Tris-HCl, pH 7.5, 10 µM NaCl) by heating at 95 °C and slowly cooling down to room temperature. The primer-annealed template oligonucleotide was purified by electrophoresis through a 12% native polyacrylamide gel. The purified primer-template DNA was used in a primer extension assay by Taq DNA polymerase, as described previously.29
DMS Footprinting
The oligonucleotide RET31 was 5′-end-labeled and denatured at 90 °C for 5 min before use and cooled slowly down to room temperature in 20 mM Tris-HCl buffer (pH 7.6) with or without 100 mM KCl. The annealed oligonucleotide (20,000 counts/min) was treated with DMS (2.5%) for 5 min. The reaction was stopped by adding the same volume of stop buffer (50% glycerol, 1 µg/µL calf thymus DNA). The sample was resolved on a 16% native polyacrylamide gel to separate the single-stranded DNA and the intramolecular G-quadruplex from other intermolecular quadruplexes by their different electrophoretic mobility. The DNA was recovered from the gel and treated with piperidine (10%) after ethanol precipitation. The cleaved products were resolved on a 16% denaturing polyacrylamide gel.
Br2 Footprinting Experiment
The Br2 footprinting experiment was carried out, in accordance with published procedure,38 to probe the secondary structure formed by C-rich oligomer DNA (RET1). In brief, RET1 was 5′-end-labeled with 32P using T4 polynucleotide kinase and [γ-32P]ATP, and the labeled RET1 was gel-purified using 12% polyacrylamide gel electrophoresis under denaturing conditions (7 M urea). For the Br2 cleavage reaction, the purified 5′-end-labeled RET1 was treated for 20 min with molecular Br2 that was generated in situ by mixing an equal molar concentration (50 mM) of KBr with KHSO5 in the same tube. The reactions were then terminated by adding 50 µL of stop mix containing 0.6 M Na-acetate (pH 5.2) and 10 mg/mL calf thymus DNA, and unreacted Br2 was removed by ethanol precipitation. Following ethanol precipitation, the DNA pellet was dried and resuspended with 100 µL of freshly diluted 1 M piperidine, and the samples were heated at 90 °C for 30 min to induce bromination-specific strand cleavage. Following piperidine treatments, the DNA samples were completely dried and resuspended with alkaline sequencing gel loading dye and applied to a 20% sequencing gel. The purine- and pyrimidine-specific reactions were carried out using formic acid or hydrazine to generate sequencing markers, following published procedure.38
CD Spectroscopy
For the G-quadruplex study, the oligonucleotide RET31 was diluted to a strand concentration of 10 µM in Tris-HCl buffer (20 mM, pH 7.6), 100 mM KCl. For the i-motif study, the RET1 was diluted to a strand concentration of 10 µM in Tris-acetate buffer (50 mM, pH 4.4–8.0). CD spectra were recorded on a Jasco-810 spectrophotometer (Easton, MD) at room temperature, using a quartz cell of 1 mm optical path length and an instrument scanning speed of 100 nm/min, with a response time of 1 s and over a wavelength range of 200–350 nm. To determine the transition mid-point of the i-motif structure, the molar ellipticity at 288 nm against pH was plotted and the mid-point was determined. To determine Tm, the molar ellipticity versus temperature profiles (CD melting curves) were measured at 262 nm for the G-quadruplex and at 288 nm for the i-motif, using a temperature gradient of 1 °C/min from 4 °C to 95 °C.
Molecular Modeling of the RET G-Quadruplex and i-Motif Structures
Modeling of RET G-quadruplex
The NMR solution structure of the human c-Myc promoter quadruplex (PDB code 1XAV) was used as a starting structure.23 Necessary replacements and deletions were done using the Biopolymer module within the Insight II modeling software.46 The RET G-quadruplex structure was then refined as described below.
Modeling of the i-motif
The NMR solution structure of the cytidine-rich strand of the human telomere (PDB code 1ELN) was used as a starting structure.41 Necessary replacements were done and one of the cytosine base pairs was protonated. The i-motif structure was then separately refined.
Refinement of G-quadruplex and i-motif structures
Sodium counter ions were added to the quadruplex and i-motif models. The system was soaked in a 10-Å layer of TIP3P water molecules.47 The system of quadruplex or i-motif soaked in water was then minimized using 5000 steps of Discover 3.0 minimization within Insight II.48 This was followed by molecular dynamics simulations with 40 ps equilibration and 100 ps simulations. Distances and torsions for hydrogen bonds involving G-quadruplex tetrad bases and i-motif cytosine pairs were restrained by means of the upper-bound harmonic restraining function with a force constant of 100 kcal mol−1 Å−2 for distances and 1000 kcal mol−1 rad−2 for torsions. Frames were collected after every 100 femtoseconds. Trajectories were analyzed on the basis of potential energy. The lowest potential energy frame was minimized using 10,000 steps of Discover 3.0 minimization.
Modeling and refinement of complete RET G-quadruplex and i-motif structures
The duplex region of RET was built using the Biopolymer module within Insight II, with standard B-DNA geometries. Various regions of the RET promoter sequence (−66 to −19) were then attached. Charges and potential types were assigned using the Consistent Valence Force Field within Insight II. Sodium counter ions were added. A layer of pre-equilibrated water molecules (10 Å) was added around the molecule. This whole system was then minimized using Discover 3.0 within Insight II. Sodium counter ions were added to the quadruplex and i-motif models. The system was soaked in a 10-Å layer of TIP3P water molecules. This system was then refined using a two-stage procedure. In the first stage, molecular dynamics simulations with 40 ps equilibration and 100 ps simulations were performed with restraints for distances and torsions for hydrogen bonds involving G-quadruplex tetrad bases, i-motif cytosine pairs, and DNA base pairs in the duplex region. Frames were collected after every 100 femtoseconds. Trajectories were analyzed on the basis of potential energy. The lowest potential energy frame was minimized using 10,000 steps of Discover 3.0 minimization. This was followed by a second stage of similar dynamics protocol (40 ps equilibration and 100 ps simulations) with no restraints on duplex DNA base pairs, and the restraints on the quadruplex and i-motif were kept intact. This resulted in a final stable structure after minimization.
ACKNOWLEDGMENT
This research was supported by the National Institutes of Health (CA94166 and CA95060). Tom Dexheimer and Steven Carey provided valuable assistance critiquing early versions of this manuscript. We are grateful to David Bishop for preparing, proofreading, and editing the final version of the manuscript and figures.
REFERENCES
- 1.Takahashi M, Buma Y, Iwamoto T, Inaguma Y, Ikeda H, Hiai H. Oncogene. 1988;3:571–578. [PubMed] [Google Scholar]
- 2.Jhiang SM. Oncogene. 2000;19:5590–5597. doi: 10.1038/sj.onc.1203857. [DOI] [PubMed] [Google Scholar]
- 3.Kodama Y, Asai N, Kawai K, Jijiwa M, Murakumo Y, Ichihara M, Takahashi M. Cancer Sci. 2005;96:143–148. doi: 10.1111/j.1349-7006.2005.00023.x. [DOI] [PMC free article] [PubMed] [Google Scholar]
- 4.Arighi E, Borrello MG, Sariola H. Cytokine Growth Factor Rev. 2005;16:441–467. doi: 10.1016/j.cytogfr.2005.05.010. [DOI] [PubMed] [Google Scholar]
- 5.Kouvaraki MA, Shapiro SE, Perrier ND, Cote GJ, Gagel RF, Hoff AO, Sherman SI, Lee JE, Evans DB. Thyroid. 2005;15:531–544. doi: 10.1089/thy.2005.15.531. [DOI] [PubMed] [Google Scholar]
- 6.Cho NH, Lee HW, Lim SY, Kang S, Jung WY, Park CS. Pathology. 2005;37:10–13. doi: 10.1080/00313020400024816. [DOI] [PubMed] [Google Scholar]
- 7.Takaya K, Yoshimasa T, Arai H, Tamura N, Miyamoto Y, Itoh H, Nakao K. J. Mol. Med. 1996;74:617–621. doi: 10.1007/s001090050065. [DOI] [PubMed] [Google Scholar]
- 8.Santoro M, Rosati R, Grieco M, Berlingieri MT, D’Amato GL, de Franciscis V, Fusco A. Oncogene. 1990;5:1595–1598. [PubMed] [Google Scholar]
- 9.Sawai H, Okada Y, Kazanjian K, Kim J, Hasan S, Hines OJ, Reber HA, Hoon DS, Eibl G. Cancer Res. 2005;65:11536–11544. doi: 10.1158/0008-5472.CAN-05-2843. [DOI] [PubMed] [Google Scholar]
- 10.Veit C, Genze F, Menke A, Hoeffert S, Gress TM, Gierschik P, Giehl K. Cancer Res. 2004;64:5291–5300. doi: 10.1158/0008-5472.CAN-04-1112. [DOI] [PubMed] [Google Scholar]
- 11.Putzer BM, Drosten M. Trends Mol. Med. 2004;10:351–357. doi: 10.1016/j.molmed.2004.06.002. [DOI] [PubMed] [Google Scholar]
- 12.Andrew SD, Delhanty PJ, Mulligan LM, Robinson BG. Gene. 2000;256:283–291. doi: 10.1016/s0378-1119(00)00302-4. [DOI] [PubMed] [Google Scholar]
- 13.Munnes M, Patrone G, Schmitz B, Romeo G, Doerfler W. Oncogene. 1998;17:2573–2583. doi: 10.1038/sj.onc.1202165. [DOI] [PubMed] [Google Scholar]
- 14.Michelotti GA, Michelotti EF, Pullner A, Duncan RC, Eick D, Levens D. Mol. Cell. Biol. 1996;16:2656–2669. doi: 10.1128/mcb.16.6.2656. [DOI] [PMC free article] [PubMed] [Google Scholar]
- 15.Rangan A, Fedoroff O Yu, Hurley LH. J. Biol. Chem. 2001;276:4640–4646. doi: 10.1074/jbc.M005962200. [DOI] [PubMed] [Google Scholar]
- 16.Simonsson T, Pribylova M, Vorlickova M. Biochem. Biophys. Res. Commun. 2000;278:158–166. doi: 10.1006/bbrc.2000.3783. [DOI] [PubMed] [Google Scholar]
- 17.Ahmed S, Kintanar A, Henderson E. Nat. Struct. Biol. 1994;1:83–88. doi: 10.1038/nsb0294-83. [DOI] [PubMed] [Google Scholar]
- 18.Williamson JR, Raghuraman MK, Cech TR. Cell. 1989;59:871–880. doi: 10.1016/0092-8674(89)90610-7. [DOI] [PubMed] [Google Scholar]
- 19.Huppert JL, Balasubramanian S. Nucleic Acids Res. 2007;35:406–413. doi: 10.1093/nar/gkl1057. [DOI] [PMC free article] [PubMed] [Google Scholar]
- 20.Siddiqui-Jain A, Grand CL, Bearss DJ, Hurley LH. Proc. Natl. Acad. Sci. U.S.A. 2002;99:11593–11598. doi: 10.1073/pnas.182256799. [DOI] [PMC free article] [PubMed] [Google Scholar]
- 21.Phan AT, Modi YS, Patel DJ. J. Am. Chem. Soc. 2004;126:8710–8716. doi: 10.1021/ja048805k. [DOI] [PMC free article] [PubMed] [Google Scholar]
- 22.Rankin S, Reszka AP, Huppert J, Zloh M, Parkinson GN, Todd AK, Ladame S, Balasubramanian S, Neidle S. J. Am. Chem. Soc. 2005;127:10584–10589. doi: 10.1021/ja050823u. [DOI] [PMC free article] [PubMed] [Google Scholar]
- 23.Ambrus A, Chen D, Dai J, Jones RA, Yang D. Biochemistry. 2005;44:2048–2058. doi: 10.1021/bi048242p. [DOI] [PubMed] [Google Scholar]
- 24.Sun D, Guo K, Rusche JJ, Hurley LH. Nucleic Acids Res. 2005;33:6070–6080. doi: 10.1093/nar/gki917. [DOI] [PMC free article] [PubMed] [Google Scholar]
- 25.Dexheimer TS, Sun D, Hurley LH. J. Am. Chem. Soc. 2006;128:5404–5415. doi: 10.1021/ja0563861. [DOI] [PMC free article] [PubMed] [Google Scholar]
- 26.Xu Y, Sugiyama H. Nucleic Acids Res. 2006;34:949–954. doi: 10.1093/nar/gkj485. [DOI] [PMC free article] [PubMed] [Google Scholar]
- 27.Hurley Laurence H, Siddiqui-Jain A. Gen. Eng. News. 2005;25:26. [Google Scholar]
- 28.Han H, Hurley LH, Salazar M. Nucleic Acids Res. 1999;27:537–542. doi: 10.1093/nar/27.2.537. [DOI] [PMC free article] [PubMed] [Google Scholar]
- 29.Rezler EM, Bashyam S, Kim M-Y, White E, Wilson WD, Hurley LH. J. Am. Chem. Soc. 2005;26:9439–9447. doi: 10.1021/ja0505088. [DOI] [PubMed] [Google Scholar]
- 30.Gray DM, Gray CW, Mou TC, Wen JD. Enantiomer. 2002;7:49–58. doi: 10.1080/10242430212192. [DOI] [PubMed] [Google Scholar]
- 31.Fernando H, Reszka AP, Huppert J, Ladame S, Rankin S, Venkitaraman AR, Neidle S, Balasubramanian S. Biochemistry. 2006;45:7854–7860. doi: 10.1021/bi0601510. [DOI] [PMC free article] [PubMed] [Google Scholar]
- 32.Wheelhouse RT, Sun D, Han H, Han FX, Hurley LH. J. Am. Chem. Soc. 1998;120:3261–3262. [Google Scholar]
- 33.Han FX, Wheelhouse RT, Hurley LH. J. Am. Chem. Soc. 1999;121:3561–3570. [Google Scholar]
- 34.Shin-ya K, Wierzba K, Matsuo K, Ohtani T, Yamada Y, Furihata K, Hayakawa Y, Seto H. J. Am. Chem. Soc. 2001;123:1262–1263. doi: 10.1021/ja005780q. [DOI] [PubMed] [Google Scholar]
- 35.Kim M-Y, Vankayalapati H, Shin-ya K, Wierzba K, Hurley LH. J. Am. Chem. Soc. 2002;124:2098–2099. doi: 10.1021/ja017308q. [DOI] [PubMed] [Google Scholar]
- 36.Gehring K, Leroy J-L, Guéron M. Nature. 1993;363:561–565. doi: 10.1038/363561a0. [DOI] [PubMed] [Google Scholar]
- 37.Kanehara H, Mizuguchi M, Tajima K, Kanaori K, Makino K. Biochemistry. 1997;36:1790–1797. doi: 10.1021/bi961528c. [DOI] [PubMed] [Google Scholar]
- 38.Ross SA, Burrows C. J. Nucleic Acids Res. 1996;24:5062–5063. doi: 10.1093/nar/24.24.5062. [DOI] [PMC free article] [PubMed] [Google Scholar]
- 39.Seenisamy J, Rezler EM, Powell TJ, Tye D, Gokhale V, Joshi CS, Siddiqui-Jain A, Hurley LH. J. Am. Chem. Soc. 2004;126:8702–8709. doi: 10.1021/ja040022b. [DOI] [PubMed] [Google Scholar]
- 40.Gallego J, Chou SH, Reid BR. J. Mol. Biol. 1997;273:840–856. doi: 10.1006/jmbi.1997.1361. [DOI] [PubMed] [Google Scholar]
- 41.Phan AT, Guéron M, Leroy J-L. J. Mol. Biol. 2000;299:123–144. doi: 10.1006/jmbi.2000.3613. [DOI] [PubMed] [Google Scholar]
- 42.Leroy J-L, Guéron M, Mergny J-L, Hélène C. Nucleic Acids Res. 1994;22:1600–1606. doi: 10.1093/nar/22.9.1600. [DOI] [PMC free article] [PubMed] [Google Scholar]
- 43.Han X, Leroy J-L, Guéron M. J. Mol. Biol. 1998;278:949–965. doi: 10.1006/jmbi.1998.1740. [DOI] [PubMed] [Google Scholar]
- 44.Grand CL, Han H, Muñoz RM, Weitman S, Von Hoff DD, Hurley LH, Bearss DJ. Mol. Cancer Ther. 2002;1:565–573. [PubMed] [Google Scholar]
- 45.Seenisamy J, Bashyam S, Gokhale V, Vankayalapati H, Sun D, Siddiqui-Jain A, Streiner N, Shin-ya K, White E, Wilson WD, Hurley LH. J. Am. Chem. Soc. 2005;127:2944–2959. doi: 10.1021/ja0444482. [DOI] [PubMed] [Google Scholar]
- 46.Insight II 2005L. Molecular Modeling Software, Accelrys Inc.,: 9685 Scranton Rd., San Diego, CA 92121: 9685 Scranton Rd. [Google Scholar]
- 47.Jorgensen WL, Chandrasekhar J, Madura JD, Impey RW, Klein ML. J. Chem. Phys. 1983;79:926–935. [Google Scholar]
- 48.Discover 3 Insight II, L. Molecular Modeling Software, Accelrys Inc., 9685 Scranton Rd., San Diego, CA 92121: [Google Scholar]


