Abstract
When a flash of light is presented in physical alignment with a moving object, the flash is perceived to lag behind the position of the object. This phenomenon, known as the flash-lag effect, has been of particular interest to vision scientists because of the challenge it presents to understanding how the visual system generates perceptions of objects in motion. Although various explanations have been offered, the significance of this effect remains a matter of debate. Here, we show that: (i) contrary to previous reports based on limited data, the flash-lag effect is an increasing nonlinear function of image speed; and (ii) this function is accurately predicted by the frequency of occurrence of image speeds generated by the perspective transformation of moving objects. These results support the conclusion that perceptions of the relative position of a moving object are determined by accumulated experience with image speeds, in this way allowing for visual behavior in response to real-world sources whose speeds and positions cannot be perceived directly.
Keywords: image speed, motion perception, percentile rank, perspective transformation, motion processing
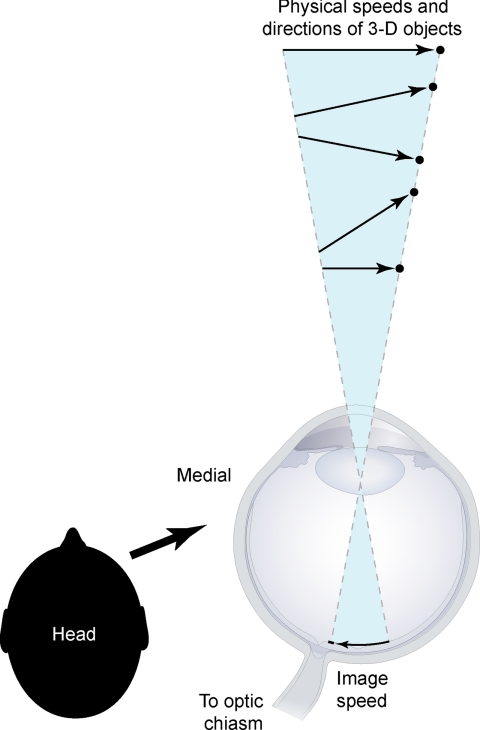
To produce biologically useful perceptions of motion, humans and other animals must contend with the fact that projected images cannot uniquely specify the real world speeds and positions of objects. This quandary—referred to as the inverse optics problem—is a consequence of the transformations that occur when objects in three-dimensional (3D) space project onto a two-dimensional (2D) surface, thus conflating the physical determinants of speed and position in the retinal image (Fig. 1). Recent investigations of brightness, color, and form have suggested that to contend with this problem in other perceptual domains the visual system has evolved to operate empirically, generating percepts that represent the world in terms of accumulated experience with images and their possible sources rather than by using stimulus features as such (1–4). Given this evidence, we suspected that the flash-lag effect might be a signature of this visual strategy as it pertains to the perception of motion. We therefore examined the hypothesis that the perception of lag is determined by the frequency of occurrence of image speeds generated by moving objects. As explained in Discussion, perceiving speed in this way would allow observers to produce generally successful visually guided responses toward objects whose actual speeds and positions cannot be derived in any direct way from their projected images. Thus, explaining the flash-lag effect is important for understanding vision and visual behavior.
Fig. 1.
The inverse optics problem as it pertains to the speed and position of moving objects. The schematic is a horizontal section through the right eye. As a result of perspective projection, an infinite number of objects (black dots) at different distances and moving in different trajectories with different speeds (arrows) can all generate the same 2D image speed. Thus, the information projected on the retina cannot specify the speeds and positions of real-world sources.
To test this hypothesis, the frequency of occurrence of image speeds in relation to their corresponding 3D sources must be known. Since the precise distances, trajectories, and speeds of objects in the world are not simultaneously measurable with any current technology, we created a computer-simulated environment in which the relationship between moving objects and their projections on an image plane could be evaluated. Although highly simplified, this surrogate for human visual experience with moving objects accurately represents the perspective transformation of speed and position when objects moving in 3D space project onto the 2D surface of the retina. In this way, we could tally the frequency of occurrence of image speeds and positions created by objects moving in a variety of directions over a range of different speeds. We then asked whether these data quantitatively predicted the perceptions of lag measured psychophysically, thereby testing the theory.
Results
Psychophysical Testing.
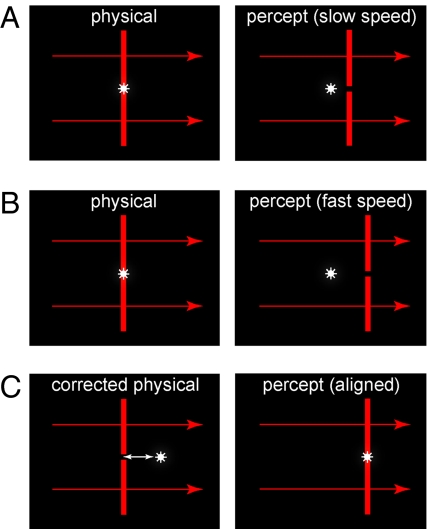
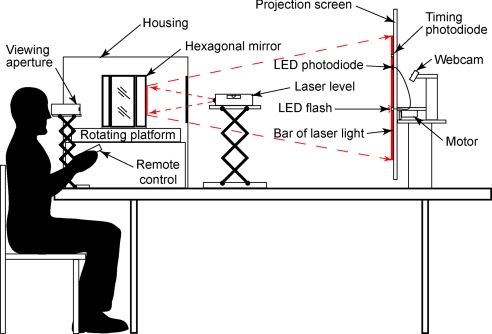
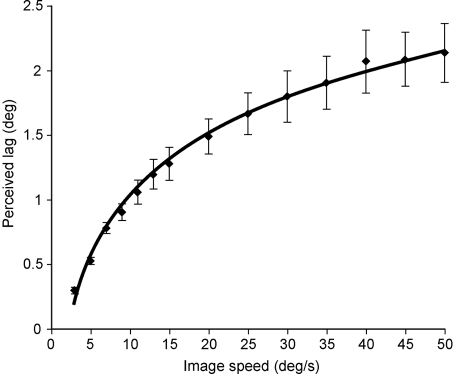
The principal phenomena to be explained in the flash-lag effect are: (i) why a stationary flash in physical alignment with the instantaneous position of a moving object is perceived to lag behind the object; and (ii) why the amount of perceived lag increases as the speed of the object increases [Fig. 2 and supporting information (SI) Text]. In addition to the various explanations offered for the flash-lag effect (see Discussion), several previous studies have indicated that the increase in perceived lag is approximately linear (5–10); however, this conclusion was based on stimuli presented only at relatively slow speeds (up to ≈15°/s). Thus, a first step in answering both of these issues was to obtain more complete psychophysical data. The paradigm illustrated in Fig. 3 allowed us to assess the perception of lag over the full range of speeds that elicit a measurable flash-lag effect (up to ≈50°/s; see Materials and Methods). In contrast to the conclusions of earlier studies, it is apparent that the flash-lag effect describes a nonlinear function, although with only information at low speeds it is easy to see how the function could be misinterpreted as linear (Fig. 4).
Fig. 2.
The flash-lag effect and its measurement. (A) When a bar of light (red vertical line) moves across a screen, a stationary flash (white asterisk) that is physically aligned with the moving bar (Left) is perceived to lag behind it (Right). (B) As the speed of the moving bar increases, the lag also increases. (C) By allowing observers to reposition the flash to achieve perceptual alignment (white arrow), the magnitude of the effect for different object speeds can be measured.
Fig. 3.
Setup used to acquire the psychophysical data. Observers viewed a projection screen through an aperture and repositioned an LED flash remotely until it was perceived as aligned with the center of the moving bar. A housing enclosed the platform and mirrors to ensure that the laser light was presented only on the projection screen. See Materials and Methods for detailed description.
Fig. 4.
Psychophysical function that describes the flash-lag effect for object speeds up to 50°/s. The curve is a logarithmic fit to the lag reported by 10 observers, all of whom had very similar perceptions of the amount of lag as a function of object speed. Bars are ±1 SEM.
Predicting the Psychophysical Function.
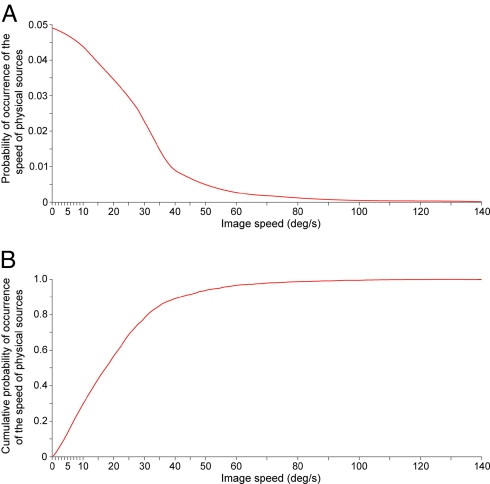
We next asked whether the psychophysical function in Fig. 4 is consistent with an empirical explanation of perceived lag. Accordingly, we determined the frequency of occurrence of projected speeds within the limits of image speeds that elicit motion percepts in humans (Fig. 5A). To predict the amount of perceived lag over the range of stimulus speeds used in psychophysical testing, we converted the probability distribution of projected image speeds into cumulative form (Fig. 5B). This cumulative probability distribution defines, to a first approximation, the summed probability that moving objects undergoing perspective transformation have projected particular image speeds. With respect to a given image speed, the cumulative probability distribution indicates the percentage of moving objects that generated projections slower than the image speed in question in past human experience, and the percentage that generated faster image speeds.
Fig. 5.
The distribution of image speeds generated by perspective transformation of the trajectories and speeds of moving objects. (A) The probability distribution of the speeds on the image plane generated by the projection of moving objects in the virtual environment (see Materials and Methods). (B) By ordering the data in A as a cumulative probability distribution, we could approximate the empirical link between image speeds and object speeds.
If the flash-lag effect indeed arises from an empirical strategy of motion processing, then the psychophysical function in Fig. 4 should be accurately predicted by the cumulative probability function in Fig. 5B. For an ordinal percept such as speed, these predictions correspond to the percentile rank (probability × 100%) of each image speed in Fig. 5B, a higher rank indicating a greater subjective sense of speed. Since a flash has an image speed of 0°/s (and therefore a percentile rank of zero), a stationary object, such as a flashed spot of light, has a lower percentile rank relative to the rank of any moving object; this empirical fact would explain why a flash is always seen to lag behind a moving object. Moreover, as the speed of the stimulus increases, the amount of lag relative to the flash should also increase, but do so in a nonlinear manner that accords with the cumulative function of Fig. 5B.
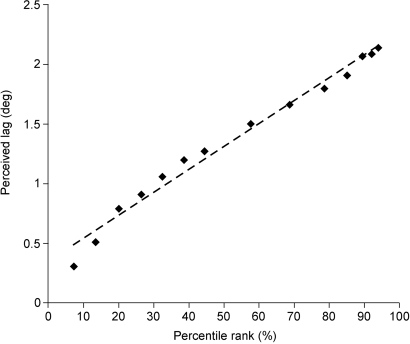
As shown in Fig. 6, this empirical framework accurately predicts the psychophysical results. A direct correlation of the amount of perceived lag in Fig. 4 with the percentile ranks of different image speeds in Fig. 5B accounts for more than 97% of the observed data.
Fig. 6.
Predicting the flash-lag effect. Plotting the perceived lag reported by observers in Fig. 4 against the percentile rank of speeds in Fig. 5B shows the correlation between the psychophysical and empirical data. The deviation from a linear fit (dashed line) indicates that ≈97% of the observed data are accounted for on this basis (R2 = 0.9721).
The Effect of Different 3D Speed Distributions.
An inevitable concern about this empirical prediction is the choice of 3D speeds used to approximate the frequency of occurrence of retinal image speeds generated by moving objects (Fig. 5). It is obvious that a variety of real-world factors influence the distribution of object speeds, and that these are not included in the simulation (e.g., the kinds of objects that typically move in a terrestrial environment, the influence of gravity, the effect of friction, and so on). Consequently, our choice of a uniform distribution of 3D object speeds for analysis is both arbitrary and not fully reflective of the object speeds that elicit motion perception in humans.
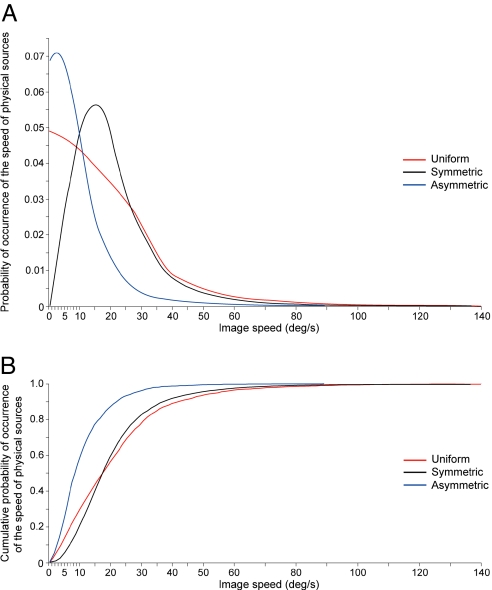
We therefore tested other 3D speed distributions to ask how a different choice would have affected an empirical prediction of the flash-lag effect. To cover a range of real-world possibilities for which no empirical information is available, we analyzed image speeds generated by object speeds assigned from both symmetric normal and asymmetric normal distributions (Fig. 7). Although the predictions derived from each 3D speed distribution are somewhat different, the resulting cumulative functions predict the amount of perceived lag about as well as the assumption of a uniform distribution of object speeds (R2 = 0.9665 for the symmetric normal distribution and 0.9402 for the asymmetric normal distribution, compared with 0.9721 for the uniform distribution). The reason for these similar predictions of perceived lag arising from different distributions of object speeds is that the actual 3D speeds of objects are much less important in the determination of image speeds (and thus in empirically determined, visually guided behavior) than the influence of perspective transformation, which the simulation captures precisely. Since perspective transformation generates image speeds that are always less than or equal to the speeds of 3D objects, the effect of different distributions of object speeds on image speeds is largely nullified. Thus, the bias toward slow stimulus speeds arising from perspective, which is equally apparent in analyses of image speeds in films (11) or simply from a priori calculations (12, 13), is the primary cause of the distributions of image speeds experienced by humans (note, however, that an empirical explanation depends on the relation of image speeds to physical speeds, and not on image speeds per se; see Discussion). As a result, the choice of a particular distribution of 3D speeds in the simulation is not critical.
Fig. 7.
The frequency of occurrence of image speeds generated by different 3D speed distributions. (A) The probability distributions of image speeds derived from objects with symmetric normal (black curve; mode = ≈75 units/s) and asymmetric normal (blue curve; mode = ≈35 units/s) speed distributions. The red curve is the uniform distribution in Fig. 5A, shown here for comparison. (B) The cumulative probability distributions are derived from the probability distributions in A.
Discussion
The correspondence of observed and predicted results in Fig. 6 supports the hypothesis that accumulated experience with image speeds is indeed the basis for the flash-lag effect. What, then, are the implications of this empirical strategy for existing explanations of motion perception and their neural bases, and how does an empirical strategy facilitate visually guided behavior by contending with the inverse problem?
Current Explanations of Motion Perception.
The prevailing physiological models are based on hierarchical processing of retinal stimuli in which the lower-order receptive field properties of motion-sensitive neurons in V1 progressively construct more complex responses in higher-order cortical regions, such as areas MT and MST in the nonhuman primate brain and MT+ in humans, the culmination of this process being the motion perceived (14–20). Although this approach has been amended by the suggestion of two-stage (21) or three-stage (22) processing schemes, as well as by the addition of “component cells,” “pattern cells,” and cascade models that could explain further details of motion perception (23, 24), this framework remains the most widely accepted conception of how motion percepts are generated. Not all observations fit this general concept of visual cortical processing, however, and there are clearly other ways of thinking about visual organization and function (25–28).
In addition to physiological models of visual motion, several computational models also have been proposed. Of these, algorithmic strategies for feature detection (12, 13, 29–31) and models sensitive to the spatiotemporal energy in image sequences (27, 32–35) have received the most attention. The inclusion of assumptions about the 3D world—e.g., “reflective constraints” (12) or reliance on oriented filters to extract spatiotemporal energy (33, 34)—have been used to increase the explanatory power of these approaches.
Explanations of the Flash-Lag Effect.
Although both physiological and computational approaches can account for some important aspects of motion perception, neither approach explains the discrepancy in perceived position that defines the flash-lag effect. Given the importance of understanding how the perception of speed and position are generated by the visual system, several explanations specific to these aspects of motion perception have been offered. These are: (i) that the visual system compensates for neuronal latencies by extrapolating the expected position of a moving object from information in the stimulus (5, 6, 36, 37); (ii) that the effect occurs because stimulus processing entails shorter latencies for moving stimuli than for static flashes (7, 38–41); (iii) that the flash-lag effect is a consequence of “anticipation” in early retinal processing (42); and (iv) that the visual system relies on “postdiction” or positional biasing by shifting position computations in the direction of motion signals that occur after the flash (43–46).
In light of the data shown in Fig. 4, those models that predict a linear psychophysical function (5–10) cannot explain the flash-lag effect, which is nonlinear (see also SI Text). Although a biologically inspired nonlinear component (e.g., a saturation mechanism) could be introduced into any of these models to better predict our observed results, insofar as a proposed explanation of the flash-lag effect continues to be based on stimulus properties, it is likely to prove unsatisfactory. Similarly, those models that construe the effect in terms of separate mechanisms for speed and position (46) seem to rely on a feature detection concept of vision to explain the perception of lag. As shown in Fig. 1, however, image speed and position cannot be directly related to the speed and position of objects in 3D space; therefore, these aspects of the stimulus as such could not successfully guide visual behavior.
Understanding the Flash-Lag Effect in Empirical Terms.
The underlying reason for exploring an empirical explanation of the flash-lag effect is the quandary posed by the fact that the information contained in the retinal image cannot specify the speed and position of an object in space. In consequence, generating the perception of speed and position on the basis of accumulated experience seems the only recourse for the evolution of successful visually guided behavior. In this framework, the relative success or failure of the behaviors made in response to retinal images will tend, over time, to influence the reproductive fitness of the observer and increase the prevalence of the visual circuitry that mediated more successful behavior in the evolving population. Given this conception, the perception of speed and position generated by moving objects, and therefore the flash-lag effect, is the result of innumerable ancestral responses that empirically linked images with objects by way of behavior. The simulated environment we used successfully predicts the flash-lag effect because it is a proxy for this linkage, providing the empirical relationships between images and moving objects that the relative success of behaviors would have extracted over evolutionary time.
As a result of this visual strategy, however, perceived speed and position does not (and logically cannot) correspond with either the actual speed and position of objects in the world or the information about speed and position projected on the retina. In consequence, processing retinal information in this way inevitably gives rise to discrepancies between appearance and reality, the flash-lag effect being one of the more obvious examples in the case of motion.
How Perceptions of Motion Generated on This Basis Facilitate Successful Behavior.
A further question is how the perception of speed and position according to the relative rank of projected images in past experience facilitates successful behavior. On the face of it, the nonlinear perception of speed and position documented in Fig. 4 seems both counterintuitive and maladaptive. Why would it make any sense to see speeds and positions that are not veridical?
As illustrated in Fig. 1, information about motion on the retina could have arisen from an infinite number of object speeds and positions; thus, responding to objects in the world on the basis of images alone would not generate successful behavior. Using information about the regularities in the world (e.g., the constraints on motion due to gravity or the terrestrial surface) would also be of relatively little help, since different distributions of real-world speeds generate surprisingly similar distributions of image speeds when transformed by perspective (Fig. 7). For the same reasons, since a posterior distribution can arise from very different priors, a computation of the most likely speed and position of the source of the projected stimulus (i.e., a Bayesian model) would also be unavailing (47). In contrast, the shaping of visual circuitry by trial and error experience over evolutionary time will gradually link inevitably ambiguous image sequences with successful visually guided behavior, despite the inverse optics problem illustrated in Fig. 1.
Conclusion
The flash-lag effect demonstrates a clear discrepancy between the actual and perceived position of a moving object relative to a stationary marker, such as a flash. In an empirical explanation of this effect, the perception of lag should occur whenever a more rapidly moving object is compared to a slower-moving one, since the perception of motion is the perception of an object's speed and position relative to some reference point. Indeed, there is some evidence to support this implication. For example, it has been demonstrated that the perception of lag can be elicited from conditions when moving objects are compared with sequences of flashes in different spatial locations (8, 38, 48, 49). Instead of conceiving the flash-lag effect as a mismatch between systems dedicated to the perception of speed and the perception of position, or as the result of a temporal integration of stimuli, the framework offered here implies that the perception of lag is the result of taking into account accumulated empirical information about the speed and position of projected images to facilitate successful behavior. In this conception, the flash-lag effect is a signature of the general way neural circuitry has evolved to contend with the inverse problem as it pertains to motion.
Materials and Methods
Psychophysical Testing.
Ten adults (four female; ages 18–69 years) with normal or corrected-to-normal vision participated in the psychophysical component of the study (the authors and six participants naïve to the purposes of the experiment). Informed consent was obtained as required by the Duke University Health System. To acquire data over the range of speeds at which the flash-lag effect is readily measurable, an industry-grade laser level (Acculine Pro 40–6164; Johnson Inc.) was used to project a 0.2 × 60 cm vertical bar of continuous light (650 ± 10 nm) (Fig. 3). The laser light was reflected from six vertical mirrors fixed to a hexagonal base mounted on a rotating platform capable of speeds from 1–500 rpm. As the platform rotated, the hexagonal mirrors turned around a central axis, causing the bar of laser light to repeatedly traverse a tangent screen at any desired speed. Participants viewed the projection screen monocularly in a darkened room from a distance of ≈114 cm through an aperture that restricted the scene to a 15° horizontal by 5° vertical field of view; thus, the vertical bar of laser light was visible over 15° of visual arc as it traversed the screen. The speeds tested ranged from 3°/s to 50°/s presented in random order; at greater speeds the bar was increasingly perceived as blur, making accurate determination of the perceived lag less reliable. For speeds up to 15°/s, increments of 2°/s were assessed; for speeds from 15°/s to 50°/s, the increments were 5°/s.
As the laser light moved across the screen it activated a series of three photodiodes: two timing photodiodes (30 series; Perkin–Elmer Optoelectronics) affixed to the screen 40 cm apart, and a red-enhanced photodiode (PDB-C615–2; Advanced Photonix Inc.) mounted between the two timing photodiodes (Fig. 3). A digital clock was activated when the laser light triggered the first timing photodiode, and deactivated when it triggered the second, thereby providing precise information about the speed of the moving bar of light. The red-enhanced photodiode (response time: 150 ns at 660 nm) triggered a single synchronous light emitting diode (LED) flash. The LED (RL5-W18030; Super Bright LEDs Inc.) was presented through a 0.5 × 40 cm horizontal gap in the tangent screen; a motorized track hidden behind the projection screen allowed observers using a remote control to reposition the LED horizontally with an accuracy of ≈1 mm along the 40-cm distance. The LED flash was reset to a random location along the track at the beginning of each trial. During testing, observers were able to see only the translating laser light and LED flash (i.e., the timing and red-enhanced photodiodes were outside the field of view).
With each passage of the laser light across the screen, observers repositioned the LED flash using the remote control until it appeared to be aligned with the moving bar (Fig. 2). Subjects were allowed as many presentations as they needed to achieve what they judged to be exact alignment. The 5-mm horizontal gap in the projection screen served as a “crosshair” that assured the moving vertical bar was indeed coincident with the flash. When perceptual alignment was indicated, a picture of the position of the LED flash relative to a fixed millimeter ruler was taken from behind the screen using a digital web camera (PD1170; Creative Labs Inc.), thus recording how far the LED flash had been moved by the observer (the setup required that all judgments of alignment be made in central vision). The picture files were evaluated at the end of testing, and the magnitude of the flash-lag effect was recorded. Participants made judgments of alignment on three separate trials for each speed tested, and the average of these was used to derive the psychophysical function for each observer. The similarity of responses across observers allowed the data to be merged.
The Virtual Environment.
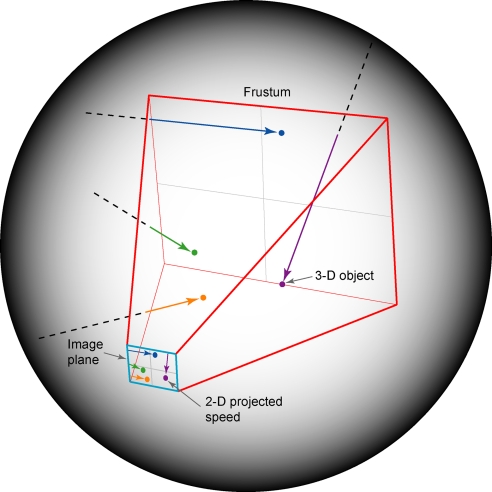
To ascertain whether the flash-lag effect can be explained by the frequency of occurrence of image speeds generated by moving objects, data derived from objects moving in 3D space are required; however, there is at present no technology that can directly link the distances, trajectories, and speeds of 3D objects with the corresponding 2D speeds projected onto the retina. We therefore determined these relationships in a computer-simulated environment (Fig. 8). A frustum, the standard technique for creating perspective projections in 3D computer graphics (50, 51), was located at the center of a spherical environment to approximate the retinal image formation process from objects moving in a monocular visual field. Following Open GL conventions, the frustum occupied the negative z axis, with the nodal point of the eye located at the origin of the x, y, and z axes. Space in the environment was defined in uniform arbitrary units. The image plane measured 50 units in both azimuth and elevation, and was positioned at a distance from the apex of the frustum such that a square degree of visual angle corresponded to 1 square unit on the projection surface; thus, the simulated visual field was 50° × 50°. As shown in Fig. 8, objects traveling in different trajectories at different depths and at different speeds projected sequences on the image plane whose speeds were not directly related to the speeds and positions of their 3D sources (see also Fig. 1).
Fig. 8.
Image speeds generated by the perspective transformation of moving objects in a simulated environment. A frustum (red outline) was embedded in a larger spherical space. Point objects (colored dots) moving in randomly assigned directions at randomly assigned speeds entered the frustum volume from the surrounding space and projected onto an image plane (blue outline). The frequency of occurrence of image speeds arising from these objects was determined, thus approximating the empirical link between image speeds and object movements.
Since the psychophysical testing described in the previous section relied on the ability of observers to indicate when the central point of the bar of laser light appeared to be in alignment with the LED flash, we used point objects in the virtual environment to acquire the probability distributions of projected speeds. Objects were set in motion outside the frustum within the uniform space of the overall environment (Fig. 8), each with a direction and speed assigned randomly from uniform distributions (the actual direction and speed distributions in the world are not known; see Results and Discussion for further elaboration on this issue). When an object reached the boundary of the virtual environment, a new object was randomly regenerated to take its place. Approximately 2.4 million objects were generated in this way, ≈624,000 of which entered into the frustum volume and projected onto the image plane.
Determining the Frequency of Occurrence of Image Speeds.
The probability distributions of image speeds were determined by systematically analyzing the entire image plane for projections that traversed at least 15° of projected distance, the visual arc that corresponded to the psychophysical testing. For the sake of computational efficiency in dealing with the large amount of data generated, projected speeds were analyzed at 30° increments over 360° at a resolution of 0.1 units (≈6 min of arc). Because linearly constant motion in 3D space does not produce linearly constant 2D projections, average image speed was calculated. The projected speeds of objects falling within the range of 0.1°/s to 150°/s were compiled (this range corresponds to the approximate limits of human motion perception) (52). This procedure yielded a probability distribution of ≈346,000 valid samples, which were normalized and replotted as a cumulative probability distribution. As described in Results, quantitative predictions of the flash-lag effect over the full range of speeds that elicit this phenomenon were derived from the cumulative data and compared with the perceived lag reported by observers.
Supplementary Material
Acknowledgments.
We thank Greg Appelbaum, David Eagleman, Christof Koch, Steve Mitroff, Rufin van Rullen, Jim Voyvodic, Len White, Marty Woldorff, and Zhiyong Yang for helpful discussions and comments on the manuscript.
Footnotes
The authors declare no conflict of interest.
This article contains supporting information online at www.pnas.org/cgi/content/full/0808916105/DCSupplemental.
References
- 1.Purves D, Lotto RB. Why We See What We Do: An Empirical Theory of Vision. Sunderland, MA: Sinauer; 2003. [Google Scholar]
- 2.Yang Z, Purves D. The statistical structure of natural light patterns determines perceived light intensity. Proc Natl Acad Sci USA. 2004;101:8745–8750. doi: 10.1073/pnas.0402192101. [DOI] [PMC free article] [PubMed] [Google Scholar]
- 3.Howe CQ, Purves D. Perceiving Geometry: Geometrical Illusions Explained by Natural Scene Statistics. New York: Springer; 2005. [Google Scholar]
- 4.Long F, Yang Z, Purves D. Spectral statistics in natural scenes predict hue, saturation, and brightness. Proc Natl Acad Sci USA. 2006;103:6013–6018. doi: 10.1073/pnas.0600890103. [DOI] [PMC free article] [PubMed] [Google Scholar]
- 5.Nijhawan R. Motion extrapolation in catching. Nature. 1994;370:256–257. doi: 10.1038/370256b0. [DOI] [PubMed] [Google Scholar]
- 6.Khurana B, Nijhawan R. Extrapolation or attention shift? Reply. Nature. 1995;378:555–556. doi: 10.1038/378565a0. [DOI] [PubMed] [Google Scholar]
- 7.Whitney D, Murakami I, Cavanagh P. Illusory spatial offset of a flash relative to a moving stimulus is caused by differential latencies for moving and flashed stimuli. Vision Res. 2000;40:137–149. doi: 10.1016/s0042-6989(99)00166-2. [DOI] [PubMed] [Google Scholar]
- 8.Krekelberg B, Lappe M. Temporal recruitment along the trajectory of moving objects and the perception of position. Vision Res. 1999;39:2669–2679. doi: 10.1016/s0042-6989(98)00287-9. [DOI] [PubMed] [Google Scholar]
- 9.Krekelberg B, Lappe M. Neuronal latencies and the position of moving objects. Trends Neurosci. 2001;24:335–339. doi: 10.1016/s0166-2236(00)01795-1. [DOI] [PubMed] [Google Scholar]
- 10.Murakami I. The flash-lag effect as a spatiotemporal correlation structure. J Vision. 2001;1:126–136. doi: 10.1167/1.2.6. [DOI] [PubMed] [Google Scholar]
- 11.Dong DW, Atick JJ. Statistics of natural time-varying images. Netw Comp Neural Sys. 1995;6:345–358. [Google Scholar]
- 12.Ullman S. The Interpretation of Visual Motion. Cambridge, MA: MIT Press; 1979. [Google Scholar]
- 13.Yuille A, Ullman S. Rigidity and smoothness of motion: Justifying the smoothness assumption in motion measurement. Image Understand Adv Comput Vis. 1990;3:163–184. [Google Scholar]
- 14.Hubel DH, Wiesel TN. Receptive fields, binocular interaction and functional architecture in the cat's visual cortex. J Physiol. 1962;160:106–154. doi: 10.1113/jphysiol.1962.sp006837. [DOI] [PMC free article] [PubMed] [Google Scholar]
- 15.Hubel DH, Wiesel TN. Sequence regularity and geometry of orientation columns in the monkey striate cortex. J Comput Neurol. 1974;158:267–294. doi: 10.1002/cne.901580304. [DOI] [PubMed] [Google Scholar]
- 16.Hubel DH, Wiesel TN. Ferrier lecture: Functional architecture of macaque monkey visual cortex. Philos Trans R Soc London B Biol Sci. 1977;198:1–59. doi: 10.1098/rspb.1977.0085. [DOI] [PubMed] [Google Scholar]
- 17.De Valois RL, Yund EW, Hepler N. The orientation and direction selectivity of cells in macaque visual cortex. Vision Res. 1982;22:531–544. doi: 10.1016/0042-6989(82)90112-2. [DOI] [PubMed] [Google Scholar]
- 18.De Valois RL, Albrecht DG, Thorell LG. Spatial frequency selectivity of cells in macaque visual cortex. Vision Res. 1982;22:545–559. doi: 10.1016/0042-6989(82)90113-4. [DOI] [PubMed] [Google Scholar]
- 19.Livingstone MS, Hubel DH. Psychophysical evidence for separate channels for the perception of form, color, movement, and depth. J Neurosci. 1987;7:3416–3468. doi: 10.1523/JNEUROSCI.07-11-03416.1987. [DOI] [PMC free article] [PubMed] [Google Scholar]
- 20.Livingstone MS, Hubel DH. Segregation of form, color, movement, and depth: Anatomy, physiology, and perception. Science. 1988;240:740–749. doi: 10.1126/science.3283936. [DOI] [PubMed] [Google Scholar]
- 21.Braddick O. A short-range process in apparent motion. Vision Res. 1974;14:519–528. doi: 10.1016/0042-6989(74)90041-8. [DOI] [PubMed] [Google Scholar]
- 22.Lu ZL, Sperling G. The functional architecture of human visual motion perception. Vision Res. 1995;35:2697–2722. doi: 10.1016/0042-6989(95)00025-u. [DOI] [PubMed] [Google Scholar]
- 23.Movshon JA, Adelson EH, Gizzi MS, Newsome WT. In: Pattern Recognition Mechanisms. Chagas C, Gattass R, Gross C, editors. New York: Springer; 1985. [Google Scholar]
- 24.Rust NC, Mante V, Simoncelli EP, Movshon JA. How MT cells analyze the motion of visual patterns. Nat Neurosci. 2006;9:1421–1431. doi: 10.1038/nn1786. [DOI] [PubMed] [Google Scholar]
- 25.Schiller PH. In: Extrastriate Visual Cortex in Primates. Rockland KS, Kass JH, editors. Vol 2. New York: Plenum; 1997. [Google Scholar]
- 26.Lennie P. Single units and visual cortical organization. Perception. 1998;27:889–935. doi: 10.1068/p270889. [DOI] [PubMed] [Google Scholar]
- 27.Basole A, White LE, Fitzpatrick D. Mapping multiple features in the population response of visual cortex. Nature. 2003;423:986–990. doi: 10.1038/nature01721. [DOI] [PubMed] [Google Scholar]
- 28.Conway BR, Tsao DY. Color architecture in the alert macaque revealed by fMRI. Cereb Cortex. 2006;16:1604–1613. doi: 10.1093/cercor/bhj099. [DOI] [PMC free article] [PubMed] [Google Scholar]
- 29.Marr D, Ullman S. Directional selectivity and its use in early processing. Proc R Soc London B Biol Sci. 1981;211:151–180. doi: 10.1098/rspb.1981.0001. [DOI] [PubMed] [Google Scholar]
- 30.Marr D. Vision: A Computational Investigation into the Human Representation and Processing of Visual Information. San Francisco: Freeman; 1982. [Google Scholar]
- 31.Hildreth EC. The Measurement of Visual Motion. Cambridge, MA: MIT Press; 1984. [Google Scholar]
- 32.Van Santen JP, Sperling G. Temporal covariance model of human motion perception. J Opt Soc Am A. 1984;1:451–473. doi: 10.1364/josaa.1.000451. [DOI] [PubMed] [Google Scholar]
- 33.Adelson EH, Bergen JK. Spatiotemporal energy models for the perception of motion. J Opt Soc Am. 1985;2:284–299. doi: 10.1364/josaa.2.000284. [DOI] [PubMed] [Google Scholar]
- 34.Watson AB, Ahumada AJ. Model of human visual-motion sensing. J Opt Soc Am. 1985;2:322–341. doi: 10.1364/josaa.2.000322. [DOI] [PubMed] [Google Scholar]
- 35.Fitzpatrick D. Seeing beyond the receptive field in primary visual cortex. Curr Opin Neurobiol. 2000;10:438–442. doi: 10.1016/s0959-4388(00)00113-6. [DOI] [PubMed] [Google Scholar]
- 36.Nijhawan R. Visual decomposition of colour through motion extrapolation. Nature. 1997;386:66–69. doi: 10.1038/386066a0. [DOI] [PubMed] [Google Scholar]
- 37.Khurana B, Watanabe K, Nijhawan R. The role of attention in motion extrapolation: Are moving objects “corrected” or flashed objects attentionally delayed? Perception. 2000;29:675–692. doi: 10.1068/p3066. [DOI] [PubMed] [Google Scholar]
- 38.Lappe M, Krekelberg B. The position of moving objects. Perception. 1998;27:1437–1449. doi: 10.1068/p271437. [DOI] [PubMed] [Google Scholar]
- 39.Purushothaman G, Patel SS, Bedell HE, Ogmen H. Moving ahead through differential visual latency. Nature. 1998;396:424. doi: 10.1038/24766. [DOI] [PubMed] [Google Scholar]
- 40.Whitney D, Murakami I. Latency difference, not spatial extrapolation. Nat Neurosci. 1998;1:656–657. doi: 10.1038/3659. [DOI] [PubMed] [Google Scholar]
- 41.Whitney D, Cavanagh P, Murakami I. Temporal facilitation for moving stimuli is independent of changes in direction. Vision Res. 2000b;40:3829–3839. doi: 10.1016/s0042-6989(00)00225-x. [DOI] [PubMed] [Google Scholar]
- 42.Berry MJ, Brivanlou IH, Jordan TA, Meister M. Anticipation of moving stimuli by the retina. Nature. 1999;398:334–338. doi: 10.1038/18678. [DOI] [PubMed] [Google Scholar]
- 43.Eagleman DM, Sejnowski TJ. Motion integration and postdiction in visual awareness. Science. 2000;287:2036–2038. doi: 10.1126/science.287.5460.2036. [DOI] [PubMed] [Google Scholar]
- 44.Eagleman DM, Sejnowski TJ. The position of moving objects. Response. Science. 2000;289:1107a. doi: 10.1126/science.289.5482.1107a. [DOI] [PubMed] [Google Scholar]
- 45.Eagleman DM, Sejnowski TJ. Untangling spatial from temporal illusions. Trends Neurosci. 2002;25:293. doi: 10.1016/s0166-2236(02)02179-3. [DOI] [PubMed] [Google Scholar]
- 46.Eagleman DM, Sejnowski TJ. Motion signals bias localization judgments: A unified explanation for the flash-lag, flash-drag, flash-jump, and Fröhlich illusions. J Vision. 2007;7:1–12. doi: 10.1167/7.4.3. [DOI] [PMC free article] [PubMed] [Google Scholar]
- 47.Howe CQ, Lotto RB, Purves D. Comparison of Bayesian and empirical ranking approaches to visual perception. J Theor Biol. 2006;241:866–875. doi: 10.1016/j.jtbi.2006.01.017. [DOI] [PubMed] [Google Scholar]
- 48.Mackay DM. Perceptual stability of a stroboscopically lit visual field containing self-luminous objects. Nature. 1958;181:507–508. doi: 10.1038/181507a0. [DOI] [PubMed] [Google Scholar]
- 49.Cantor CRL, Schor CM. Stimulus dependence of the flash-lag effect. Vision Res. 2007;47:2841–2854. doi: 10.1016/j.visres.2007.06.023. [DOI] [PMC free article] [PubMed] [Google Scholar]
- 50.O'Rourke J. Computational Geometry in C. 2nd ed. Cambridge, UK: Cambridge Univ Press; 1994. [Google Scholar]
- 51.Dunn F, Parberry I. 3-D Math Primer for Graphics and Game Development. Plano, TX: Wordware; 2002. [Google Scholar]
- 52.Burr D, Ross J. Visual processing of motion. Trends Neurosci. 1986;9:304–307. [Google Scholar]
Associated Data
This section collects any data citations, data availability statements, or supplementary materials included in this article.


