Abstract
Annotated DNA samples that had been previously analyzed were tested using multiplex ligation-dependent probe amplification (MLPA) assays containing probes targeting BRCA1, BRCA2, and MMR (MLH1/MSH2 genes) and the 9p21 chromosomal region. MLPA polymerase chain reaction products were separated on a capillary electrophoresis platform, and the data were analyzed using GeneMapper v4.0 software (Applied Biosystems, Foster City, CA). After signal normalization, loci regions that had undergone deletions or duplications were identified using the GeneMapper Report Manager and verified using the DyeScale functionality. The results highlight an easy-to-use, optimal sample preparation and analysis workflow that can be used for both small- and large-scale studies.
Keywords: gene copy number, fluorescent in situ hybridization, CNV, MLPA, PCR
INTRODUCTION
Deletions and duplications in genomic DNA have been implicated as pathogenic mutations in many diseases, and are usually not detected by sequence analysis of polymerase chain reaction (PCR)-amplified gene fragments because a normal copy is still present. These types of mutations are thought to represent 5.5% of reported mutations.1 However, given that mutation scans have not included searches for deletions and duplications, it seems likely that these figures are an underestimate of the actual number.1 Traditionally, detection of these types of mutations is done using Southern blot hybridization or fluorescent in situ hybridization techniques, which can be laborious, time-consuming, and require high quantities of starting material. Multiplex ligation-dependent probe amplification (MLPA) is a method that allows relative copy number estimation of up to 45 nucleic acid sequences in one single reaction.2,3 This study presents how MLPA assays can be analyzed simply, yet effectively.
MATERIALS AND METHODS
MLPA assay
MLPA is a multiplex PCR technique in which up to 45 specific sequences are simultaneously quantified in a single reaction. As only one pair of PCR primers is used, MLPA reactions result in a very reproducible peak pattern with fragments ranging from 130 to 490 bp. Comparison of the sample peak pattern to that obtained with a control sample indicates which sequences show an aberrant copy number. The MLPA assay was completed according to the manufacturer’s protocol (MRC-Holland, Amsterdam, The Netherlands).3
Sample preparation and data collection with capillary electrophoresis (CE)
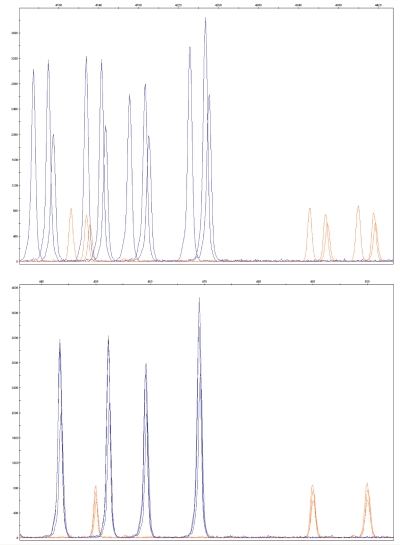
For each sample, the following components were combined: 1–3 μL of the PCR reaction + 0.3 μL of GeneScan 600 LIZ size standard + 9 μL HiDi formamide. The samples were denatured for 2 min at 94°C, and then cooled to 4°C for 5 min. The plate was run on an Applied Biosystems 3730 DNA Analyzer (Applied Biosystems, Foster City, CA) and the fluorescent data were collected during fragment separation. The internal size standard was used in all capillaries to align data from different capillaries, and to eliminate capillary-to-capillary or run-to-run variability (Figure 1).
FIGURE 1.
Data comparison before (top) and after (bottom) size standard correction.
Data analysis with GeneMapper Software v4.0
MLPA data analysis consists of fragment sizing using the internal GeneScan 600 LIZ size standard, automated peak calling and assignment of the MLPA probe name, and signal normalization to allow semiquantitative analysis. The GeneMapper Software v4.0 (Applied Biosystems, Foster City, CA) was used to perform pattern comparison of peak height between samples. Each amplification yields a pattern composed of fluorescent 6-FAM-labeled peaks, with each peak corresponding to a specific exon/genomic DNA locus. Comparison of fluorescence was performed between the same peaks generated from different samples (for example, a control sample with no known copy number variation in the targeted region, and an unknown sample).
MLPA probe name assignment
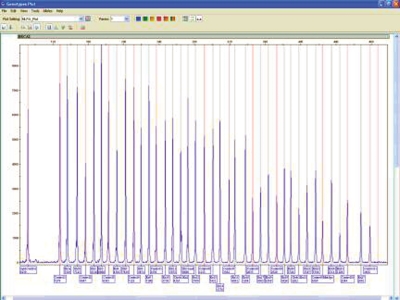
Data were sized with GeneScan 600 LIZ size standard, and the resulting sized peaks were automatically labeled with the probe names provided by the GeneMapper Panel Manager (Figure 2).
FIGURE 2.
Plot view with MLPA probe names automatically labeled.
MLPA global normalization
Analysis of a limited number of samples can easily be done by visual examination of the capillary electrophoresis peak profiles. For the analysis of large numbers of samples, a reliable normalization method is necessary. Normalization of MLPA data is essential because variations in experimental conditions may lead to quantitative differences of measured values between samples. After normalization, the measured data should reveal the biological differences in copy numbers—not possible differences in the experimental process. Normalization thus tries to minimize the amount of systematic variation in the data. By minimizing the amount of nonbiological variation, it is possible to focus on real biological changes during data analysis. To compare measurements from MLPA experiments, the samples are normalized using a global normalization method based on the sum of all peak heights of all the samples within a run.
Global normalization is one of the simplest ways to normalize data. However, this method should be used only when a small number of probe deletions/duplications are expected, because it could affect the sample normalization.
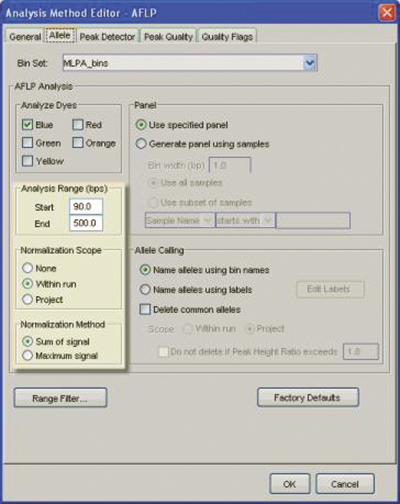
The GeneMapper amplified fragment length polymorphism (AFLP) analysis method was used as a template to perform signal normalization, where the software used the sum of all peak heights as the normalization base. Settings using the sum of signal in the range of 90 to 500 bp for all samples within the same run provided an accurate normalization (Figure 3).
FIGURE 3.
GeneMapper AFLP analysis method used as a template for MLPA data analysis.
Control/unknown sample ratio calculation
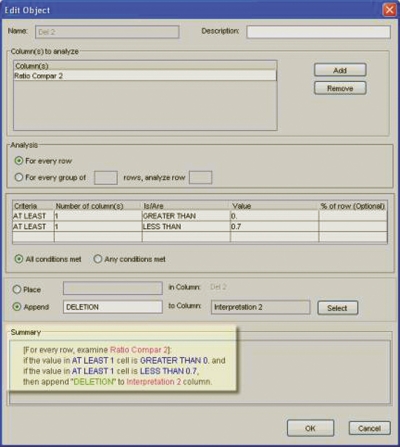
Once the automated normalization step was completed, pattern comparison was performed. This was done by calculating the unknown sample normalized peak height and control sample normalized peak height ratio for a given probe. The recommended thresholds were used to define copy number variation, i.e., deletion < 0.7, normal 1.3 > duplication. These values were set in the Report Manager in order to generate a copy number variation result report (Figure 4).
FIGURE 4.
Example of threshold setting for “deletion” calls in GeneMapper Report Manager.
RESULTS AND DISCUSSION
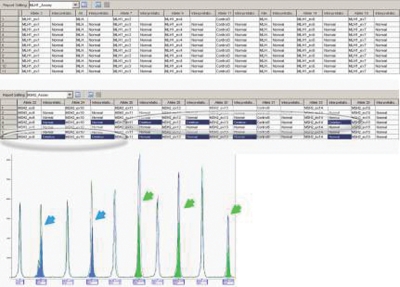
The above GeneMapper analysis settings were tested against 50 DNA samples using MLPA assays targeting BRCA1, BRCA2, MMR genes (MLH1/MSH2), and the 9p21 chromosomal region. Accurate results were observed using GeneMapper software v4.0 for large deletions, as well as large duplications (Table 1). The Report Manager allowed flexibility in viewing the results in assays where more than one gene was targeted. For example, although the MMR assay amplified the two genes MLH1 and MSH2 in the same reaction, the GeneMapper Report Manager allowed the user to view the results in separate reports (Figure 5).
Table 1.
| Panel | Sample Name | Result |
|---|---|---|
| 9p21_SalsaP024 | Sample 4 | CDKN2A 1528 and 1530 deletion |
| Sample 1 | Normal | |
| Sample 2 | Normal | |
| Sample 3 | Normal | |
| Sample 5 | Normal | |
| Sample 6 | Normal | |
| Sample 7 | Normal | |
| Sample 8 | Normal | |
| Sample 9 | Normal | |
| Sample 10 | Normal | |
| Sample 11 | Normal | |
| BRCA1_SalsaP087 | Sample 1 | Normal |
| Sample 2 | Normal | |
| Sample 3 | Normal | |
| Sample 4 | Exon 3–8 duplication | |
| Sample 5 | Gene deletion | |
| Sample 6 | Exon 18 duplication | |
| Sample 7 | Normal | |
| Sample 8 | Normal | |
| Sample 9 | Normal | |
| Sample 10 | Normal | |
| Sample 11 | Normal | |
| Sample 12 | Normal | |
| Sample 13 | Normal | |
| Sample 14 | Normal | |
| Sample 15 | Normal | |
| BRCA2_SalsaP045 | Sample 1 | Normal |
| Sample 2 | Normal | |
| Sample 6 | Normal | |
| Sample 4 | Normal | |
| Sample 5 | Normal | |
| Sample 4 | Gene deletion | |
| Sample 7 | Normal | |
| Sample 8 | Normal | |
| Sample 9 | Normal | |
| Sample 10 | Normal | |
| Sample 11 | Normal | |
| Sample 12 | Normal | |
| Sample 13 | Normal | |
| HNPCC_SalsaP003 | Sample 1 | Normal |
| Sample 2 | Normal | |
| Sample 3 | Normal | |
| Sample 4 | MSH2 exon 11–14 deletion | |
| Sample 5 | Normal | |
| Sample 6 | Normal | |
| Sample 7 | MSH2 exon 9–10 deletion | |
| Sample 8 | Normal | |
| Sample 9 | Normal | |
| Sample 10 | Normal | |
| Sample 11 | Normal |
FIGURE 5.
This assay amplified MLH1 and MSH2 genes in the same reaction. The Report Manager allowed the user to edit MLH1 and MLH2 results in two separate reports by a single click on the Report Setting menu. Plots view of deleted MSH2 exon 9 and 10 for sample 7 (line 7, blue arrows), and deleted exons 11–14 for sample 4 (line 4, green arrows). Please note a normal pattern for the MLH1 gene.
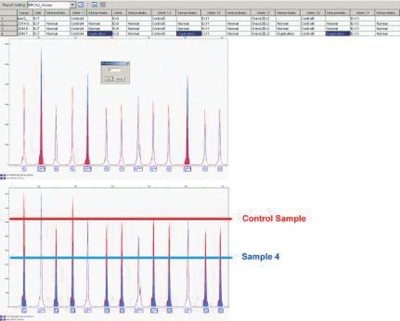
The analysis of MLPA data for BRCA2 sample 6 and BRCA1 sample 5 showed unexpected results, where all assay control peaks were reported as “duplicated” and target loci as “normal,” which suggested a normalization issue. After a detailed review of the electropherograms and a manual correction of normalization using the DyeScale feature to adjust the peak height of the control probes, a deletion of the entire BRCA2 gene was demonstrated (Figure 6). This result confirmed that global normalization should be used only when the majority of probes are expected to be reported as “normal.” Furthermore, unexpected results of control probes in the GeneMapper result report should always be reviewed in detail. In some cases, inconsistent results were observed, depending on the control sample used for data comparison. In these situations, the use of an alternative control sample provided better results. Running additional control samples (2–3) provides added analysis flexibility when such inconsistencies occur.
FIGURE 6.
Report Manager showed unexpected results for sample 4, where all control peaks were flagged “duplicated.” The DyeScale feature allowed the user to manually adjust sample normalization. After DyeScale correction (coefficient 0.7 in this case), this profile showed a complete BRCA2 gene deletion.
CONCLUSION
Copy number variation analysis for 50 DNA samples has been successfully demonstrated using MLPA assays on the Applied Biosystems Genetic Analyzers and GeneMapper v4.0 software. Sample reports for each gene or region have been generated for rapid detection of candidate samples with large deletion(s) or duplication(s). The fast, accurate, and automated workflow demonstrated in this study allowed the user to easily detect large genomic rearrangements in unknown samples.
REFERENCES
- 1.Armour JAL, Barton DE, Cockburn DJ, Taylor GR. The detection of large deletions or duplications in genomic DNA. Hum Mutat. 2002;20:325–337. doi: 10.1002/humu.10133. [DOI] [PubMed] [Google Scholar]
- 2.Shouten JP, McElgunn CJ, Waaijer R, Zwijnenburg D, Diepvens F, Pals G. Relative quantification of 40 nucleic acid sequences by mulitplex ligation-dependent probe amplification. Nucleic Acids Res. 2002;30:e57. doi: 10.1093/nar/gnf056. [DOI] [PMC free article] [PubMed] [Google Scholar]
- 3.Hogervorst FBL, Nederlof PM, Gille JJP, McElgunn CJ, Grippeling M, Pruntel R, et al. Large genomic deletions and duplications in the BRCA1 gene identified by a novel quantitative method. Cancer Res. 2003;63:1449–1453. [PubMed] [Google Scholar]


