Abstract
Genetically encoded biosensors based on FRET have enabled the visualization of signaling events in live cells with high spatiotemporal resolution. However, the limited sensitivity of these biosensors has hindered their broad application in biological studies. We have paired enhanced CFP (ECFP) with YPet, a variant of YFP. This ECFP/YPet FRET pair markedly enhanced the sensitivity of biosensors (several folds enhancement without the need of tailored optimization for each individual biosensor) for a variety of signaling molecules, including tyrosine kinase Src, small GTPase Rac, calcium, and a membrane-bound matrix metalloproteinase MT1-MMP. The application of these improved biosensors revealed that the activations of Src and Rac by PDGF displayed distinct subcellular patterns during directional cell migration on micropatterned surface. The activity of Rac is highly polarized and concentrated at the leading edge, whereas Src activity is relatively uniform. These FRET biosensors also led to the discovery that Src and Rac mutually regulate each other. Our findings indicate that molecules within the same signaling feedback loop can be differentially regulated at different subcellular locations. In summary, ECFP/YPet may serve as a general FRET pair for the development of highly sensitive biosensors to allow the determination of molecular hierarchies at subcellular locations in live cells.
Keywords: PDGF, VEGF, polarity, micropattern, migration
FRET is a phenomenon of quantum mechanics allowing the detection of distance/orientation changes between fluorophore pairs (1). Genetically encoded FRET biosensors consisting of a donor and an acceptor fluorescence protein (FP) can be conveniently introduced into cells and targeted to subcellular compartments. Hence, these biosensors have been widely developed and applied for the detection of various molecular activities in live cells with high spatiotemporal resolution (2). Early studies used enhanced blue FP (EBFP) and enhanced GFP (EGFP) as the FRET pair for biosensor development (1). Because enhanced CFP (ECFP) has better extinction coefficient, quantum yield, and photostability than EBFP (3), ECFP and variants of enhanced YFP (EYFP) have become the most popular FRET pairs. However, the sensitivity of many biosensors based on ECFP and EYFP is generally limited. Recently, a high-efficiency FRET pair, CyPet and YPet, has been developed to significantly enhance the dynamic range of a protease biosensor (4). However, CyPet folded poorly at 37°C and hence is not suitable for live cell imaging (5). Therefore, other FP pairs are desired for the development of highly sensitive FRET biosensors.
Src kinase plays crucial roles in a variety of cellular functions, including angiogenesis and cancer development (6). For example, angiogenic VEGF has been shown to activate Src to regulate cell motility and migration during angiogenesis process (7). It has also been documented that Src contributes to cell migration by modulating Rac, a small GTPase controlling cell protrusion and lamellipodia formation (8). Src can phosphorylate p130cas, which recruits Crk and DOCK180 (9). Src can also activate PI3K and its product, PIP3, to recruit and activate DOCK180 (9–11). The activated DOCK180 can bind to ELMO and activates Rac (12). Other guanine exchange factors (GEFs) of Rac, e.g., Vav2 and Tiam1, can also be recruited to plasma membrane by PIP3 or directly phosphorylated by Src to induce the Rac activation (13, 14). However, Rac and other family members of Rho small GTPases were suggested to mediate the correct localization and activation of Src (15). PDGF activates both Src and Rac to regulate cell migration (15, 16). However, the spatiotemporal interrelationship between Src and Rac in regulating cell migration is not clear.
In this article, we have paired ECFP and YPet to develop sensitive FRET biosensors. The results revealed that YPet as an acceptor paired with ECFP can significantly enhance the sensitivity of a variety of FRET biosensors compared with the popular FRET pairs consisting of ECFP and EYFP variants (Citrine or Venus). The ECFP/YPet-based Src biosensor allowed the observation of a VEGF-induced transient Src activation with subcellular gradient, which was not detectable with the biosensor based on ECFP and Citrine. With the improved biosensors, we further visualized that Src and Rac mutually regulate each other in response to PDGF but differ in subcellular distribution. This phenomenon was particularly obvious when cells were induced to have a directional migration along micropatterned stripes (10 μm in width) coated with extracellular matrix (ECM) proteins. Hence, our results indicate that ECFP and YPet may serve as a general FRET pair for the development of highly sensitive biosensors for the determination of molecular hierarchy at different subcellular locations in live cells.
Results
Spectra Properties of Purified FRET Biosensors.
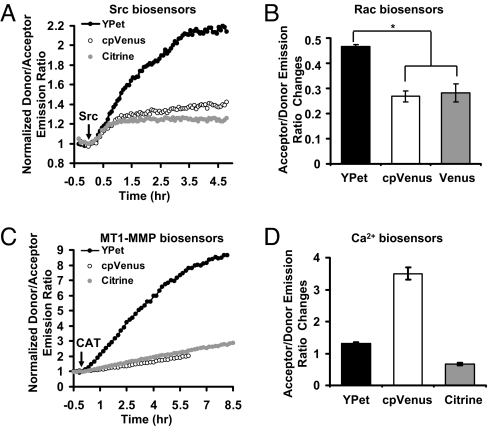
The main limitation of genetically encoded FRET biosensors based on FPs is their poor sensitivities (17). We have paired YPet with ECFP and examined the derived biosensors. We replaced Citrine in a Src FRET biosensor (18) with YPet. In vitro kinase assay revealed that Src kinase induced an ≈120% donor/acceptor emission-ratio change of the ECFP/YPet-based biosensor compared with a 25% change of the ECFP/Citrine-based biosensor [Fig. 1A, supporting information (SI) Fig. S1A]. The replacement of Citrine with cpVenus, a circularly permutated version of Venus that significantly enhanced the sensitivity of a calcium biosensor (19), only slightly increased the dynamic range of the Src biosensor to 40% change (Fig. 1A, Fig. S1A). We further examined the effect of YPet as a FRET acceptor on other biosensors. The acceptor/donor emission ratio of a YPet-based Rac biosensor Raichu-Rac with an active mutation V12 (Raichu-RacV12) was 46% higher than that with a negative mutation N17 (Raichu-RacN17). In contrast, it was 28% or 26% when Venus or cpVenus was used for Raichu-Rac, respectively (Fig. 1B, Fig. S1B). A significantly enhanced sensitivity of a MT1-MMP FRET biosensor was also observed with YPet as the acceptor (570% change before and after MT1-MMP cleavage), compared with 100% with ECFP/Citrine pair and 90% with ECFP/cpVenus pair (Fig. 1C, Fig. S2B). We further examined the effect of YPet for an ECFP/cpVenus-based calcium biosensor that has been meticulously optimized to achieve a superior sensitivity (19). In our hand, a 350% change of cpVenus/ECFP emission ratio can be observed between calcium free and calcium saturated solutions (Fig. 1D, Fig. S2A). When cpVenus was replaced with Citrine, the sensitivity was reduced to 65%, which can be restored to 135% when replacing Citrine with YPet (Fig. 1D, Fig. S2A). These results indicate that YPet as the acceptor for FRET can significantly enhance the dynamic range of biosensors for different kinds of molecules, including Src kinase, Rac small GTPase, and MT1-MMP. YPet appears inferior to cpVenus for a Ca2+ biosensor in vitro. However, it should be noted that this Ca2+ biosensor was tailored and optimized specifically for cpVenus.
Fig. 1.
The sensitivities of purified biosensor proteins with different FRET pairs. (A and C) The time courses of normalized donor/acceptor emission ratio of (A) Src or (C) MT1-MMP biosensors (with YPet, cpVenus, or Citrine as the FRET acceptor) before and after the incubation with (A) Src or (C) the catalytic domain of MT1-MMP (CAT). (B) The bar graphs (mean ± SEM, n = 3) represent the acceptor/donor emission ratio changes of Rac biosensors (with YPet, cpVenus, or Venus as the FRET acceptor) with active mutation V12 vs. negative mutation N17. “*” indicates the significant difference between different groups. (D) The acceptor:donor emission ratio changes (mean ± SEM, n = 3) of Calcium biosensors (with YPet, cpVenus, or Citrine as the FRET acceptor) in calcium saturated vs. calcium-free solutions.
ECFP and YPet Enhanced the Sensitivity of FRET Biosensors in Mammalian Cells.
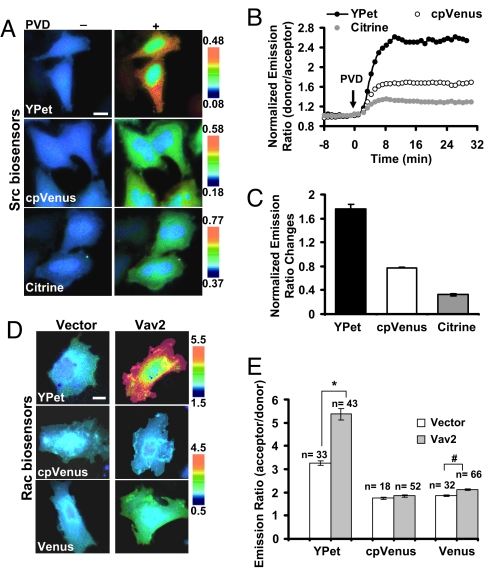
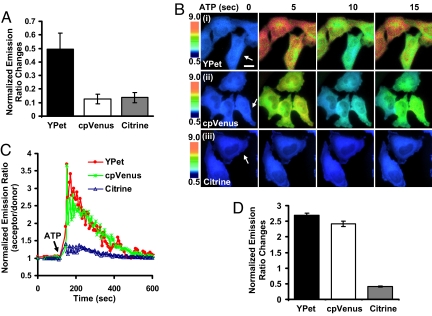
We then examined the dynamic ranges of biosensors in mammalian cells. In response to pervanadate (PVD), a tyrosine phosphatase inhibitor and hence biosensor activator, the dynamic range of Src biosensor with YPet as the FRET acceptor was 176% comparing to 77% with cpVenus and 32% with Citrine in HeLa cells (Fig. 2 A–C, Movie S1). When Vav2, a GEF and activator for Rac, was coexpressed together with the Raichu-Rac biosensors in mouse embryonic fibroblasts (MEFs), the YPet-based Raichu-Rac biosensor displayed a 70% increase in emission ratio comparing to 15% with Venus and 5% with cpVenus (Fig. 2 D and E). Similarly, the MT1-MMP biosensor using YPet, but not cpVenus or Citrine, showed a maximal response to 10% FBS (FBS) stimulation in HeLa cells (Fig. 3A). YPet as a FRET acceptor also led to a Ca2+ biosensor with much higher sensitivity than Citrine (Fig. 3 B–D, Movie S2). It is of note that the normalized emission ratio change of Ca2+ biosensors with YPet is at least similar or even better than that with cpVenus in live HeLa cells (253% vs. 242%, Fig. 3 C and D). The dynamic range of absolute emission ratio of YPet-based biosensor is also larger than that of cpVenus (Fig. 3B), allowing a possible enhancement of signal:noise ratio. These results suggest that ECFP and YPet can significantly enhance the sensitivities of FRET biosensors in live cells and in vitro. The sensitivities of different biosensors as purified proteins or in live mammalian cells are summarized in Table S1.
Fig. 2.
Src or Rac biosensors with different FRET pairs in live mammalian cells. (A) The donor/acceptor emission ratio images of Src biosensors (with YPet, cpVenus, or Citrine as the FRET acceptor) before and after 20 μM PVD treatment in HeLa cells. (B) Time courses of normalized emission ratios in A. (C) Bar graphs represent the emission ratio changes (mean ± SEM, n = 9) of Src biosensors in A. (D) The acceptor/donor emission ratio images of Rac biosensors (with YPet, cpVenus, or Venus as the FRET acceptor) cotransfected with a blank vector or a Rac GEF Vav2. (E) Bar graphs represent the emission ratios of Rac biosensors from multiple cells (mean ± SEM) in D. “n” represents the cell number in each group. “*”, and “#” indicate the significant difference between different groups. (Scale bars, 30 μm.)
Fig. 3.
MT1-MMP or Ca2+ biosensors with different FRET pairs in live mammalian cells. (A) Emission ratio changes (mean ± SEM, n = 3) of MT1-MMP biosensors (with YPet, cpVenus, or Citrine as the FRET acceptor) in HeLa cells before and after subjected to 10% FBS for 12 h. (B) Emission ratio images of Ca2+ biosensors (with YPet, cpVenus, or Citrine as the FRET acceptor) before and after 30 μM ATP treatment for various periods of time in HeLa cells. (C) Time courses of the oscillating emission ratios in the cells of interest as indicated by the white arrows in B. (D) Bar graphs represent that acceptor/donor emission ratio changes (mean ± SEM, n = 24) of Ca2+ biosensors in B. (Scale bar, 30 μm.)
The YPet-Based Src Biosensor Revealed a Transient Src Activation with a Subcellular Gradient in Response to VEGF.
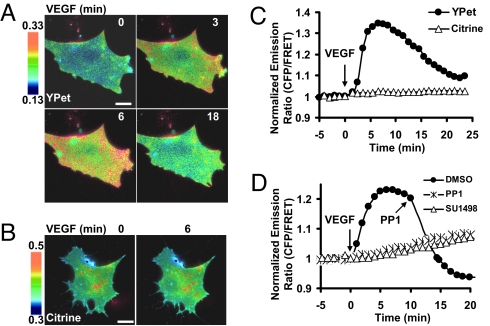
Both VEGF and Src are critical for angiogenesis. In fact, Src has been shown to mediate the effect of VEGF on downstream signaling cascades and cellular functions (7). However, we had difficulties in detecting the VEGF-induced Src activation using an ECFP/Citrine-based biosensor (18). Ample evidence suggests that Src kinase functions mainly at the cell membrane (16). We have hence targeted the YPet-based Src biosensor to the plasma membrane by fusing the biosensor with a prenylation substrate sequence (KKKKKKSKTKCVIM) derived from KRas to visualize the VEGF-induced membrane Src activation in live endothelial cells. VEGF induced a transient Src activation, with a higher activity concentrated at the cell periphery (Fig. 4 A and C, Movie S3). In contrast, the membrane-targeted Src biosensor based on ECFP/Citrine did not show significant FRET change upon VEGF stimulation (Fig. 4 B and C, Movie S3). SU1498, an inhibitor of VEGFR2 (Flk-1), or PP1, an inhibitor of Src, abolished this VEGF-induced FRET response (Fig. 4D, Fig. S3, Movie S4), confirming that the observed FRET change is due to VEGF signaling and Src activation. In MEFs cultured on fibronectin, YPet as the FRET acceptor also rendered in the strongest FRET response of Rac biosensor comparing to cpVenus or Venus upon 50 ng/ml PDGF stimulation (Fig. S4 A–C). The relatively weak FRET response upon PDGF stimulation may be attributed to high basal levels of Rac activity induced by fibronectin–integrin interactions. These results demonstrated that the YPet-based biosensor is more sensitive in detecting the possibly moderate but physiologically important Src and Rac activation in response to growth factors.
Fig. 4.
A transient Src activation in response to VEGF was detected by the ECFP/YPet-based Src biosensor. Emission ratio images of the membrane-targeted Src biosensors based on (A) ECFP/YPet or (B) ECFP/Citrine in response to 50 ng/ml VEGF in BAECs. (C) Emission ratio time courses of the Src biosensors with YPet or Citrine as the FRET acceptor. (D) Emission ratio time courses of the ECFP/YPet-based Src biosensor in response to VEGF pretreated with SU1498 (“SU1498”), PP1 (“PP1-pretreated”) or control solvent DMSO (“Control”). (Scale bars, 30 μm.)
Src Mediates the PDGF-Induced Rac Polarization.
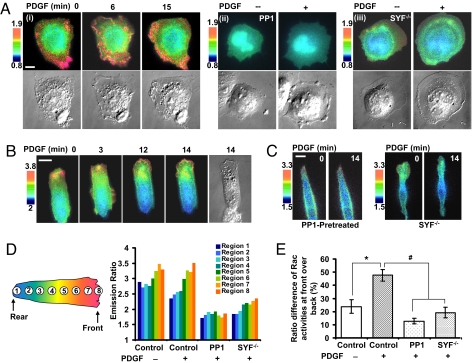
We have further applied the improved biosensors for the study of molecular hierarchy at subcellular levels in cell migration, in which both Src and Rac have been shown to play important roles (20). We first applied the YPet-based Rac biosensor to visualize the spatiotemporal Rac activity during cell migration in response to PDGF and investigated the role of Src in regulating this Rac activation. MEFs cultured on fibronectin for 3 h displayed an higher FRET signal of Rac at the cell periphery (Fig. 5Ai), possibly reflecting a Rac activation induced by the nascent integrin ligation during random cell migration (21–23). PDGF induced a strong Rac activation at membrane ruffles and a moderate overall activation of Rac in the whole cell (Fig. 5Ai, Movie S5). Both the basal and PDGF-induced Rac activity were significantly inhibited in MEFs pretreated with the Src inhibitor PP1 (Fig. 5Aii, Fig. S5, Movie S6) or in Src/Yes/Fyn triple-knockout (SYF −/−) MEFs (Fig. 5Aiii, Fig. S5, Movie S7). These results suggest that Src is essential for Rac activation. To further characterize the spatiotemporal Rac activity, MEF cells transfected with the Rac biosensor were seeded atop fibronectin-coated stripes (10 μm in width) to constrain the cell adhesion and control the direction of cell migration. Rac activity in these cells displayed a moderate polarized distribution, with a higher activity concentrated at the leading edge. PDGF significantly enhanced this polarization (Fig. 5B, Movie S8). Again, the inhibition of Src by PP1 or Src/Yes/Fyn triple-knockout blocked this polarized Rac activity before and after PDGF stimulation (Fig. 5C, Fig. S6, Movie S9). Statistical analysis by quantifying the Rac activities over subcellular segments along the migrating direction confirmed the polarized Rac activity, which is significantly enhanced by PDGF and abolished by the inhibition of Src (Fig. 5 D and E). These results suggest that PDGF induced a polarized Rac activation, which is mediated by Src.
Fig. 5.
PDGF-induced a highly polarized Rac activity in MEF cells, which is mediated by Src. (A) (i Upper) Emission ratio images of the ECFP/YPet-based Rac biosensor in response to 50 ng/ml PDGF in MEF cells seeded on Fibronectin-coated glass lower dishes. (Lower) The DIC images of the cell shown in the top. (ii and iii, Upper) Emission ratio images of the ECFP/YPet-based Rac biosensor before and after PDGF stimulation in (ii) a MEF cell pretreated with 10 μM PP1 for 1 h or (iii) a Src/Yes/Fyn triple-knockout (SYF−/−) MEF cell. (Lower) The DIC images of the cell shown in the top. (B) Emission ratio images of the ECFP/YPet-based Rac biosensor in a MEF cell cultured on fibronectin-coated stripes (10 μm in width) before and after PDGF stimulation for various periods of time. (C) Emission ratio images of the ECFP/YPet-based Rac biosensor in response to PDGF in a MEF cell pretreated with 10 μM PP1 for 1 h, or in a Src/Yes/Fyn triple-knockout (SYF−/−) MEF cell. (D) Bar graphs represent the emission ratios of the ECFP/YPet Rac biosensor averaged over subcellular regions divided along the migration direction on Fn stripes as indicated before and after PDGF stimulation, in control or PP1 pretreated MEF cells, or in SYF−/− cells. (E) Bar graphs representing the ratio of Rac activities at leading edge over the cell rear (mean ± SEM, n = 4) in cells with the same conditions as in D. “*” and “#” indicates the significant difference between groups. (Scale bars, 30 μm.)
PDGF Induced a Global Activation of Src, Which Is Mediated by Rac.
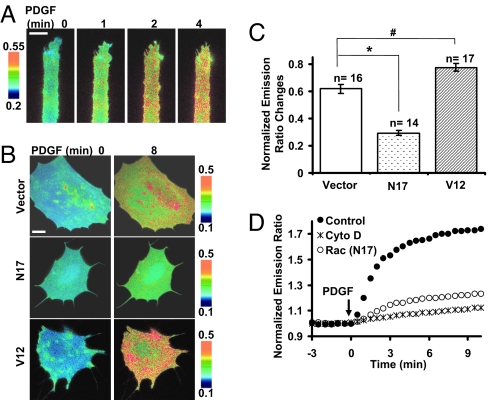
Because Src mediates the polarized Rac activities in response to PDGF, we then asked whether PDGF also induced a polarized Src activation. To our surprise, PDGF-induced Src activation is global without a clear spatial pattern at subcellular levels, even when MEFs were constrained on fibronectin stripes to have directional migration (Fig. 6A, Fig. S7, Movie S10). Interestingly, the PDGF-induced Src activation is inhibited by RacN17, a dominant negative mutant of Rac, but enhanced by RacV12, a constitutively active mutant of Rac (Fig. 6 B and C, Movie S11). These results indicate that although the activations of Src and Rac in response to PDGF have differential spatial characteristics, Src and Rac mutually regulate each other. Further investigations revealed that RacN17 disrupted actin filaments (Fig. S8) and the disruption of actin filaments by Cyto D blocked the PDGF-induced Src activation (Fig. 6D, Fig. S8). Together with the observation that Cytochalasin D inhibited PDGF-induced Src activation in MEF cells transfected with RacV12 (data not shown), these results suggest that Rac regulates the PDGF-induced Src activation via actin cytoskeleton.
Fig. 6.
PDGF-induced a global activation of Src in MEF cells, which is mediated by Rac. (A) Emission ratio images of the ECFP/YPet-based membrane-targeted Src biosensor in a MEF cell cultured on fibronectin-coated stripes before and after PDGF stimulation. (B) Emission ratio images of the ECFP/YPet-based membrane-targeted Src biosensor before and after PDGF stimulation in MEF cells cotransfected with blank vector, RacN17, or RacV12. (C) Bar graphs represent the emission ratios of the ECFP/YPet-based Src biosensor (mean ± SEM) from multiple cells with the same conditions as shown in B. “n” denotes the sample number in each group. “*” and “#” represent the significant difference between indicated groups. (D) Emission ratio time courses of the Src biosensor in response to PDGF in MEF cells cotransfected with RacN17, pretreated with Cyto D (1 μM) for 1 h, or kept as control. (Scale bars, 30 μm.)
Discussion
In this article, we have demonstrated that ECFP and YPet as a FRET pair can significantly improve the sensitivity of genetically encoded biosensors for a variety of signaling molecules, including tyrosine kinase Src, small GTPase Rac, Calcium, and membrane-bound matrix metalloproteinase MT1-MMP. This is particularly so in live cells (see Table S1). The improved Src biosensor allows the visualization of Src activation with high spatiotemporal resolution in endothelial cells upon physiological VEGF stimulation. The application of multiple improved biosensors also revealed that Src and Rac activities displayed distinct spatial patterns at subcellular levels although they are engaged in mutual regulation. In summary, our results indicate that ECFP/YPet should serve as a general FRET pair to enhance the sensitivity of existing biosensors or to develop new ones with high sensitivity. These improved biosensors can allow the elucidation of the molecular hierarchies at subcellular levels in live cells.
Genetically encoded FRET biosensors have revolutionized the field of live-cell imaging. However, FRET efficiency depends on the sixth power of, and hence sensitive to, the donor–acceptor distance. Because of the large size and thick β-barrel shell of FPs encompassing the embedded fluorophores (1), the usable distance for FRET between FPs is within 6–7 nm, which results in the generally small signals of FRET biosensors if not meticulously optimized (17). Hence, our discovery that the ECFP and YPet pair can significantly enhance the sensitivities of a wide spectrum of FRET biosensors should have broad impact on live cell imaging and cell biology in general.
It was revealed recently that the enhancement of FRET sensitivity by the CyPet/YPet pair is due to the intrinsic dimerization between these two FPs (24). We have also examined the monomerized ECFP and YPet with A206K mutations (25). The sensitivity of ECFP/YPet-based Src biosensor was significantly reduced by FP monomerization both in vitro and in mammalian cells (data not shown). These results suggest that the high sensitivity of our biosensors with ECFP/YPet pair, at least in part, is attributed to the dimerization tendency of ECFP and YPet. This supports the notion that the weak dimerization tendency of some FPs can be used to increase the biosensor sensitivity as long as the affinity between the designated interacting molecular domains within the biosensors is stronger than that of FP dimerization to cause conformational changes. It is of note that the VEGF-induced activation of Src biosensor is transient and reversible (Fig. 4), suggesting that this dimerization may not cause artificial complications in reporting physiological signaling responses.
VEGF is recognized as the key regulator of angiogenesis and vascular permeability (26). VEGF has also been known to activate Src in endothelial cells to disrupt adherens junctions (27). Our improved Src biosensor clearly revealed a transient Src activation in response to VEGF, with a higher Src activity located at the cell periphery (Fig. 4A). In contrast, the ECFP/Citrine-based Src biosensor did not detect a significant Src activation in response to VEGF (Fig. 4B). These results suggest that the improved biosensors can detect relatively moderate, but physiological important signaling activities with high spatiotemporal resolution.
The distinct activation patterns of mutually regulated Src and Rac in response to PDGF are intriguing. Although Rac activity clearly demonstrated a polarized distribution with high activities concentrated at the leading edge of directional migration (Fig. 5) (23, 28), the Src activation appears to be global without a specific subcellular pattern. The distinct spatial patterns of Src and Rac activities may reflect the different activation mechanisms of Src and Rac in response to PDGF. In fact, PDGF activates Rac and cell polarization through the coordination with integrins (29, 30). PDGF receptor and integrin αvβ3 have been shown to colocalize at the leading edge of migrating cells (29). The stimulated PDGF receptor and its phosphorylated cytoplasmic tails can recruit P85 and PI3K to converts PI(4,5)P2 into PIP3, which subsequently recruit Rac GEFs, such as Vav2 and DOCK180. At the same time, the accumulated integrins and nascent integrin-ligation at the leading edge can recruit Rac to membrane lipid rafts (21, 31). This concurrent localization of Rac and its GEFs leads to the polarized Rac activity, with its high activities concentrated at the leading edge. Activated Rac can further form positive feedback loops with concurrently localized PI3K and integrins to maintain a persistent polarization (32). This PDGF-activated polarization of Rac is mediated by Src kinase (Fig. 5), which has been shown to regulate PI3K and other Rac GEFs (e.g., DOCK180) (33). In contrast to the Rac activation, Src kinase can be directly recruited by the phosphorylated cytoplasmic tail of PDGF receptor through Src SH2 domain (34). It appears that integrins and their ligation may not participate in the PDGF-induced Src activation. In fact, significant Src activation in response to PDGF can be observed in cells cultured on Con A (data not shown), a nonspecific adhesion molecule independent of integrins (35). The PDGF-induced Src activation may be facilitated by the Src translocation from perinuclear regions to plasma membrane upon PDGF stimulation, mediated by Rac and actin filament (15). Indeed, the inhibition of Rac by RacN17 or the disruption of actin filaments inhibited PDGF-induced Src activation (15) (Fig. 6D).
The distinct spatial patterns of mutually regulated Src and Rac also suggest that molecular interactions and their biological functions in live cells are largely dependent on their subcellular location/environment, possibly because of the different sets of mediator molecules at different subcellular locations. This notion is underscored by recent findings that (i) Src induces the p190RhoGAP activation and subsequently inhibits RhoA at the focal adhesion sites (34), whereas Src activates RhoA at podosomes (36); (ii) RhoA couples with its downstream molecule ROCK at the cell rear and a contractile region behind lamellipodium, but colocalizes with another substrate molecule mDia at the leading edge of a migrating cell (37, 38).
Recently, novel FPs with superior fluorescence properties have been developed, including BFP variants Azurite and EBFP2, CFP variant mTFP1, and RFP variants TagRFP and mKate (2). However, the usefulness of these new FPs for FRET applications in live cells has not been examined extensively. Future studies are warranted to further explore and develop improved FRET pairs.
Methods
Gene Construction and DNA Plasmids.
The construction of Src FRET biosensors is similar to that described (18). In brief, the central fragment consists of the c-Src SH2 domain with a SphI site at the N terminus followed by a flexible linker, a substrate peptide derived from p130cas, and a SacI site. This fragment was further fused with an N-terminal ECFP and a C-terminal YFP variants (Citrine, YPet or cpVenus). The membrane-targeted Src biosensor was constructed by fusion of a prenylation substrate sequence (KKKKKKSKTKCVIM) from KRas to the C terminus of the cytosolic biosensor. Rac FRET biosensors were derived from pRaichu-Rac1/RacCT (28), by replacing Venus with cpVenus or YPet. The C-terminal 11 aa of YPet were deleted the same as Venus in the Rac biosensors. A highly sensitive Ca2+ biosensor (YC3.6) containing cpVenus (in which the N- and C-fragments of Venus were swamped at Asp-173) as the FRET acceptor was described (19). Citrine and YPet was applied to replace cpVenus to generate different versions of Ca2+ biosensors. For the MT1-MMP FRET biosensors, the substrate peptide sequence CPKESCNLFVLKD connecting a N-terminal YFP variant (Citrine, cpVenus, or YPet) and a C-terminal ECFP was derived from MT1-MMP substrate-molecule, proMMP-2 (39). Biosensor constructs for Src, Rac, and Ca2+ were cloned into pRSETB (Invitrogen) for bacteria expression and into pcDNA3.1 (Invitrogen) behind a Kozak sequence for mammalian cell expression using BamHI/EcoRI. The MT1-MMP biosensors were cloned into pRSETB (Invitrogen) using BglII/HindIII and into pDisplay (Invitrogen) using BglII/PstI for outer membrane expression in mammalian cells. The negative (N17) or active (V12) mutant of Rac biosensors and monomerized YPet (A206K) were generated by using QuikChange Site-Directed Mutagenesis Kit (Stratagene).
Microscope, Image Acquisition, and Analysis.
Cells expressing various exogenous proteins were starved with 0.5% FBS for 36–48 h before growth factors (50 ng/ml) or Pervenadate (20 μM) stimulation. During imaging process, the cells were maintained in CO2-independent medium (Gibco BRL) without serum at 37°C. Images were collected by a Zeiss axiovert inverted microscope equipped with a cooled charge-coupled device camera (Cascade 512B; Photometrics) using MetaFluor 6.2 software (Universal Imaging). The parameters of dichroic mirrors, excitation and emission filters for FRET and different fluorescence proteins are shown in Table S2. The emission ratio images were computed and generated by the MetaFluor software to represent the FRET efficiency before they were subjected to quantification and analysis by Excel (Microsoft).
Statistical Analysis.
Statistical analysis was performed by using a Student's t test function of the Excel software (Microsoft) to evaluate the statistical difference between groups. A significant difference was determined by P value (< 0.05). The description of other methods can be found in SI Text.
Supplementary Material
Acknowledgments.
We thank Drs. Roger Y. Tsien (University of California, San Diego), Michiyuki Matsuda (Osaka University, Japan), Atsushi Miyawaki (Brain Science Institute, Japan), Stephen J. Weiss (University of Michigan, Ann Arbor), and Ben N. G. Giepmans (University Medical Center Groningen, The Netherlands) for valuable reagents and constructs. This work was supported in part by grants from the Wallace H. Coulter Foundation and Beckman Laser Institute, Inc. (to Y.W.) and National Institutes of Health Grants HL-064382, HL-080518, and HL-085159 (to S.C.).
Footnotes
The authors declare no conflict of interest.
This article contains supporting information online at www.pnas.org/cgi/content/full/0807537105/DCSupplemental.
References
- 1.Tsien RY. The green fluorescent protein. Annu Rev Biochem. 1998;67:509–544. doi: 10.1146/annurev.biochem.67.1.509. [DOI] [PubMed] [Google Scholar]
- 2.Wang Y, Shyy J Y-J, Chien S. Fluorescence proteins, live cell imaging, and mechanobiology: Seeing is believing. Annu Rev Biomed Eng. 2008;10:1–38. doi: 10.1146/annurev.bioeng.010308.161731. [DOI] [PubMed] [Google Scholar]
- 3.Miyawaki A, et al. Fluorescent indicators for Ca2+ based on green fluorescent proteins and calmodulin. Nature. 1997;388:882–887. doi: 10.1038/42264. [DOI] [PubMed] [Google Scholar]
- 4.Nguyen AW, Daugherty PS. Evolutionary optimization of fluorescent proteins for intracellular FRET. Nat Biotechnol. 2005;23:355–360. doi: 10.1038/nbt1066. [DOI] [PubMed] [Google Scholar]
- 5.Shaner NC, Steinbach PA, Tsien RY. A guide to choosing fluorescent proteins. Nat Methods. 2005;2:905–909. doi: 10.1038/nmeth819. [DOI] [PubMed] [Google Scholar]
- 6.Mitra SK, Schlaepfer DD. Integrin-regulated FAK-Src signaling in normal and cancer cells. Curr Opin Cell Biol. 2006;18:516–523. doi: 10.1016/j.ceb.2006.08.011. [DOI] [PubMed] [Google Scholar]
- 7.Eliceiri BP, et al. Selective requirement for Src kinases during VEGF-induced angiogenesis and vascular permeability. Mol Cell. 1999;4:915–924. doi: 10.1016/s1097-2765(00)80221-x. [DOI] [PubMed] [Google Scholar]
- 8.Hall A. Rho GTPases and the control of cell behaviour. Biochem Soc Trans. 2005;33:891–895. doi: 10.1042/BST20050891. [DOI] [PubMed] [Google Scholar]
- 9.Cote JF, Vuori K. GEF what? Dock180 and related proteins help Rac to polarize cells in new ways. Trends Cell Biol. 2007;17:383–393. doi: 10.1016/j.tcb.2007.05.001. [DOI] [PMC free article] [PubMed] [Google Scholar]
- 10.Cote JF, Motoyama AB, Bush JA, Vuori K. A novel and evolutionarily conserved PtdIns(3,4,5)P3-binding domain is necessary for DOCK180 signalling. Nat Cell Biol. 2005;7:797–807. doi: 10.1038/ncb1280. [DOI] [PMC free article] [PubMed] [Google Scholar]
- 11.Pleiman CM, Hertz WM, Cambier JC. Activation of phosphatidylinositol-3′ kinase by Src-family kinase SH3 binding to the p85 subunit. Science. 1994;263:1609–1612. doi: 10.1126/science.8128248. [DOI] [PubMed] [Google Scholar]
- 12.Rodriguez OC, et al. Conserved microtubule-actin interactions in cell movement and morphogenesis. Nat Cell Biol. 2003;5:599–609. doi: 10.1038/ncb0703-599. [DOI] [PubMed] [Google Scholar]
- 13.Han J, et al. Role of substrates and products of PI 3-kinase in regulating activation of Rac-related guanosine triphosphatases by Vav. Science. 1998;279:558–560. doi: 10.1126/science.279.5350.558. [DOI] [PubMed] [Google Scholar]
- 14.Sander EE, et al. Matrix-dependent Tiam1/Rac signaling in epithelial cells promotes either cell-cell adhesion or cell migration and is regulated by phosphatidylinositol 3-kinase. J Cell Biol. 1998;143:1385–1398. doi: 10.1083/jcb.143.5.1385. [DOI] [PMC free article] [PubMed] [Google Scholar]
- 15.Fincham VJ, et al. Translocation of Src kinase to the cell periphery is mediated by the actin cytoskeleton under the control of the Rho family of small G proteins. J Cell Biol. 1996;135:1551–1564. doi: 10.1083/jcb.135.6.1551. [DOI] [PMC free article] [PubMed] [Google Scholar]
- 16.Sandilands E, et al. RhoB and actin polymerization coordinate Src activation with endosome-mediated delivery to the membrane. Dev Cell. 2004;7:855–869. doi: 10.1016/j.devcel.2004.09.019. [DOI] [PubMed] [Google Scholar]
- 17.Piston DW, Kremers GJ. Fluorescent protein FRET: the good, the bad and the ugly. Trends Biochem Sci. 2007;32:407–414. doi: 10.1016/j.tibs.2007.08.003. [DOI] [PubMed] [Google Scholar]
- 18.Wang Y, et al. Visualizing the mechanical activation of Src. Nature. 2005;434:1040–1045. doi: 10.1038/nature03469. [DOI] [PubMed] [Google Scholar]
- 19.Nagai T, Yamada S, Tominaga T, Ichikawa M, Miyawaki A. Expanded dynamic range of fluorescent indicators for Ca(2+) by circularly permuted yellow fluorescent proteins. Proc Natl Acad Sci USA. 2004;101:10554–10559. doi: 10.1073/pnas.0400417101. [DOI] [PMC free article] [PubMed] [Google Scholar]
- 20.Mareel M, Leroy A. Clinical, cellular, and molecular aspects of cancer invasion. Physiol Rev. 2003;83:337–376. doi: 10.1152/physrev.00024.2002. [DOI] [PubMed] [Google Scholar]
- 21.del Pozo MA, et al. Integrins regulate Rac targeting by internalization of membrane domains. Science. 2004;303:839–842. doi: 10.1126/science.1092571. [DOI] [PubMed] [Google Scholar]
- 22.Del Pozo MA, et al. Integrins regulate GTP-Rac localized effector interactions through dissociation of Rho-GDI. Nat Cell Biol. 2002;4:232–239. doi: 10.1038/ncb759. [DOI] [PubMed] [Google Scholar]
- 23.Kraynov VS, et al. Localized Rac activation dynamics visualized in living cells. Science. 2000;290:333–337. doi: 10.1126/science.290.5490.333. [DOI] [PubMed] [Google Scholar]
- 24.Ohashi T, Galiacy SD, Briscoe G, Erickson HP. An experimental study of GFP-based FRET, with application to intrinsically unstructured proteins. Protein Sci. 2007;16:1429–1438. doi: 10.1110/ps.072845607. [DOI] [PMC free article] [PubMed] [Google Scholar]
- 25.Zacharias DA, Violin JD, Newton AC, Tsien RY. Partitioning of lipid-modified monomeric GFPs into membrane microdomains of live cells. Science. 2002;296:913–916. doi: 10.1126/science.1068539. [DOI] [PubMed] [Google Scholar]
- 26.Ferrara N. Role of vascular endothelial growth factor in regulation of physiological angiogenesis. Am J Physiol. 2001;280:C1358–C1366. doi: 10.1152/ajpcell.2001.280.6.C1358. [DOI] [PubMed] [Google Scholar]
- 27.Gavard J, Gutkind JS. VEGF controls endothelial-cell permeability by promoting the beta-arrestin-dependent endocytosis of VE-cadherin. Nat Cell Biol. 2006;8:1223–1234. doi: 10.1038/ncb1486. [DOI] [PubMed] [Google Scholar]
- 28.Itoh RE, et al. Activation of rac and cdc42 video imaged by fluorescent resonance energy transfer-based single-molecule probes in the membrane of living cells. Mol Cell Biol. 2002;22:6582–6591. doi: 10.1128/MCB.22.18.6582-6591.2002. [DOI] [PMC free article] [PubMed] [Google Scholar]
- 29.Amano H, et al. Interaction and localization of Necl-5 and PDGF receptor beta at the leading edges of moving NIH3T3 cells: Implications for directional cell movement. Genes Cells. 2008;13:269–284. doi: 10.1111/j.1365-2443.2008.01167.x. [DOI] [PubMed] [Google Scholar]
- 30.Li W, et al. Mechanism of human dermal fibroblast migration driven by type I collagen and platelet-derived growth factor-BB. Mol Biol Cell. 2004;15:294–309. doi: 10.1091/mbc.E03-05-0352. [DOI] [PMC free article] [PubMed] [Google Scholar]
- 31.Galbraith CG, Yamada KM, Galbraith JA. Polymerizing actin fibers position integrins primed to probe for adhesion sites. Science. 2007;315:992–995. doi: 10.1126/science.1137904. [DOI] [PubMed] [Google Scholar]
- 32.Ridley AJ, et al. Cell migration: integrating signals from front to back. Science. 2003;302:1704–1709. doi: 10.1126/science.1092053. [DOI] [PubMed] [Google Scholar]
- 33.Chiariello M, Marinissen MJ, Gutkind JS. Regulation of c-myc expression by PDGF through Rho GTPases. Nat Cell Biol. 2001;3:580–586. doi: 10.1038/35078555. [DOI] [PubMed] [Google Scholar]
- 34.Thomas SM, Brugge JS. Cellular functions regulated by Src family kinases. Annu Rev Cell Dev Biol. 1997;13:513–609. doi: 10.1146/annurev.cellbio.13.1.513. [DOI] [PubMed] [Google Scholar]
- 35.Danilov YN, Juliano RL. Phorbol ester modulation of integrin-mediated cell adhesion: A postreceptor event. J Cell Biol. 1989;108:1925–1933. doi: 10.1083/jcb.108.5.1925. [DOI] [PMC free article] [PubMed] [Google Scholar]
- 36.Berdeaux RL, Diaz B, Kim L, Martin GS. Active Rho is localized to podosomes induced by oncogenic Src and is required for their assembly and function. J Cell Biol. 2004;166:317–323. doi: 10.1083/jcb.200312168. [DOI] [PMC free article] [PubMed] [Google Scholar]
- 37.Moissoglu K, Schwartz MA. Integrin signalling in directed cell migration. Biol Cell. 2006;98:547–555. doi: 10.1042/BC20060025. [DOI] [PubMed] [Google Scholar]
- 38.Pertz O, Hodgson L, Klemke RL, Hahn KM. Spatiotemporal dynamics of RhoA activity in migrating cells. Nature. 2006;440:1069–1072. doi: 10.1038/nature04665. [DOI] [PubMed] [Google Scholar]
- 39.Ouyang M, et al. Visualization of polarized membrane type 1 matrix metalloproteinase activity in live cells by fluorescence resonance energy transfer imaging. J Biol Chem. 2008;283:17740–17748. doi: 10.1074/jbc.M709872200. [DOI] [PMC free article] [PubMed] [Google Scholar]
Associated Data
This section collects any data citations, data availability statements, or supplementary materials included in this article.


