

Abstract
Regulatory T cells (Treg) play key roles in immune regulation through multiple modes of suppression. The effects of HIV-1 infection on Treg levels in lymphoid tissues remain incompletely understood. To explore this issue, we have measured the levels of forkhead box protein 3 (FOXP3)-positive cells and associated immunomodulatory genes in a pathogenic simian immunodeficiency virus (SIV)/macaque model and found that a loss of Treg in lymph nodes (LNs) occurred following SIV infection. Changes in expression of the ligands for CXCR3, CCR4, and CCR7, and the cytokines TGF-β and IL-2 were all linked to this loss of Treg, which in turn was linked with increased levels of cellular activation. Our findings identify three mechanisms that likely contribute to SIV-driven loss of Treg, including reduced levels of cytokines associated with Treg differentiation and altered expression of agonist and antagonist chemokines. The loss of Treg and the associated cellular activation in lymphoid tissues is consistent with the events in HIV-1 infected individuals and suggest that components of the Treg differentiation and trafficking network could be targets for therapeutic intervention. This is an author-produced version of a manuscript accepted for publication in The Journal of Immunology (The JI). The American Association of Immunologists, Inc. (AAI), publisher of The JI, holds the copyright to this manuscript. This version of the manuscript has not yet been copyedited or subjected to editorial proofreading by The JI; hence, it may differ from the final version published in The JI (online and in print). AAI (The JI) is not liable for errors or omissions in this author-produced version of the manuscript or in any version derived from it by the U.S. National Institutes of Health or any other third party. The final, citable version of record can be found at www.jimmunol.org.
Introduction
Regulatory T cells (Treg) play important roles in regulation of innate and acquired immunity through multiple modes of suppression. These cells contribute to control of autoimmunity as well as suppression of virus- and tumor-specific immune responses (1, 2). The transcription factor forkhead box protein 3 (FOXP3), is considered to be a highly specific marker for Treg and is a key regulatory gene for their development (3). Increasing evidence indicates that cytokines are involved in regulation of Treg. For example, TGF-β1 and IL-2 are important for differentiation, expansion and survival of FOXP3+ Treg, as both cytokines can induce FOXP3 expression and FOXP3+ Treg suppressive activity (4). Recent reports have indicated that chemokine receptors CCR4 and CCR7 are important in Treg homing to lymph nodes (LNs) and other tissues (5, 6). Indeed, human Treg highly express CCR4 (7) and CCR7 (5), and thus their ligands, CCL17 and CCL21, could modulate homing of Treg to lymphoid tissues. Chemokines are small chemoattractant cytokines that orchestrate leukocyte migration during inflammation and as part of homeostatic immune function, and increasing evidence demonstrates that HIV-1 and SIV infection lead to remodeling of chemotactic environments in lymphoid tissues (8, 9).
Chronic states of T cell hyperactivation, viral persistence, and CD4+ T cell depletion are hallmarks of HIV-1 infection (10), and the roles played by Treg in this complex set of events remain unclear (11, 12). Decreased levels of Treg during HIV-1 infection could lead to development of hyperactivated immune environments, increased viral replication, and activation-associated cell death, whereas increased levels of Treg could lead to suppression of HIV-1-specific and other immune responses. The effects of HIV-1 infection on Treg levels in lymphoid tissues remain incompletely understood and there are multiple reports in the literature that Treg levels increase or decrease during HIV-1 or SIV infection (13, 14, 15, 16, 17), but the mechanisms that lead to alteration of Treg levels in lymphoid tissues after HIV-1 or SIV infection have not been well defined. In the present study, we investigated the effects of pathogenic SIV infection on Treg levels. Our findings indicate that there is a loss of Treg in LNs following pathogenic SIV infection that is linked with changes in expression of the ligands for CXCR3, CCR4, and CCR7, and the cytokines TGF-β and IL-2.
Materials and Methods
Animals and Tissues
These studies were performed under the approval and guidance of the University of Pittsburgh Institutional Animal Care and Use Committee. They included 12 cynomolgus macaques(Macaca fascicularis) infected with SIV/DeltaB670 (18). Of these animals, six were sacrificed during acute infection (2 wk postinfection [PI]), five were sacrificed upon progression to AIDS, and five served as uninfected controls. Details regarding tissue processing and fixation have been described (8).
RNA Isolation and Real-Time RT-PCR
Total RNAs from axillary LNs were isolated, treated with DNase (Ambion) and further purified with RNeasy columns (Qiagen) as described (19). Four hundred ng of RNA from each specimen was reverse transcribed as described (19) with reverse transcriptase-negative controls included in paralleled for each RNA sample. Primers and probes used for the real-time RT-PCR were either purchased from ABI as ready-made sets or were designed using the Primer Express (Applied Biosystems) software package (primer and probe sequences that we designed are available upon request). Real-time RT-PCR was used to measure relative mRNA expression levels by the comparative threshold cycle (Ct) method of relative quantitation as described (19, 20). The Ct values for each gene were normalized to the endogenous control mRNA, β-glucuronidase, and then to an uninfected LN calibrator sample. Quantitation of tissue-associated SIV viral loads was performed as described (19).
Immunofluorescence Staining and Quantitative Image Analysis
Two-color immunofluorescence staining was performed by incubating tissue sections simultaneously with either anti-FOXP3 (Abcam) or anti-Ki67 (DAKO) antibodies at a 1:50 dilution along with anti-CD3 (DAKO) antibody at a 1:100 dilution, subsequently incubating with fluorescein- and biotin-SP- (Jackson ImmunoResearch Laboratories) conjugated secondary antibodies, followed by the tertiary conjugates Alexa Fluor 488 anti-FITC and Alexa Fluor 647 streptavidin (Molecular Probes). Following signal intensification of the FITC signal (Molecular Probes) and nuclear staining with Sytox Orange (Molecular Probes), sections were treated with Autofluorescence Eliminator (Chemicon International) before mounting with Prolong Gold Antifade (Molecular Probes). Laser scanning confocal microscopy was performed with an Olympus FluoView 500 confocal microscope through a 40X objective, and images were obtained from sections simultaneously stained for Ki67 and CD3, or FOXP3 and CD3. Five random images were obtained throughout each section stained for Ki67 and CD3, and five random images were taken specifically from the paracortex of each section stained for FOXP3 and CD3. Quantitative image analysis was performed on these images using the MetaMorph software package (Molecular Devices, Sunnyvale, CA). A journal was written and used to open each image, separate the fluorophore-specific signals, and then change the images to monochrome. Background shading and correction was used to flatten the background of the image of all nuclei stained with Sytox Orange, and then auto-thresholding was performed for light objects. A low pass filter was applied and the image was manually thresholded, binarized, and segmented. The image that contained cells stained with FITC (Ki67 or FOXP3) was also subjected to flatten background, low pass filter, and thresholding actions. The “holes” morphological filter was used to fill dark holes in the centers of cells. The images containing cells stained with Cy5 (CD3) was subjected to the same operations at the FITC images with an additional binary operation added at the end to erode the image. We then used arithmetic AND-minimum functions to combine the images to count all cells and singly and doubly stained cells. Integrated morphometry analysis was used to count the individual Ki67+, FOXP3+, or CD3+ positive cells, and double positive cells (Ki67+/CD3+ or FOXP3+/CD3+) for each image. Ki67+/CD3+ cell or FOXP3+/CD3+ percentages were calculated from five images.
Immunohistochemistry and Immunocytochemistry
Immunohistochemical staining of LN tissue sections was performed as described (8, 19), using goat anti-CCR4 polyclonal antiserum (Abcam Inc., Cambridge, MA), or preimmune control serum (BD Biosciences). After washing in PBS twice, tissue sections were incubated with HRP-conjugated secondary antibody (Zymed Laboratories) for 15 min, and 3,3′-diaminobenzidine substrate in tris-buffer was used for the detection of CCR4+ cells. Immunocytochemistry was performed for detection of FOXP3 in cells spotted onto microscope slides after in vitro chemotaxis. The cells examined by chemotaxis were uninfected cynomolgus macaque LN cells that migrated in response to chemokines (Peprotech) using an established chemotaxis assay (21). Spotted cells were stained with an anti-FOXP3 monoclonal antibody (Abcam, clone 234A/E7). The numbers of FOXP3+ cells were determined by counting total and FOXP3+cells in five low powered microscopic fields (x200).
Generation of Macaque Lymphoid Tissue Single Cell Suspensions
Lymphoid tissues from cynomolgus macaques were minced in digestion medium (RPMI-1640) containing DNAse I (20 mg/ml; Sigma-Aldrich) and collagenase A (1 mg/ml; Roche) for 60 min at 37°C, passed through a 100-μm cell strainer and pelleted by centrifugation at 1200 rpm for 5 min. The pellet was resuspended in 1x RBC lysing solution (155 mM NH4Cl, 10 mMNaHCO3, 0.1 mM EDTA; pH 7.4) for 5 min and centrifuged again for 1200 rpm for 5 min. The resulting cell pellet was resuspended in 1x PBS, counted on a hemacytometer, and aliquots of cell suspensions were frozen in freezing medium (90% FCS, 10% DMSO) and stored in liquid nitrogen. Gently thawed cells were exposed to recombinant IFN-γ (50ng/ml, R&D Systems), SIVmac251 (2 × 10³ TCID50 [50% tissue culture infectious dose]), or medium alone and total RNAs were isolated at 24 or 48 h later. Real-time RT-PCR was performed to measure chemokine or chemokine receptor mRNA levels as described (19).
Flow Cytometric Analysis
Anti-human monoclonal antibodies were pre-screened using multiple clonal and flourochrometric combinations, and selected on their ability to optimally discriminate antigenic expression by cynomolgus macaque LN cells. Live T cells were identified through successive gating strategies based on size and viability utilizing the blue LiveDead apoptotic stain (Molecular Probes/Invitrogen, Carlsbad, CA). Immunophenotyping of extracellular Treg markers and chemokine receptors was performed on single cell LN suspensions utilizing the following antibodies (purchased from BD Pharmingen, San Diego, CA unless otherwise noted): CD3-Pacific Blue (SP34-2), CD4-AmCyan (L200, NIH Nonhuman Primate Reagent Resource Program, Boston, MA.), CD8-APC-Cy7 (RPA-T8), CD25-PE-Cy7 (M-A251) and CXCR3-PE (1C6/CXCR3), CCR4-PE (1G1), CCR6-PE (11A9), and CCR7-PE (150503, R&D Systems). Cryopreserved cells were thawed, washed, and stained for surface markers for 1 hr at 4°C. Fixation and intracellular staining was performed with BD Fix/Perm reagent kits according to the BD protocol. Upon permeablization, cells were stained intracellularly for FoxP3-FITC (236A/E7, eBioscience, San Diego, CA) for 1 hour at 4°C. Appropriate isotype controls were included in all experiments. Data acquisition was performed on a LSRII cytometer housed at the University of Pittsburgh's Center for Vaccine Research with a minimum of 200,000 events collected from each sample. Data were analyzed using BD FACSDiva software (BD Biosciences).
Cell Transfection and Chemotaxis Assays
A human CCR4 cDNA in the pcDNA3.1 vector was obtained from The University of Missouri cDNA Resource Center. Cell transfections were performed as described previously (21). Briefly, the L1.2 murine pre-B cell line was electroporated with pcDNA3.1 (Invitrogen) expressing human CCR4, and stably transfected cells were obtained after selection with 1mg/ml G418 (Sigma). Chemotaxis was performed against CCL17 (10μM) with or without co-incubation with CXCL11 or CXCL8 (100μM each). The 96-well ChemoTx chemotaxis system (NeuroProbe Inc., 5μm pore) was used for these chemotaxis assays and chemokines were from Peprotech Inc. The lower wells were blocked with 31 μL of RPMI-1640 /1% BSA for 30 min at room temperature, which was aspirated and replaced with 31 μl of the agonists, which were diluted in RPMI-1640/0.1% BSA. Then 2 × 10⁵ CCR4 stably transfected L1.2 cells in 20ul RPMI-1640/0.1% BSA were loaded above the membrane. After incubation for 5 h at 37°C, 5% CO2, the cells on top of the membrane were removed with a scraper and the migrated cells in the bottom wells were counted using a hemacytometer. Chemotaxis with macaque LN cells was performed in the same way, but with 1.5 hr incubation during migration.
Statistical Analyses
All statistical analyses were performed using the Minitab software package (State College, PA). Real-time RT-PCR data were analyzed using the two sample t-test to compare differences between disease states and Pearson's correlation analyses were used to measure associations between relative mRNA expression levels. Paired t-tests were used to examine the chemotaxis inhibition data. A p-value of <0.05 was considered significant.
Results
To determine whether pathogenic SIV infection affects Treg proportions in lymphoid tissues, we used a cynomolgus macaque (Macaca fascicularis) model and examined tissues at different stages after intrarectal infection with the pathogenic SIV/DeltaB670 isolate (18). Axillary LNs were examined from acutely infected (2wk post-infection [PI]) and AIDS-developing (defined by decreasing CD4 counts, opportunistic infections, and wasting) animals, as well as uninfected controls (Table 1). As FOXP3 is considered to be a highly specific marker for Treg (3), changes in its expression were measured at the RNA and protein levels. FOXP3 mRNA levels in LNs were decreased both early and late after SIV infection (Fig. 1A). Immunofluorescence staining for FOXP3+ cells in LN tissue sections also revealed a 60-70% decrease in the proportion of cells that were FOXP3+ after SIV infection (Fig. 1 B and C),which was highly correlated with the mRNA measurements (r=0.721, P=0.008). Additionally, flow cytometric analyses of LN single cell suspensions confirmed an approximately 50% decrease in the FOXP3+ proportion of total live cells following SIV infection (Fig. 1D). These findings indicate there was a loss of FOXP3+ Treg in LNs after pathogenic SIV infection of cynomolgus macaques.
Table 1.
Study animals and clinicovirologic states
| Animal | Stage | Virus* | Wk PI | Plasma viral load† (copies/ml) | Axillary LN viral load‡ | Clinical State |
|---|---|---|---|---|---|---|
| M5602 | Uninfected | None | 0 | ND§ | <0.01 | No Clinical Symptoms |
| M6202 | Uninfected | None | 0 | ND | <0.01 | No Clinical Symptoms |
| M6802 | Uninfected | None | 0 | ND | <0.01 | No Clinical Symptoms |
| M7102 | Uninfected | None | 0 | ND | <0.01 | No Clinical Symptoms |
| M13402 | Uninfected | None | 0 | ND | <0.01 | No Clinical Symptoms |
| M13502 | Uninfected | None | 0 | ND | <0.01 | No Clinical Symptoms |
| M7802¶ | Exposed/uninfected | SIV‖ | 2 | <10 | <0.01 | No Clinical Symptoms |
| M6002 | Acute infection | SIV | 2 | 2,600,000 | 76.9 | No Clinical Symptoms |
| M7902 | Acute infection | SIV | 2 | 3,100,000 | 56.3 | No Clinical Symptoms |
| M8002 | Acute infection | SIV | 2 | 1,450,000 | 7.6 | No Clinical Symptoms |
| M13202 | Acute infection | SIV | 2 | 41,300,000 | 6.6 | No Clinical Symptoms |
| M19102 | Acute infection | SIV | 2 | 380,000,000 | 28.2 | No Clinical Symptoms |
| M5802 | AIDS | SIV | 49 | 1,950,000 | 17.8 | Weight loss, CD4+T cell loss |
| M6302 | AIDS | SIV | 80 | <10** | 12.3 | CD4+T cell loss |
| M7002 | AIDS | SIV | 48 | 640,000 | 15.3 | Weight loss, CD4+T cell loss, diarrhea |
| M7602 | AIDS | SIV | 84 | 36,000 | 3.6 | Anorexia, diarrhea, epistaxis |
| M12402 | AIDS | SIV | 42 | 50,500 | 3.5 | Weight loss, CD4+T cell loss, PCP†† |
Intrarectal inoculation.
Real-time RT-PCR was used to determine plasma viral loads at necropsy.
Real-time RT-PCR was used to determine tissue-associated viral loads, with normalization to the copy numbers of β2m mRNA (x 1,000).
ND, not determined.
SIV was not detectable in plasma nor in axillary LN samples for this animal.
SIV is SIV/DeltaB670
Despite repeating the assay twice, viral RNA was unexpectedly not detected in this plasma sample.
PCP, P. carinii pneumonia.
FIGURE 1.

Changes in FOXP3 and cytokine levels in LN tissues during SIV infection of cynomolgus macaques. A, Real-time RT-PCR was used for measurement of FOXP3 mRNA in LN tissues from uninfected macaques or macaques in the early (Acute) or late (AIDS) stages of disease (mean ± SEM). Immunofluorescence staining was performed to detect (C; x400) and quantitate (B) FOXP3+ cells in axillary LN tissue sections. D, Flow cytometry was used to detect and quantitate the percentage of total, live cells that expressed FOXP3+ in the same LNs. E, F, H, and I, The relative levels of expression of the indicated mRNAs in macaque axillary LNs were examined by real-time RT-PCR (mean ± SEM). G, Linear regression of FOXP3 mRNA levels versus TGF-β mRNA levels is shown. J, Quantitative image analysis was performed on images from LN tissue sections immunostained simultaneously for CD3 and the proliferation marker Ki67 and the percentages of CD3+ cells that were also Ki67+ are shown. *P<0.05 and **P<0.01, compared to uninfected animals.
The cytokine TGF- β1 is expressed by Treg, acts in concert with IL-2 in the differentiation and survival of inducible Treg (4), and suppresses IFN-γ expression (22). Measurement of TGF-β1 and IL-2 mRNA levels in macaque LNs indicated that they also were decreased following SIV infection (Fig. 1 E and F), and were highly correlated with FOXP3 levels (Fig. 1 G, r=0.91). Decreased expression of TGF-β1 and IL-2 could contribute to the reduction in FOXP3+ Treg levels in LNs during SIV infection by reducing differentiation of naïve T cells into inducible Treg. Although there were decreases in FOXP3, TGF-β1, and IL-10 (data not shown) expression, another immunosuppressive element, indoleamine 2,3-dioxygenase (IDO) was significantly increased after SIV infection, as was IFN-γ, an upstream inducer of IDO (23)(Fig. 1 H and I). This is consistent with reports that IDO is increased in tonsils of HIV-1-infected patients (24) and LNs of SIV-infected rhesus macaques (16).
Loss of Treg would be expected to lead to increased immune activation and this was observed. Immunofluorescence detection and enumeration of CD3+ cells also positive for the proliferation marker Ki67 in macaque LNs revealed that the percentage of CD3+ cells that were also Ki67+ increased 3-5 fold after SIV infection (Fig. 1J). Overall proportions of Ki67+ cells were also significantly increased after SIV infection (data not shown). These data indicated that T cell activation levels increased concordantly with loss of Treg.
Human Treg highly express CCR4 (7) and CCR7 (5), and thus their ligands, CCL17 and CCL21, could modulate homing of Treg to lymphoid tissues. Measurement of mRNA levels of these and other chemokines in macaque LNs revealed that mRNAs encoding ligands for CCR4 (CCL17 and CCL22) and CCR7 (CCL21) decreased (Fig. 2A-C) following SIV infection, whereas mRNAs encoding IFN-γ-inducible CXCR3 ligands (CXCL9-11) increased (Fig. 2D-F). The expression levels of the cognate chemokine receptors changed in parallel with their respective ligands (Fig. 2G-I). The changes in CCR4 and CXCR3 ligand expression were likely driven by the increased IFN-γ levels (Fig. 1I), because ex vivo treatment of macaque LN cells with IFN-γ led to simultaneous induction of CXCR3 ligands and decrease of CCR4 ligands (Fig. 2 J and K). Correlation analyses revealed that in LNs, levels of CCL17 and CCL22 were positively correlated with those of their receptor, CCR4 (r=0.761 and r=0.736, respectively), and levels of CCL21 were positively correlated with CCR7 (r=0.646). In situ hybridization and immunostaining of tissue sections confirmed these changes in chemokine and chemokine receptor expression primarily in paracortical regions (Fig. 3).
FIGURE 2.

Changes in the relative expression levels of chemokine and chemokine receptor mRNAs during pathogenic SIV infection. A-I, Real-time RT-PCR was used to measure the levels of expression of the indicated mRNA in LNs from animals in the same disease states as described in the legend to Figure 1. J and K, The effects of IFN-γ treatment of cynomolgus macaque primary LN cells on mRNAs encoding ligands for CXCR3 and CCR4 were measured using real-time RT-PCR. The mean (± SEM) values are shown from analyses performed on cells from three different animal. *P<0.05, **P<0.01.
FIGURE 3.
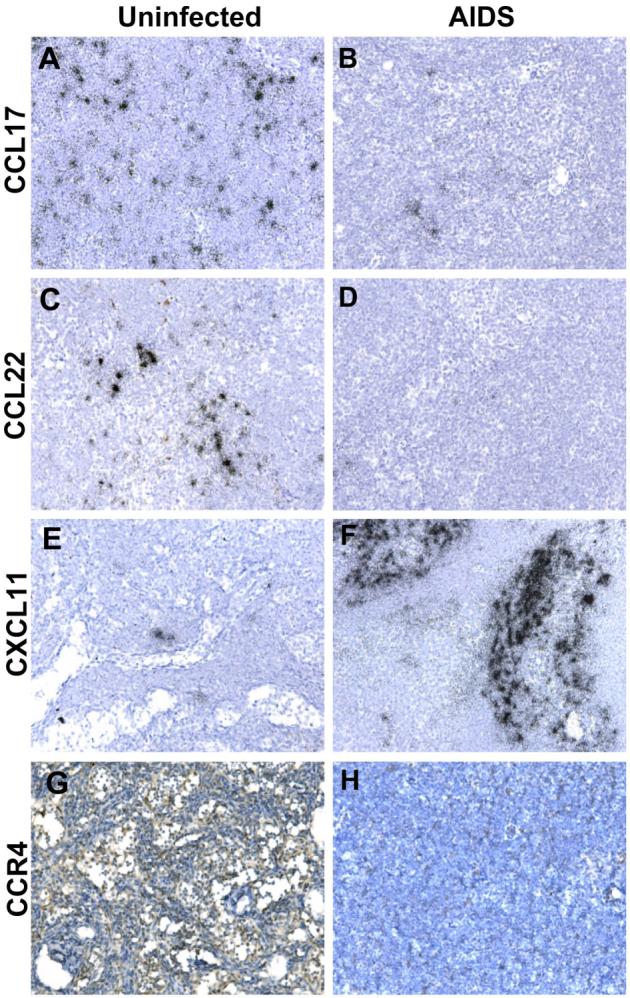
In situ detection of chemokine and chemokine receptor levels in axillary LN tissue sections from SIV-infected and uninfected cynomolgus macaques. A-F, In situ hybridization was performed for the indicated chemokine mRNA in axillary LN tissue sections from uninfected or AIDS-developing macaques. Parallel hybridization of tissue sections with the cognate sense control probe provided no specific ISH signal (not shown). Immunhistochemical staining was performed with a polyclonal antiserum for CCR4 (G) or with control antiserum (H). Original magnifications, x200.
More extensive correlation analyses revealed that FOXP3 mRNA levels were positively correlated with CCL22 (r=0.627) and CCL21 (r=0.682) levels (Fig. 4 A and B), and their cognate receptors CCR4 (r=0.493) and CCR7 (r=0.745), respectively, but negatively correlated with CXCL9 (r=-0.615), CXCL10 (r=-0.552), CXCL11 (r=-0.584) levels (Fig. 4C-E) and local SIV viral RNA loads (r=-0.735). These findings indicate that loss of Treg in macaque LNs during SIV infection is associated with multiple changes in chemokine, cytokine and SIV levels.
FIGURE 4.

Association between CXCR3 ligand and CCR4 ligand expression and function, and FOXP3 levels in macaque LNs. Linear (A and B) and nonlinear (C-E) regression analysis plots of FOXP3 mRNA versus the indicated chemokine mRNA levels are shown. F, Flow cytometry was used to detect chemokine receptor expression on Live+CD3+CD4+FOXP3+ axillary LN cells from uninfected (N=5) cynomolgus macaques. G, Axillary LN cells from uninfected macaques (N=4 macaques) were subjected to chemotaxis to the indicated chemokines and immunocytochemical staining for FOXP3+ was performed on the migrated cells. The chemotactic indices were calculated as the fraction of FOXP+ cells in the migrated population relative to the input cells. *P<0.05, **P<0.01. H, The migration of cells stably expressing CCR4 in response to CCL17 (10nM) or CCL22 (10nM) was examined in the presence or absence of 1μM of CXCL11 or CXCL8 antagonist. The percentage of cells migrating was calculated relative to migration toward CCL17 or CCL22 alone. The data represent the mean ± SEM of four independent experiments. **P<0.01, compared to agonist alone. I, The percentages of Live+CD3+CD4+FOXP3+ cells expressing either CXCR3 or CCR4, as determined by flow cytometry, are shown as a function of disease state.
Given that CCR4 and CCR7 are expressed by a large proportion of Treg (7) and have been shown to be important in Treg homing to LN and other tissues (5, 6), we used flow cytometry to examine their expression on FOXP3+ cells in uninfected macaque LNs, the strategy of which is outlined in Fig. 5. Approximately 25% of CD3+CD4+FOXP3+ cells expressed CCR4 or CCR7(Fig. 4F), whereas 35% expressed CXCR3 and 10% expressed CCR6. To determine whether CCL17, CCL21, and CXCL11 recruit FOXP3+ cells via CCR4, CCR7, and CXCR3, respectively, we performed chemotaxis with uninfected macaque LN cells. Immunostaining of FOXP3 in the input and migrated cells revealed that CCL17 and CCL21 recruited a population of cells that had a greater proportion of FOXP3+ cells than that recruited by CXCL11 (Fig. 4G), despite clear expression of CXCR3 (Fig. 4F). The lack of recruitment by CXCL11 could represent the net effect of positive and negative signaling through different receptors or possibly uncoupling of CXCR3 at the intracellular interface (25). These chemotactic data support the interpretation that CCL17 and CCL21 contribute to homing of FOXP3 +Treg into LNs and the reduced expression of these chemokines (Fig. 2) could contribute to loss or redistribution of FOXP3+ cells after SIV infection.
FIGURE 5.
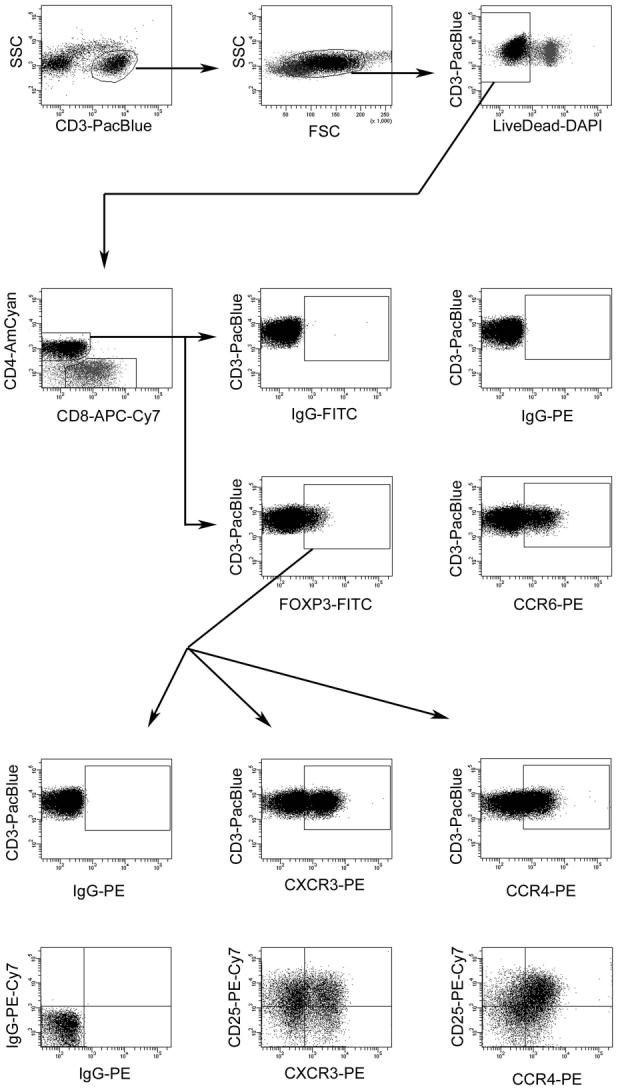
Flow cytometric gating strategy used to measure chemokine receptor expression on macaque FOXP3+CD4+ T-lymphocytes. Shown is the successive gating strategy used to ultimately visualize chemokine receptor levels on cynomolgus macaque LN Treg. Details are described in the Materials and Methods section.
Given that ligands for CXCR3 antagonize the type 2 chemokine receptor CCR3 (26) and are upregulated during SIV infection (Fig. 2), we examined whether a CXCR3 ligand would antagonize the type 2 and Treg chemokine receptor, CCR4. The migration of cells stably expressing CCR4 in response to CCL17 or CCL22 was inhibited by a 100-fold excess of CXCL11 (Fig. 4H), whereas 100-fold excess of the CXCR2 ligand, CXCL8, did not antagonize CCR4. CXCL11 alone did not induce chemotaxis of the CCR4+ cells (data not shown). Therefore, simultaneous antagonism of CCR4 by increased CXCR3 ligand expression and loss of CCR4 ligand expression could contribute to reduced homing of FOXP3+ cells to LNs during SIV infection. The nonlinear, negative correlations between CXCR3 ligand and FOXP3 levels (Fig. 4C-E) indicate that even moderate changes in CXCR3 ligand expression likely have potent inhibitory effects on homing of FOXP3+ Treg to LNs. Finally, consistent with the antagonism of CCR4 by CXCR3 ligands, the proportion of Treg expressing CCR4 in macaque LNs decreased during the course of SIV infection (Fig. 4I).
Discussion
In the present study we found that FOXP3+ cells are lost early during pathogenic SIV infection and with loss evident also during AIDS, which is consistent with recent findings in rhesus macaques (15). This loss of Treg was correlated with increased levels of local cellular activation and could be a key mechanism in the cumulative loss of immune function culminating in AIDS. In addition, we have identified multiple chemokine and cytokine mediated mechanisms that can account for the loss in Treg in SIV-infected macaques.
In contrast to our findings, other recent studies have reported that rhesus macaques acutely and chronically infected with SIVmac251 (16, 17) and humans infected with HIV-1(17, 24) had increased FOXP3+ Treg levels and TGF-β1 expression in lymphoid tissues. These differences could be due to the different macaque species studied, different SIV strains inoculated and different SIV inoculation routes, although our preliminary examination of rhesus macaque LNs following SIV/DeltaB670 infection also revealed a loss of Treg (data not shown). Another explanation might be due to variation in the timing of the contraction and/or expansion of Treg frequencies, as shown by Pereira et al. (15) in longitudinal studies of SIVmac239 infected rhesus macaques. In this study, the proportion of Treg among CD4+ T cells decreased in LN and intestinal tissues of SIVmac239 infected rhesus macaques, but not in naturally infected sootey mangabey monkeys. Perhaps there are multiple avenues leading to development of AIDS, and during HIV-1 or SIV infection loss of Treg or expansion of Treg could represent separate paths that both ultimately contribute to development of immunodeficiency when threshold levels are crossed. Loss of Treg would lead to T cell hyperactivation and enhance HIV-1 and SIV replication and activation-associated cell death, whereas expansion of Treg could lead to suppression of HIV-1-specific and other immune responses.
In this study we have identified multiple, previously unrecognized mechanisms for the loss of Treg during pathogenic SIV infection of cynomolgus macaques. Given that we found FOXP3 mRNA and protein levels decreased in LNs during SIV infection, and FOXP3 mRNA levels were negatively correlated with local SIV viral loads, SIV infection has a role in the decline in Treg in macaque LNs, perhaps through infection of these cells (27). In addition, our findings support three additional mechanisms contributing to this SIV-driven loss of Treg, which are outlined schematically in Figure 6. First, reduced levels of TGF-β1 and IL-2 will lead to fewer naïve T cells being differentiated into inducible Treg (4). Second, reduced levels of CCR4 and CCR7 ligands, associated with increased IFN-γ levels, will lead to decreased recruitment of CCR4+ and/or CCR7+ Treg into lymphoid tissues. Finally, potent upregulation of CXCR3 ligand expression will provide abundant natural CCR4 antagonists that will also reduce recruitment of CCR4+cells, including Treg. The intriguing sensitivity of FOXP3 levels to CXCR3 ligand levels as observed through regression analyses, supports their central role in loss of Treg in macaque LNs. The increase of IFN-γ as an upstream regulator of CXCR3 ligand expression and the decrease in TGF-β1 as an upstream regulator of IFN-γ expression (22) reveal a complex set of interrelationships that control multiple positive and negative feedback systems.
FIGURE 6.
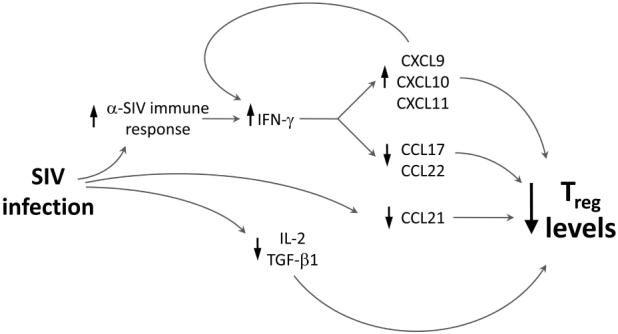
Model for chemokine and cytokine mediated loss of Treg in macaque LNs. Shown schematically are the relationships between IFN-γ-driven changes in CXCR3 and CCR4 ligand expression and IL-2/TGF-β1 driven differentiation of Treg on overall Treg levels in LNs following SIV infection, as detailed in the Discussion section. The arrows pointing up or down next to each component indicate the positive or negative effects of upstream players on the levels of the component.
Decline in Treg numbers in LNs during SIV infection would reduce suppression of conventional T cells, contribute to their activation, and thereby provide enhanced opportunities for HIV-1 and SIV replication by modulating the composition and availability of cellular substrates. One hallmark of HIV-1 infection is immune activation (28), and loss of Treg, and TGF-β1 and IL-10 expression, offer mechanisms by which this might occur. Nonpathogenic SIV infections in African green monkeys (13, 29) and sootey mangabeys have been shown not to increase cellular activation despite substantial viral replication. Consistent with our findings linking loss of Treg with increased immune activation during pathogenic SIV infection, naturally infected nonhuman primates do not show a loss of Treg (15). Increased activation in pathogenic SIV infections will provide cellular substrates and an environment that will sustain viral replication and lead to greater loss of immune function through direct and indirect killing as well as activation-induced cell death. Our data indicate that T cell activation levels increased concordantly with loss of Treg, consistent with the role of Treg in balancing overall local levels of cellular activation. In addition, another disease outcome likely linked to loss of Treg is the reported increase in susceptibility to autoimmune and inflammatory diseases in some HIV-1 infected individuals (30). Overall, our findings have revealed a complex set of changes in chemokine and cytokine expression during pathogenic SIV infection that lead to concomitant loss of Treg. Modulating the trafficking, induction, or survival of these cells through strategies targeting chemokine receptors or retinoic acid pathways (31) might represent new approaches for treating HIV-1 infected individuals.
Acknowledgements
We thank Dr. Ronald Desrosiers and the NIH AIDS Research and Reference Reagent Repository for the SIVmac251, Dr. Velpandi Ayyavoo for critically reading the manuscript, Dr. Ashley Haase for insightful discussion and sharing advice on FOXP3 staining of tissue sections, and Melanie Pfeifer for assistance with generation of macaque LN single cell suspensions.
This work was supported by PHS grants AI060422 (TAR), HL072682 (DEK), and U54 RR02241 (SCW).
Abbreviations used in this paper
- Treg
regulatory T cells
- FOXP3
Forkhead Box Protein P3
- IL-2
interleukin-2
Footnotes
Disclosures The authors have no financial conflict of interest.
References
- 1.Sakaguchi S, Ono M, Setoguchi R, Yagi H, Hori S, Fehervari Z, Shimizu J, Takahashi T, Nomura T. Foxp3+ CD25+ CD4+ natural regulatory T cells in dominant self-tolerance and autoimmune disease. Immunol. Rev. 2006;212:8–27. doi: 10.1111/j.0105-2896.2006.00427.x. [DOI] [PubMed] [Google Scholar]
- 2.Suvas S, Kumaraguru U, Pack CD, Lee S, Rouse BT. CD4+CD25+ T cells regulate virus-specific primary and memory CD8+ T cell responses. J. Exp. Med. 2003;198:889–901. doi: 10.1084/jem.20030171. [DOI] [PMC free article] [PubMed] [Google Scholar]
- 3.Hori S, Nomura T, Sakaguchi S. Control of regulatory T cell development by the transcription factor Foxp3. Science. 2003;299:1057–1061. [PubMed] [Google Scholar]
- 4.Zheng SG, Wang J, Wang P, Gray JD, Horwitz DA. IL-2 is essential for TGF-beta to convert naive CD4+CD25- cells to CD25+Foxp3+ regulatory T cells and for expansion of these cells. J. Immunol. 2007;178:2018–2027. doi: 10.4049/jimmunol.178.4.2018. [DOI] [PubMed] [Google Scholar]
- 5.Schneider MA, Meingassner JG, Lipp M, Moore HD, Rot A. CCR7 is required for the in vivo function of CD4+ CD25+ regulatory T cells. J. Exp. Med. 2007;204:735–745. doi: 10.1084/jem.20061405. [DOI] [PMC free article] [PubMed] [Google Scholar]
- 6.Sather BD, Treuting P, Perdue N, Miazgowicz M, Fontenot JD, Rudensky AY, Campbell DJ. Altering the distribution of Foxp3(+) regulatory T cells results in tissue-specific inflammatory disease. J. Exp. Med. 2007;204:1335–1347. doi: 10.1084/jem.20070081. [DOI] [PMC free article] [PubMed] [Google Scholar]
- 7.Lim HW, Broxmeyer HE, Kim CH. Regulation of trafficking receptor expression in human forkhead box P3+ regulatory T cells. J. Immunol. 2006;177:840–851. doi: 10.4049/jimmunol.177.2.840. [DOI] [PubMed] [Google Scholar]
- 8.Reinhart TA, Fallert BA, Pfeifer ME, Sanghavi S, Capuano S, III, Rajakumar P, Murphey-Corb M, Day R, Fuller CL, Schaefer TM. Increased expression of the inflammatory chemokine CXC chemokine ligand 9/monokine induced by interferon-gamma in lymphoid tissues of rhesus macaques during simian immunodeficiency virus infection and acquired immunodeficiency syndrome. Blood. 2002;99:3119–3128. doi: 10.1182/blood.v99.9.3119. [DOI] [PubMed] [Google Scholar]
- 9.LaFranco-Scheuch L, Abel K, Makori N, Rothaeusler K, Miller CJ. High beta-chemokine expression levels in lymphoid tissues of simian/human immunodeficiency virus 89.6-vaccinated rhesus macaques are associated with uncontrolled replication of simian immunodeficiency virus challenge inoculum. J. Virol. 2004;78:6399–6408. doi: 10.1128/JVI.78.12.6399-6408.2004. [DOI] [PMC free article] [PubMed] [Google Scholar]
- 10.Grossman Z, Meier-Schellersheim M, Sousa AE, Victorino RMM, Paul WE. CD4(+) T-cell depletion in HIV infection: Are we closer to understanding the cause? Nature Medicine. 2002;8:319–323. doi: 10.1038/nm0402-319. [DOI] [PubMed] [Google Scholar]
- 11.Sempere JM, Soriano V, Benito JM. T regulatory cells and HIV infection. AIDS Rev. 2007;9:54–60. [PubMed] [Google Scholar]
- 12.Rouse BT, Sarangi PP, Suvas S. Regulatory T cells in virus infections. Immunol. Rev. 2006;212:272–286. doi: 10.1111/j.0105-2896.2006.00412.x. [DOI] [PubMed] [Google Scholar]
- 13.Kornfeld C, Ploquin MJ, Pandrea I, Faye A, Onanga R, Apetrei C, Poaty-Mavoungou V, Rouquet P, Estaquier J, Mortara L, Desoutter JF, Butor C, Le Grand R, Roques P, Simon F, Barre-Sinoussi F, Diop OM, Muller-Trutwin MC. Antiinflammatory profiles during primary SIV infection in African green monkeys are associated with protection against AIDS. J. Clin. Invest. 2005;115:1082–1091. doi: 10.1172/JCI23006. [DOI] [PMC free article] [PubMed] [Google Scholar]
- 14.Eggena MP, Barugahare B, Jones N, Okello M, Mutalya S, Kityo C, Mugyenyi P, Cao H. Depletion of regulatory T cells in HIV infection is associated with immune activation. J. Immunol. 2005;174:4407–4414. doi: 10.4049/jimmunol.174.7.4407. [DOI] [PubMed] [Google Scholar]
- 15.Pereira LE, Villinger F, Onlamoon N, Bryan P, Cardona A, Pattanapanysat K, Mori K, Hagen S, Picker L, Ansari AA. Simian immunodeficiency virus (SIV) infection influences the level and function of regulatory T cells in SIV-infected rhesus macaques but not SIV-infected sooty mangabeys. J. Virol. 2007;81:4445–4456. doi: 10.1128/JVI.00026-07. [DOI] [PMC free article] [PubMed] [Google Scholar]
- 16.Estes JD, Li Q, Reynolds MR, Wietgrefe S, Duan L, Schacker T, Picker LJ, Watkins DI, Lifson JD, Reilly C, Carlis J, Haase AT. Premature induction of an immunosuppressive regulatory T cell response during acute simian immunodeficiency virus infection. J. Infect. Dis. 2006;193:703–712. doi: 10.1086/500368. [DOI] [PubMed] [Google Scholar]
- 17.Nilsson J, Boasso A, Velilla PA, Zhang R, Vaccari M, Franchini G, Shearer GM, Andersson J, Chougnet C. HIV-1-driven regulatory T-cell accumulation in lymphoid tissues is associated with disease progression in HIV/AIDS. Blood. 2006;108:3808–3817. doi: 10.1182/blood-2006-05-021576. [DOI] [PMC free article] [PubMed] [Google Scholar]
- 18.Murphey-Corb M, Martin LN, Rangan SR, Baskin GB, Gormus BJ, Wolf RH, Andes WA, West M, Montelaro RC. Isolation of an HTLV-III-related retrovirus from macaques with simian AIDS and its possible origin in asymptomatic mangabeys. Nature. 1986;321:435–437. doi: 10.1038/321435a0. [DOI] [PubMed] [Google Scholar]
- 19.Sanghavi SK, Reinhart TA. Increased expression of TLR3 in lymph nodes during simian immunodeficiency virus infection: implications for inflammation and immunodeficiency. J. Immunol. 2005;175:5314–5323. doi: 10.4049/jimmunol.175.8.5314. [DOI] [PubMed] [Google Scholar]
- 20.Godfrey TE, Kim SH, Chavira M, Ruff DW, Warren RS, Gray JW, Jensen RH. Quantitative mRNA expression analysis from formalin-fixed, paraffin-embedded tissues using 5′ nuclease quantitative reverse transcription-polymerase chain reaction. J. Mol. Diagn. 2000;2:84–91. doi: 10.1016/S1525-1578(10)60621-6. [DOI] [PMC free article] [PubMed] [Google Scholar]
- 21.Fox JM, Najarro P, Smith GL, Struyf S, Proost P, Pease JE. Structure/function relationships of CCR8 agonists and antagonists. Amino-terminal extension of CCL1 by a single amino acid generates a partial agonist. J. Biol. Chem. 2006;281:36652–36661. doi: 10.1074/jbc.M605584200. [DOI] [PubMed] [Google Scholar]
- 22.Lin JT, Martin SL, Xia L, Gorham JD. TGF-beta 1 uses distinct mechanisms to inhibit IFN-gamma expression in CD4+ T cells at priming and at recall: differential involvement of Stat4 and T-bet. J. Immunol. 2005;174:5950–5958. doi: 10.4049/jimmunol.174.10.5950. [DOI] [PubMed] [Google Scholar]
- 23.Sarkar SA, Wong R, Hackl SI, Moua O, Gill RG, Wiseman A, Davidson HW, Hutton JC. Induction of indoleamine 2,3-dioxygenase by interferon-gamma in human islets. Diabetes. 2007;56:72–79. doi: 10.2337/db06-0617. [DOI] [PubMed] [Google Scholar]
- 24.Andersson J, Boasso A, Nilsson J, Zhang R, Shire NJ, Lindback S, Shearer GM, Chougnet CA. The prevalence of regulatory T cells in lymphoid tissue is correlated with viral load in HIV-infected patients. J. Immunol. 2005;174:3143–3147. doi: 10.4049/jimmunol.174.6.3143. [DOI] [PubMed] [Google Scholar]
- 25.Thompson BD, Jin Y, Wu KH, Colvin RA, Luster AD, Birnbaumer L, Wu MX. Inhibition of G alpha i2 activation by G alpha i3 in CXCR3-mediated signaling. J. Biol. Chem. 2007;282:9547–9555. doi: 10.1074/jbc.M610931200. [DOI] [PMC free article] [PubMed] [Google Scholar]
- 26.Xanthou G, Duchesnes CE, Williams TJ, Pease JE. CCR3 functional responses are regulated by both CXCR3 and its ligands CXCL9, CXCL10 and CXCL11. Eur. J. Immunol. 2003;33:2241–2250. doi: 10.1002/eji.200323787. [DOI] [PubMed] [Google Scholar]
- 27.Oswald-Richter K, Grill SM, Shariat N, Leelawong M, Sundrud MS, Haas DW, Unutmaz D. HIV infection of naturally occurring and genetically reprogrammed human regulatory T-cells. Plos Biology. 2004;2:955–966. doi: 10.1371/journal.pbio.0020198. [DOI] [PMC free article] [PubMed] [Google Scholar]
- 28.Hazenberg MD, Otto SA, van Benthem BH, Roos MT, Coutinho RA, Lange JM, Hamann D, Prins M, Miedema F. Persistent immune activation in HIV-1 infection is associated with progression to AIDS. AIDS. 2003;17:1881–1888. doi: 10.1097/00002030-200309050-00006. [DOI] [PubMed] [Google Scholar]
- 29.Silvestri G, Sodora DL, Koup RA, Paiardini M, O'Neil SP, McClure HM, Staprans SI, Feinberg MB. Nonpathogenic SIV infection of sooty mangabeys is characterized by limited bystander immunopathology despite chronic high-level viremia. Immunity. 2003;18:441–452. doi: 10.1016/s1074-7613(03)00060-8. [DOI] [PubMed] [Google Scholar]
- 30.Zandman-Goddard G, Shoenfeld Y. HIV and autoimmunity. Autoimmun. Rev. 2002;1:329–337. doi: 10.1016/s1568-9972(02)00086-1. [DOI] [PubMed] [Google Scholar]
- 31.Coombes JL, Siddiqui KR, rancibia-Carcamo CV, Hall J, Sun CM, Belkaid Y, Powrie F. A functionally specialized population of mucosal CD103+ DCs induces Foxp3+ regulatory T cells via a TGF-beta and retinoic acid-dependent mechanism. J. Exp. Med. 2007;204:1757–1764. doi: 10.1084/jem.20070590. [DOI] [PMC free article] [PubMed] [Google Scholar]