

Abstract
It has been widely argued that the intraparietal sulcus (IPS) is involved in tasks that evoke representations of numerical magnitude, among other cognitive functions. However, the causal role of this parietal region in processing symbolic and non-symbolic numerosity has not been established. The current study used repetitive Transcranial Magnetic Stimulation (rTMS) to the left and right IPS to investigate the effects of temporary deactivations of these regions on the capacity to represent symbolic (Arabic numbers) and non-symbolic (arrays of dots) numerosities. We found that comparisons of both symbolic and non-symbolic numerosities were impaired after rTMS to the left IPS but enhanced by rTMS to the right IPS. A signature effect of numerical distance was also found: greater impairment (or lesser facilitation) when comparing numerosities of similar magnitude. The reverse pattern of impairment and enhancement was found in a control task that required judging an analogue stimulus property (ellipse orientation) but no numerosity judgements. No rTMS effects for the numerosity tasks were found when stimulating an area adjacent but distinct from the IPS, the left and right angular gyrus. These data suggest that left IPS is critical for processing symbolic and non-symbolic numerosity; this processing may thus depend on common neural mechanisms, which are distinct from mechanisms supporting the processing of analogue stimulus properties.
Keywords: Numerical cognition, rTMS, Parietal lobe, Numerosity, Distance effect
Introduction
Our ability to manipulate numerical quantities and specifically to compare them is a fundamental skill, by which we make sense of the external world (Butterworth 1999; Dehaene 1997). Usually we can quickly and accurately compare, for example, the price of two items in a shop, the weight of two bags, the height of two people. A central behavioral signature of numerical quantity processing, although not specific to it, is the distance effect: comparisons of one number to another number (e.g., 12 < 19) or to a sum (e.g., 12 < 8 + 11) are faster for more distant numbers (Moyer and Landauer 1967). This effect is usually explained by a comparison process operating on information retrieved from a continuous magnitude representation (Dehaene 1992). The closer the two numbers are on the continuum, the more their magnitude-related activation overlaps and the longer it takes to discriminate them (but see Verguts and Fias 2004; Zorzi et al. 2005 for alternative views on to the distance effect). Behavioral studies showed that distance effect occurs when processing continuous quantities (e.g., the weight of an object, “3.5 kg”, e.g., Johnson 1939) and numerosities (e.g., the number of things in a set, “three coins in the fountain”), expressed symbolically (e.g., as Arabic numbers, e.g., Moyer and Landauer 1967) or non-symbolically (e.g., as a set of dots, e.g., Feigenson et al. 2002; Xu and Spelke 2000; Xu 2000). This has been taken as evidence that a single set of mechanisms serves to represent both continuous quantities and numerosities expressed symbolically and non-symbolically (Dehaene et al. 2003; Gelman and Gallistel 2004; Fias et al. 2003).
Studies using functional Magnetic Resonance Imaging (fMRI) often reveal activation of regions of the parietal lobes, including the intraparietal sulcus (IPS) during comparisons of symbolic numerosities (Arabic numbers and number words), with evidence of the signature distance effect (Dehaene et al. 1999, 2003; Pinel et al. 2001; but see Göbel et al. 2004; Shuman and Kanwisher 2004). More recent imaging studies in humans and cell-recording in primates indicate that, besides comparison of symbolic stimuli, the parietal regions are also involved in quantity processing of non-symbolic numerosities in the form of dot displays (e.g., Castelli et al. 2006; Nieder et al. 2002; Nieder and Miller 2004; Piazza et al. 2004; Sawamura et al. 2002) as well as in comparisons of continuous quantities such as luminosity, angles' size, and line length (Faillenot et al. 1998; Fias et al. 2003; Fulbright et al. 2003; Kadosh et al. 2005; Pinel et al. 2004). The involvement of the parietal regions in numerical quantity processing has also been confirmed by electrophysiological studies showing either a unilateral left (Turconi et al. 2004) or right (Dehaene 1996; Pinel et al. 2001) distance effect on posterior parietal regions when processing numerical quantity. Studies of brain damaged patients provide further evidence of the role of the parietal regions in numerical quantity processing. These studies indicated that numerical processing is impaired following lesions to the parietal areas (e.g., Cipolotti et al. 1991; Dehaene and Cohen 1997; Lemer et al. 2003; Polk et al. 2001; Warrington 1982; Wood et al. 2006), whereas selectively spared numerical processing results from parietal regions being selectively spared (e.g., Cappelletti et al. 2001; Crutch and Warrington 2002; Thioux et al. 1998).
It is important to note that neither functional neuroimaging nor electrophysiological studies can establish a causal relationship between areas of observed brain activation and the corresponding behavioral task (Walsh and Pascual-Leone 2003). Trying to overcome these limitations by studying neuropsychological patients is not completely successful either, as lesion studies have inherent restrictions: brain lesions may lack focality, additional pathology is often present, and plastic brain changes are likely to shape behavioral deficits (Kolb and Whishaw 1998; Robertson et al. 2003; Walsh and Pascual-Leone 2003). Other modes of investigation are necessary to bridge the gap between correlation and causation. Transcranial magnetic stimulation could be a valuable technique in this regard, complementing neuropsychology and neuroimaging in that it allows researchers to study the effects of modulating cortical function in a non-invasive fashion (Walsh and Pascual-Leone 2003).
The TMS should be used successfully to investigate the contributions of different brain areas to behavior and cognition (Pascual-Leone et al. 2000; Walsh and Pascual-Leone 2003; Walsh and Rushworth 1999). In particular, a few studies have recently used TMS to investigate number processing. These studies explored the involvement of the parietal regions when comparing two-digit Arabic numbers (Göbel et al. 2001) or single digits following bilateral parietal stimulation at different times (Rusconi et al. 2005; Sandrini et al. 2004) or simultaneous (Andres et al. 2005), during parity judgments (e.g., do ‘3’ and ‘5’ have same or different parity? Rusconi et al. 2005), and number bisection tasks (i.e., the middle number between ‘758’ and ‘783’, Göbel et al. 2005). Most of these studies consistently showed that the left parietal areas are critical for number processing. Indeed a significant increase in response times followed rTMS, in some cases modulated by the distance effect (Andres et al. 2005). In addition, other studies showed that the right parietal regions are involved in tasks requiring bisection judgments (e.g. Göbel et al. 2006; Oliveri et al. 2004). There is, however, less consistent evidence on which areas within the parietal lobe are specifically critical for numerical quantity processing, i.e., whether it is the IPS (e.g. Andres et al. 2005) or the angular gyrus (AG) (Göbel et al. 2001, 2005; Rusconi et al. 2005). Most importantly, there is currently no information on whether the areas that are critical for symbolic quantity processing are also essential for performing tasks based on non-symbolic numerosities (e.g. in the form of dot arrays). Therefore our study aimed at extending previous studies using Transcranial repetitive TMS (rTMS) studies as we investigated the role of bilateral IPS on the processing of symbolic and non-symbolic numerosity. We used a frameless stereotactic system that can accurately localize a given anatomical area. In addition, we also used two types of control conditions for task and area respectively.
Current study
In the present study, we used rTMS on the cortical regions that are reliably activated by quantitative tasks in functional neuroimaging studies, i.e., left and right IPS. We aimed at: (1) testing whether reversible impairments to these regions have specific and distinctive effects on processing quantities that are presented symbolically (Experiment 1) versus non-symbolically (Experiment 2) and that were close versus distant from a fixed reference; (2) providing finer grained information on the role of the IPS on numerical quantity processing by contrasting stimulation to the IPS with another distinct but contiguous area in the parietal region, the angular gyrus.
We addressed these issues by applying low-frequency (1 Hz) repetitive transcranial stimulation over the parietal regions. Stimulation at 1 Hz has been shown to reduce blood flow and cortical excitability in the brain regions targeted by rTMS for several minutes after stimulation (Chen et al. 1997; Paus et al. 1997) and to impair performance on behavioral tasks depending on the regions stimulated (e.g., Romero et al. 2002; Theoret et al. 2001; Walsh and Pascual-Leone 2003). We had two main hypotheses: first, we reasoned that if the IPS regions are specifically critical for numerosity processing, performing number comparisons after rTMS should be delayed relative to sham stimulation, consistent with some previous studies; by contrast, if the IPS is engaged in numerosity processing but it is not critical for it, rTMS should not affect the subjects' performance. In addition, one finding that will be particularly indicative of impairment in numerical processing will be a TMS interference with numerical distance effect (Moyer and Landauer 1967). This would mean greater impairment following IPS stimulation when comparing stimuli that are closer in value (e.g., 62 < 65) relative to stimuli that are further apart (e.g., 42 < 65), in parallel to evidence from neuroimaging (e.g., Castelli et al. 2006; Dehaene 1996; Pinel et al. 2001, 2004) and from a TMS study using single-digit Arabic numbers (Andres et al. 2005). Moreover, we directly compared rTMS to the left and right IPS to test if they are equally critical for numerosity processing. Our second hypothesis explicitly tested whether numerosity processing is represented by a common mechanism for both symbolic and non-symbolic stimuli in the IPS, as suggested by imaging studies (Castelli et al. 2006; Dehaene et al. 2003; Fias et al. 2003).
In addition, we devised a control task (Experiment 3) to exclude the possibility that any TMS effect occurring on the left or right IPS was due to interference with attentional resources rather than with numerical processing, since the parietal regions have been shown to be involved in attention-based tasks (e.g., Culham and Kenwisher 2001; Wojciulik and Kanwisher 1999). In order to match this control task as closely as possible to the numerosity tasks, we used a non-numerosity categorical judgment task consisting of judging the orientation of ellipses. The ellipses were chosen to be either close or far away from a circle, and in a series of pilot studies we matched this control experiment with Experiments 1 and 2 in terms of difficulty, namely for RTs and accuracy. We reasoned that if TMS effects occurring on the IPS were due to interference with attention rather than with numerosity processes, a similar interference should occur when performing Experiment 3; conversely, if TMS effects occurring on the IPS were due to interference only with numerosity processes, no interference should result when performing Experiment 3.
Materials and methods
Participants
A total of 36 healthy right-handed volunteers with no history of neurological or psychiatric illness were recruited for this study after giving written informed consent. There were three different experiments, each involving a different group of 12 volunteers (Experiment 1: five males, mean = 19.41 ± 1.6. Experiment 2: four males, mean = 24.2 ± 5.8. Experiment 3: six males, mean = 24.8 ± 7.3). For Experiments 1 and 2, subjects were studied on two different days (from 1 to 5 days apart); for Experiment 3, subjects were studied on one day as only two brain regions were targeted. The study was approved by the institutional review board and performed in close adherence to TMS safety guidelines (Wasserman 1998).
Experimental design
In Experiments 1 and 2, participants were given real rTMS to four brain sites (the horizontal segment of the IPS or the AG of each hemisphere) or sham stimulation at a region located between the IPS and the AG on each side of the scalp. In Experiment 3, participants were given real or sham TMS to the left or right IPS. For 3–4 min after each stimulation period, participants viewed centrally-presented Arabic numbers (Experiment 1), displays of dots (Experiment 2), or ellipses varying in orientation (Experiment 3).
Stimuli and tasks
The experiments were performed using an Optiplex GX 400 Dell computer and the DMDX software package (Forster and Forster 2003). The viewing distance from the monitor was about 0.5 m. Stimuli for Experiment 1 were two-digit Arabic numbers (range: 31–99) centered on the computer screen: participants were asked to judge whether each stimulus was larger or smaller than ‘65’ (never presented). Arabic numbers were categorized as close to or far from the reference number 65 (far: 31–50; 80–99; close: 51–79) for the data analysis. Stimuli for Experiment 2 were a series of arrays of randomly placed dots varying in size (diameters 2–4 mm), display area (140 mm × 140 mm to 280 mm × 280 mm). There were two types of dot arrays. The first was the reference array consisting of 65 red dots; the second was the target array consisting of white dots that ranged between 31 and 99. Participants first saw the reference dot array for 200 ms followed by ten targets arrays. They were asked to indicate whether the dots in each target array were more or less numerous than those in the reference array of 65 dots. After the tenth target array was displayed and an answer was made, participants saw the reference array again. The target dot arrays covered a broad range of areas on the screen, and these varied independently of the numerosity of the arrays, while the positions of dots but not the overall array area changed upon each presentation of the reference array. Both the area covered by the dots on the screen and the size of the dots were not reliable cues to numerosity. Evidence from previous studies suggests that numerical information rather than continuous quantities is used to make non-symbolic numerosity judgments (Barth et al. 2005, 2006). Stimuli for Experiment 3 were a series of ellipses varying in position, orientation (vertical or horizontal) and elongation (diameter: 16–60 mm). Participants were asked to judge whether each ellipse was more elongated than a circle (never presented) on the vertical or horizontal dimension (Fig. 1). Pilot testing matched Experiments 2 and 3 as closely as possible for difficulty, namely in terms of RTs and accuracy.
Fig. 1.

The comparison tasks. a The experimental design was the same for all the experiments. b In each display one of the following stimuli was presented: Arabic numbers close and far from the reference number 65 (Experiment 1), dots close and far in number from a reference display containing 65 dots (Experiment 2), or ellipses close or far from a circle with vertical or horizontal elongation (Experiment 3). The top row of the figure shows an example of stimuli far from the reference, the bottom row stimuli close to the reference (pictured stimulus sizes are not to scale). c In addition to baseline (no TMS), each experiment was performed after real or sham TMS; these conditions were counterbalanced between subjects and each followed by a 30-minute-rest period
Subjects were instructed to press the spacebar in order to start the experiment. A crosshair then appeared at the center of the computer screen for 200 ms, followed by a stimulus for 200 ms in the same position and then by an inter-trial interval of 1,500 ms. The fixation point reappeared before each number was presented for 200 ms (see Fig. 1). Each block lasted ∼3.5 min. For each experimental session, subjects performed four (in Experiment 3) or six blocks (in Experiment 1 and 2) of 118 trials each, one for an initial baseline condition and one after each of the experimental treatments (right rTMS, left rTMS, and sham) for a total of 472 (in Experiment 3) or 708 stimuli (in Experiment 1 and 2). In each experiment, the order of displays appearing on the screen was pseudo-randomized within each block.
For each experiment, participants indicated their response by depressing a right or left key on the computer keyboard. Specifically, they were asked to indicate small stimuli (Arabic number or number of dots) or the horizontal orientation of ellipses by pressing a left key, and large stimuli (Arabic numbers or number of dots) or the vertical orientation of ellipses by pressing a right key. Responses to small and large stimuli and to horizontal and vertical orientations were each analyzed in terms of whether they were close to or far from the reference (i.e., 51–64, 66–79, and 31–50, 80–99, respectively). Therefore, as responses to close and far stimuli included an average of responses made with left and right keys, we did not examine the factor hand response mapping in our analysis.
TMS methods
In Experiments 1 and 2, six different stimulation sites were targeted with rTMS on two different days: two active and one sham stimulation on each day. In Experiment 3, three stimulation sites were targeted: two active and one sham stimulation in one day. To control for carryover effects, the order of the areas stimulated with rTMS was fully counterbalanced across subjects, with the restriction that each subject received one real left and one real right-sided stimulation session per day. TMS was applied to each site for 10 min after which participants were asked to perform the experimental task. Before subsequent application of real or sham TMS, participants had a 30 min rest period in order to decrease the possibility of TMS after-effect to a subsequent testing session (Fig. 1). We chose the wash-out period of 30 min because of previous data showing that stimulation of the motor cortex for 10 min results in a modulation of cortical excitability that lasts for less than 10 min in healthy subjects (Romero et al. 2002) and less than 10 min in stroke patients (Mansur et al. 2005).
In order to locate the site of stimulation accurately, we used a frameless stereotactic system (Brainsight software, Rogue Research, Montreal, Canada). This system allows the precise localization of anatomical areas using the MRI images of the participants. Prior to the experiment, a high-resolution T1-weighted MRI scan of the brain of each subject was obtained in order to locate the four target regions relative to external landmarks on the head (i.e., bridge and tip of the nose and the tragus of the ears that are visible on both the subject's MRI scan and on his/her head). The 3D location of these landmarks was registered using an optical tracking system. The optical-tracking systems use an infrared camera that can detect reflectors attached to the objects of interest (i.e., the coil and the subject's head, Paus 1999). Using this system we could monitor the coil position and orientation without restraining the subject's head during the TMS experiment.
The horizontal segment of the IPS was defined as middle part of the sulcus in the dorsal parietal lobe that intersects the postcentral sulcus (Ono et al. 1990). This is approximately the location where numerical quantity comparison has been found by Pinel et al. (2001). The AG was defined as the gyrus on the lateral surface of the parietal lobe curving around the posterior end of the superior temporal sulcus (Fig. 2).
Fig. 2.

Sites and targeting of rTMS and sham stimulation. In Experiments 1 and 2, all sites in (a) were tested over 2 days; in Experiment 3, the left and right IPS sites and one of the sham sites were tested in one day. The order of stimulation conditions was fully counterbalanced across subjects. In (b) is the illustration produced by the stereotactic system (Briansight) of the application of rTMS in a representative subject. Yellow lines illustrate an example of where each stimulus was applied during an entire 10 min rTMS train for each of the four stimulation positions. Green dots correspond to the point on the scalp where each TMS pulse was delivered. The stimulation coil rested tangentially on the subject's scalp and the handle pointing posteriorly parallel to the subject's midsagittal plane as calculated by the frameless stereotactic
For each participant, the anatomical determination was done some days before the TMS study on the basis of cortical surface plots constructed from the MRIs. rTMS was applied using a Magstim Rapid Rate stimulator (Magstim Company Ltd., UK) and a focal eight-shaped coil with wings each measuring 70 mm in diameter. One important matter in our methodology is the TMS focality since the two sites of stimulation were close to each other. In other words, if the resolution of TMS were poorer than the distance between these two sites of stimulation, then the results of our experiment would be biased. However, scalp-cortex distance for IPS and AG varies from 13.5 to 17.1 mm (see Stokes et al. 2005), and the primary stimulation site area, using a 8-shaped coil, is of a maximum of 56 × 44 mm and 41 × 31 mm (see Pascual-Leone et al. 2002, pp. 13–14). We are confident that the stimulation area of IPS did not overlap that of AG.
The rTMS was applied at 65% of the maximum output of the stimulator's machine at 1 Hz frequency for 10 min per session (total of 600 pulses). We used a fixed intensity of rTMS, i.e., 65% of the maximum output rather than an intensity based on the motor threshold, as the threshold in motor and non-motor cortical areas might be different (Robertson et al. 2003). The intensity and the recovery times were selected on the basis of previous TMS studies that have used 1 Hz in cognitive tasks in healthy subjects (e.g., Kosslyn et al. 1999) or in disrupting parietal regions' functions (e.g., Alexander et al. 2005; Ashbridge et al. 1997). Sham stimulation was produced by a specially designed coil (Magstim Company Ltd.) that has identical appearance and sound artifact when compared to the real coil. When explicitly asked, our subjects were unable to reliably discriminate between real and sham stimulation.
Data analysis
The proportion of errors and the mean reaction times (RT) were calculated for each subject in each condition. Response times below 200 ms (i.e., anticipatory responses) and above two standard deviations of the overall mean of each individual (i.e., delayed responses) were excluded from the data set following a procedure which is common practice in data analysis and in previous TMS studies (e.g., Martin et al. 2004; Naeser et al. 2005). Furthermore, using this approach, we decreased the likelihood that our results were driven by outliers as we used tests that assume normal data distribution. By using the above 2SD criterion, 4.4% of the data were excluded from the analysis, with no difference across conditions or sites [all P between < 0.8 and < 0.1]. We evaluated whether our data (i.e., RTs) were normally distributed using the Shapiro–Wilk test. This test revealed that there was no significant deviation from normality in any of the conditions [minimum W (24) 0.952, P = 0.30] and we therefore used statistical tests assuming normal distribution.
A 2 × 2 × 2 × 3 analysis of variance (ANOVA) with side (left, right), distance (stimuli far and close to the reference 65) and area (IPS, AG, and sham) as within-subject factors and experiment (comparison of Arabic numbers, comparison of dots) as between-subject factor was conducted on RTs of correct answers. The analysis aimed at: comparing the pattern of results in Experiment 1 and 2, testing for stimulation effects, and verifying whether these effects were modulated by numerical distance. In addition, an ANOVA was performed on RTs of correct answers of Experiment 3 with area (left IPS, right IPS, and sham) and distance (stimuli far and close to a circle) as factors (note that experiment 3 was not added in the initial ANOVA as only IPS was stimulated in this experiment). When appropriate, we performed post-hoc paired comparisons using student t-test and correcting the results for multiple comparisons using Bonferroni correction; the results of these comparisons are expressed as corrected P-value if not stated otherwise. For post-hoc comparisons, we compared real rTMS conditions against sham TMS, rather than real rTMS versus baseline, in order to control for practice and placebo effects. In addition, another two-way ANOVA (experiment: dots and ellipses, and distance: closer and far) compared the sham condition of the ellipses and the dot tasks to test whether they were comparable in difficulty and whether they showed a comparable distance effect. Finally, we performed an ANOVA and subsequent post-hoc comparisons to test whether the impairment following rTMS to the left IPS was greater than in the other three sites (right IPS and AG, and left AG) across Experiments 1 and 2, and whether the effects of the left IPS stimulation in Experiment 3 differed from that in Experiment 1 and 2, with ‘experiment’ as a between-subject factor.
Results
TMS did not affect the participants' accuracy in any of the tasks [all P > 0.10, see values reported in brackets on x-axis in Fig. 3]. This is consistent with other TMS studies showing that tasks performed at high-level of accuracy are likely to result in RT deficit rather than increase in error rate following TMS (Alexander et al. 2005; Ashbridge et al. 1997; this). As performance in the baseline condition may reflect learning effects or the subjects' adjustments to the experimental environment, we compared performance following TMS conditions with sham stimulation.
Fig. 3.
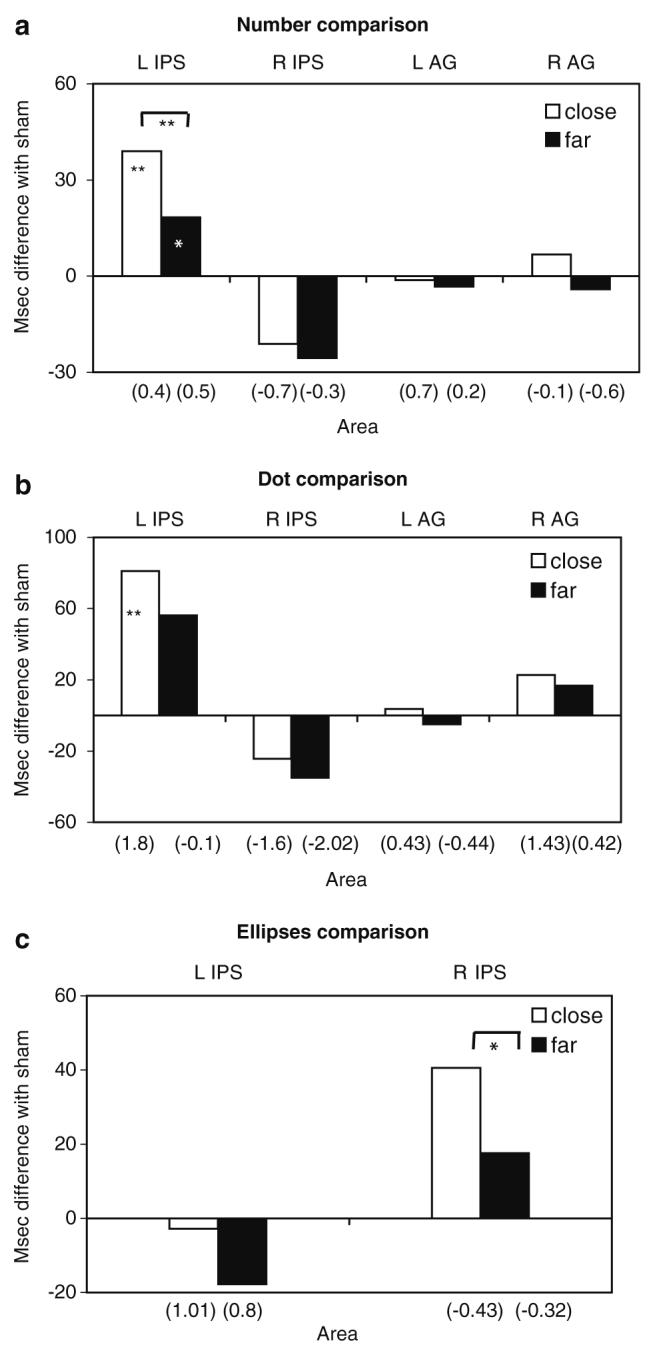
Performance impairments following rTMS. Bars indicate the mean of difference in response time, and numbers in parentheses indicate the mean of differences in error rates after rTMS relative to sham stimulation for close versus far comparisons for the experiments with (a) Arabic numbers, (b) dots, and (c) ellipses. rTMS conditions in which response times significantly differed from sham stimulation are indicated by asterisks inside the bars (*P < 0.05, **P < 0.01)
Experiments 1 and 2
A similar pattern of results emerged in Experiments 1 and 2 as there was no significant three-way interaction between area, side, and experiment [F(2, 44) = 3.195, P = 0.51]. However, significant stimulation effects across Experiments 1 and 2 were indicated by significant area-by-side [F(2, 44) = 26.74, P < 0.001] and area-by-side-by-distance [F(2, 44) = 1.576, P = 0.021] interactions. These stimulation effects were modulated by numerical distance. Post-hoc comparisons showed that performance was affected reliably by stimulation to the IPS, relative to sham. Impairment (slowed performance) was shown following rTMS to the left IPS [t(23) = 3.728, P < 0.0001]; this was greater for comparisons of close numbers [t(23) = 6.076, P < 0.001]. Facilitation (speeded performance) emerged following rTMS to the right IPS [t(23) = 1.964, P = 0.009]. In contrast, rTMS to the left or right AG did not reliably influence numerosity comparisons across experiments [left AG: t(23) = 0.024, P = 0.9812, NS; right AG: t(23) = 0.0815, P = 0.4322, NS] (Fig. 3a, b). rTMS to the left IPS resulted in reliably greater impairment than rTMS to each of the other three stimulation sites across Experiments 1 and 2 [left IPS versus right IPS, t(23) = 6.076, P < 0.0001; left IPS versus left AG, t(23) = 4.468, P < 0.010; left IPS versus right AG, t(23) = 3.304, P < 0.05]. The effects of rTMS therefore were common to symbolic and non-symbolic numerosity processing and were brain-site specific. To examine the facilitation effect of rTMS, a two-factor area (right IPS and sham) by distance (stimuli far and close to the reference 65) ANOVA was carried out. There was a significant main effect of area [F(2, 44) = 5.353, P = 0.008] and of distance [F(1, 22) = 86.102, P < 0.0001], and no significant interaction [F(2, 44) = 0.370, P = 0.693, NS].
Experiment 3
Experiment 3 tested whether the impairment caused by rTMS to the IPS in previous Experiments was specific to numerosity processing. Although accuracy was comparable to that of the numerosity experiments (no effect of task on the sham conditions, F(1, 22) = 0.934, P = 0.344, NS), and there was a comparable distance effect across experiments [F(1, 22) = 50.024, P < 0.001], there was a significant difference in performance between the different stimulation sites in Experiment 3 [F(1, 11) = 11.187, P = 0.007] and a significant area-by-side-by-distance interaction [F(1, 11) = 15.908, P = 0.002]. Specifically, performance was impaired by right IPS stimulation [t(11) = 2.167, P < 0.05], with a significant difference between close and far stimuli [t(11) = 2.796, P = 0.017]. This is opposite to the facilitation effect observed in Experiments 1 and 2. Performance was not impaired after left IPS stimulation [t(11) = 1.198, P = 0.25] (Fig. 3c).
The effect of left IPS stimulation differed reliably in the three experiments [F(2,33) = 32.711, P < 0.001], with left IPS stimulation producing greater impairment in Experiments 1 and 2 than in Experiment 3 [t(11) = 3.984, P < 0.0001; t (11) = 6.561, P = 0.006, respectively].
Discussion
In this study, we used rTMS to explore the role of the IPS regions in numerosity processing. In common with patient studies (e.g., Cipolotti et al. 1991; Dehaene and Cohen 1997; Lemer et al. 2003; Mennemeier et al. 2005; Polk et al. 2001; Warrington 1982; Woods et al. 2006), our data provide evidence that impairments to the parietal cortex can cause impairments in numerosity processing. The present findings extend previous results with patients in two ways: first they indicate that left rather than the right IPS plays a critical role in numerosity processing. Second, these results show that the left IPS is equally involved in processing numerosities expressed symbolically and non-symbolically.
It may be suggested that our results may reflect a response bias; that is participants may have been aware of the difference between TMS and sham stimulation and this could have modulated their performance. However, we suggest that a response bias is unlikely to account for the difference in RTs that we found in the different tasks and areas stimulated.
Left IPS effects
Our evidence of common mechanisms underlying symbolic and non-symbolic number processing is consistent with, and complements results from neuroimaging investigations (e.g., Dehaene et al. 2003; Fias et al. 2003) by indicating that these mechanisms are located, in part, in a region of the left parietal lobe or its neural connections. Moreover, we showed that the degree of impairment or facilitation induced by rTMS to the left IPS depended on the numerical distance of the stimuli, i.e., the degree of impairment or facilitation was modulated by the distance effect. This result is consistently found in studies using dot and number comparison tasks (e.g., Castelli et al. 2006; Dehaene et al. 2003; Pinel et al. 2001). Our data suggest that the TMS effects were associated to the area, the task and the stimuli used: they occurred only after real and not after sham stimulation to the same target areas; they depended on the numerosity tasks and the stimuli used, and they concerned the IPS regions and not nearby areas such as the AG.
Our left IPS effects are consistent with some previous TMS studies showing that this region is critically involved in comparison of symbolic stimuli (e.g., Andres et al. 2005). However, other TMS studies have suggested that the AG and not the IPS is critical for numerosity processing (e.g., Göbel et al. 2001, 2005; Rusconi et al. 2005), whereas the present investigation showed the opposite result. A closer look at those studies reveals that in some cases the areas stimulated within the parietal lobe were not unequivocal (e.g., Sandrini et al. 2004), and that other studies stimulated the AG bilaterally (but not any other areas in the parietal lobe) in order to explore spatial number representation rather than numerosity judgment (e.g., Göbel et al. 2001, 2005). One study showed that rTMS over the left AG equally disrupts performance in tasks based on finger manipulation and single-digit number comparison (Rusconi et al. 2005). The apparent discrepancy with that study and our study where only large (two-digit) numbers have been used, may be explained by hypothesizing that separate subsets of parietal neurons code for different number sizes, as other authors have already suggested (Göbel et al. 2004; Naccache and Dehaene 2001; Nieder and Miller 2004; Stanescu-Cosson et al. 2000). Although the present study did not aim at distinguishing between small and large numbers, differences in encoding different number sizes by the parietal neurons may account for different results of this and other TMS studies.
Right IPS effects
Numerosity judgment
We have shown a facilitation effect (i.e., speeded RTs) following rTMS to the right IPS when performing symbolic and non-symbolic numerical comparisons (Experiments 1 and 2). This result is novel in the literature of number processing and TMS. Since the TMS parameters and their application were carefully controlled throughout the experiments here presented, and since all subjects showed the same facilitatory effect following rTMS to the right IPS in Experiments 1 and 2, we believe that this finding, though unexpected, warrants further discussion.
At a speculative level, the facilitation effects on the right IPS following rTMS suggest that numerosity processing might be regulated by inhibitory input from distant cortical areas and, particularly, homologous areas of the human cerebral cortex. This mechanism of inter-hemispheric inhibition is believed to be mediated by callosal fibers and it has been described before in non-numerical tasks in motor and parietal areas in both neurologically healthy subjects and in patients with stroke (Fregni et al. 2006; Hilgetag et al. 2001; Kobayashi et al. 2004; Naeser et al. 2005; Mansur et al. 2005; Takeuchi et al. 2005; Theoret et al. 2003). The present results suggest that such transcallosal inhibition may also be extended to numerical processing. This interaction may explain why studies using neuroimaging methods often find bilateral activation of the IPS during numerical tasks (e.g., Pinel et al. 2001, 2004), which has been taken as evidence that both hemispheres equally represent numerical quantity. Further confirmation of the equal contribution of the left and the right hemispheres to number processing comes from studies on split-brain patients (e.g., Cohen and Dehane 1996; Seymour et al. 1994), and by some experimental investigations on unilateral presentation of numbers (e.g., Ratinchx et al. 2001). However, the evidence that both hemispheres are equally involved in numerical processing is not consistent. For instance, although the same numerical distance effect emerged in both hemispheres in split-brain patients, number comparison was slightly slower and less accurate in the right than the left hemisphere (Cohen and Dehane 1996), and some experimental investigations indeed showed hemispheric asymmetries in number comparison (e.g., Boles 1986). Moreover, virtually all neuropsychological cases of numerical impairments clearly indicate that unilateral damages to either the left or the right parietal lobe are sufficient to cause numerical impairments (Dehaene et al. 2003; Mennemeier et al. 2005; Woods et al. 2006).
How can these discrepancies be accounted for? One explanation is that although both the left and the right hemispheres have access to numerical representations, there is the possibility of some degree of differentiation between homologous left and right areas, with a right-hemispheric dominance for the representation of continuous quantities and the left dominance for exact quantity (e.g., Dehaene and Cohen 1991). Our data offer some support to this view as they indicate that the left IPS is relevant for numerosity whereas processing the continuous features of the stimuli in Experiment 3 suggest that the right IPS is relevant for continuous quantity processing. We also suggest that the interaction between these processes is modulated by transcallosal inhibitory mechanisms, in agreement with recent experimental evidence suggesting inter-hemispheric interaction at the level of magnitude system (Ratinchx et al. 2001). The relatively discrepancy of our study to other TMS studies may reside in the choice of the numerical stimuli used (single rather than two-digit numbers or arrays of dots), or the TMS parameters used (10 Hz 500 ms trains rather than 1 Hz for 10 min). It is worth noting that the data reported by a TMS study that targeted the IPS suggests a tendency (although not significant) toward a facilitation effect in the right IPS (Andres et al. 2005).
The facilitation effect following right IPS stimulation in the non-symbolic (i.e., dot) numerosity task may appear surprising considering that the right hemisphere is known to be sensitive to visuo-spatial features (e.g., Culham and Kenwisher 2001), and therefore interference rather than facilitation might have been expected in both the right IPS and AG. With respect to the right IPS, we suggest that our results may be explained in terms of task demand: it may be possible that the numerosity comparison task required participants to focus more on quantity rather than on spatial processing. Indeed, the right IPS has been shown to be active when processing non-symbolic numerosities irrespective of whether they are expressed visually or auditory (Dehaene et al. 2003; Eger et al. 2001), suggesting that the quantity rather than the spatial nature of dot comparison tasks is more sensitive to right IPS stimulation.
In the same non-symbolic numerosity task, we did not observe any significant interference following right AG stimulation, similar to neuroimaging studies which did not seem to show right AG activation in magnitude tasks with dots (e.g., Piazza et al. 2004; Sathian et al. 1999). In this study we observed, however, a tendency to an interference effect in the right AG when performing the non-symbolic comparison task, which was significantly higher than in the symbolic task [t(11) = 8.728, P = 0.0001]. Unfortunately, “In our Experiment 3 we aimed at testing to what extent the left or the right IPS were involved in numerosity processing: therefore we targeted the left and the right IPS only and not the AG”. A recent study, however, showed right AG interference in performing a task involving continuous quantities in the form of time discrimination (Alexander et al. 2005). This suggests that the right AG is involved in time discrimination, among other cognitive functions, but does not indicate that the right AG involvement can be generalized to all continua. Indeed, the authors showed that processing another continuous variable used as control condition, i.e., pitch discrimination, did not result in right TMS interference, therefore suggesting that the right AG is not uniformly involved in processing all quantity continua.
Non-numerosity judgment
In Experiment 3 we observed some unexpected rTMS effects on the right IPS. rTMS increased RTs for judging the orientation of ellipses and this effect was modulated by a distance effect: judging ellipses closer to a circle resulted in significantly longer RTs than judging ellipses far away from a circle. The fact that rTMS effects occurred only in the right hemisphere and interacted with distance effect helps to exclude the possibility that these results are due to interference with attentional resources. Similarly, explanations in terms of rTMS effects due to the visuo-spatial aspects of the stimuli do not seem exhaustive either, as similar effects would have occurred in the numerosity task based on dot displays (Experiment 2). We believe that the most likely account for rTMS effects in the right IPS in Experiment 3 may be in terms of the nature of the stimuli and of the task used. Although not involving numerosity, the categorical judgment required to process ellipses involved some manipulation of analogue quantity, i.e., the amount of ‘elongation’ of each figure expressed by the ratio between the vertical and the horizontal axis. Such analogue quantity manipulation is likely to involve the right parietal lobe, consistent with results from neuroimaging studies (e.g., Fullbright et al. 2003; Pinel et al. 2004).
In conclusion, our findings suggest that numerosity processing arises from interacting mechanisms in anatomically restricted parts of the brain. Specifically, the left IPS seems to be critically involved in processing symbolic and non-symbolic numerosities in the form of Arabic numbers and arrays of dots, whereas our results of Experiment 3 suggest that the right IPS seems to play a critical role in processing continuous features of the stimuli. Reversible impairments to the left and right IPS appears to be modulated by the distance between the stimuli with greater disruption for smaller distances. These results are TMS-related and area, task and stimulus-associated: they occurred only after real and not sham stimulation to the same target areas; they concerned specific brain regions (i.e., IPS) and not contiguous but distinct areas (i.e., AG), and they depended on whether the quantity task implied the processing of numerosity or of analogue properties of the stimulus.
Acknowledgments
This work was supported by British Academy and Wellcome Trust Grants to MC, by a National Academy of Education/Spencer Foundation Postdoctoral Fellowship to HB, by grants from the National Institutes of Health (K24 RR018875, RO1-EY12091, RO1-DC05672, RO1-NS 47,754, RO1-NS 20,068, and R01-EB 00,5047) to APL and by the Harvard Medical School Scholars in Clinical Science Program (NIH K30 HL04095-03) to FF. We would like to thank M. Finkbeiner for technical support, A. Caramazza, E. Freeman, and V. Walsh for useful comments, and the Harvard-Thorndike General Clinical Research Center for help in implementing the study.
References
- Alexander I, Cowey A, Walsh V. The right parietal cortex and time perception: back to Critchley and the Zeitraffer phenomenon. Cogn Neuropsychol. 2005;22:306–315. doi: 10.1080/02643290442000356. [DOI] [PubMed] [Google Scholar]
- Andres M, Seron X, Olivier E. Hemispheric lateralization of number comparison. Cogn Brain Res. 2005;25:283–290. doi: 10.1016/j.cogbrainres.2005.06.002. [DOI] [PubMed] [Google Scholar]
- Ashbridge E, Walsh V, Cowey A. Temporal aspects of visual search studies by transcranial magnetic stimulation. Neuropsychologia. 1997;35:1121–1131. doi: 10.1016/s0028-3932(97)00003-1. [DOI] [PubMed] [Google Scholar]
- Barth H, La Mont K, Lipton J, Spelke E. Abstract number and arithmetic in preschool children. Proc Natl Acad Sci USA. 2005;102:14116–14121. doi: 10.1073/pnas.0505512102. [DOI] [PMC free article] [PubMed] [Google Scholar]
- Barth H, La Mont K, Lipton J, Dehaene S, Kanwisher N, Spelke E. Non-symbolic arithmetic in adults and young children. Cognition. 2006;98:199–222. doi: 10.1016/j.cognition.2004.09.011. [DOI] [PubMed] [Google Scholar]
- Boles DB. Hemispheric differences in the judgment of number. Neuropsychologia. 1986;24:511–519. doi: 10.1016/0028-3932(86)90095-3. [DOI] [PubMed] [Google Scholar]
- Butterworth B. The mathematical brain. New York: McMillian; 1999. [Google Scholar]
- Cappelletti M, Butterworth B, Kopelman MD. Spared numerical abilities in a case of semantic dementia. Neuropsychologia. 2001;39:1224–1239. doi: 10.1016/s0028-3932(01)00035-5. [DOI] [PubMed] [Google Scholar]
- Castelli F, Glaser DE, Butterworth B. Discrete and analogue quantity processing in the parietal lobe: a functional MRI study. PNAS. 2006;103:4693–4698. doi: 10.1073/pnas.0600444103. [DOI] [PMC free article] [PubMed] [Google Scholar]
- Chen R, Classen J, Gerloff C, Celnik P, Wassermann EM, Hallett M, Cohen LG. Depression of motor cortex excitability by low-frequency transcranial magnetic stimulation. Neurology. 1997;48:1398–1403. doi: 10.1212/wnl.48.5.1398. [DOI] [PubMed] [Google Scholar]
- Cipolotti L, Butterworth B, Denes G. Specific deficit for numbers in a case of dense acalculia. Brain. 1991;114:2619–2637. doi: 10.1093/brain/114.6.2619. [DOI] [PubMed] [Google Scholar]
- Cohen L, Dehaene S. Cerebral networks for number processing: evidence from a case of posterior callosal lesion. Neurocase. 1996;2:155–174. [Google Scholar]
- Cohen L, Dehaene S, Chochon F, Lehéricy S, Naccache L. Language and calculation within the parietal lobe: a combined cognitive, anatomical and fMRI study. Neurospychologia. 2000;138:1426–1440. doi: 10.1016/s0028-3932(00)00038-5. [DOI] [PubMed] [Google Scholar]
- Crutch SJ, Warrington EK. Preserved calculation skills in a case of semantic dementia. Cortex. 2002;38:389–399. doi: 10.1016/s0010-9452(08)70667-1. [DOI] [PubMed] [Google Scholar]
- Culham J, Kenwisher N. Neuroimaging of cognitive functions in human parietal cortex. Curr opin Neurobiol. 2001;11:157–163. doi: 10.1016/s0959-4388(00)00191-4. [DOI] [PubMed] [Google Scholar]
- Dehaene S. Varieties of numerical abilities. Cognition. 1992;44:42. doi: 10.1016/0010-0277(92)90049-n. [DOI] [PubMed] [Google Scholar]
- Dehaene S. The organization of brain activations in number comparison: event-related potentials and the additive-factors methods. J Cogn Neurosci. 1996;8:47–68. doi: 10.1162/jocn.1996.8.1.47. [DOI] [PubMed] [Google Scholar]
- Dehaene S. The number sense. New York, Cambridge, UK: Oxford University Press, Penguin press; 1997. [Google Scholar]
- Dehaene S, Cohen L. Two mental calculation systems: a case study of severe acalculia with preserved approximation. Neuropsychologia. 1991;29:1045–1074. doi: 10.1016/0028-3932(91)90076-k. [DOI] [PubMed] [Google Scholar]
- Dehaene S, Cohen L. Cerebral pathways for calculation: double dissociation between rote verbal and quantitative knowledge of arithmetic. Cortex. 1997;33:219–250. doi: 10.1016/s0010-9452(08)70002-9. [DOI] [PubMed] [Google Scholar]
- Dehaene S, Spelke E, Pinel P, Stanescu R, Tsivkin S. Sources of mathematical thinking: behavioral and brain-imaging evidence. Science. 1999;284:970–974. doi: 10.1126/science.284.5416.970. [DOI] [PubMed] [Google Scholar]
- Dehaene S, Piazza M, Pinel P, Cohen L. Three parietal circuits for number processing. Cogn Neuropsychol. 2003;20:487–506. doi: 10.1080/02643290244000239. [DOI] [PubMed] [Google Scholar]
- Eger E, Sterzer P, Russ M, Giraud A, Kleinschmidt A. A supramodal number representation in human intraparietal cortex. Neuron. 2001;37(4):719–725. doi: 10.1016/s0896-6273(03)00036-9. [DOI] [PubMed] [Google Scholar]
- Faillenot I, Decety J, Jeannerod M. Human brain activity related to the perception of spatial features of objects. Neuroimage. 1998;10:114–124. doi: 10.1006/nimg.1999.0449. [DOI] [PubMed] [Google Scholar]
- Feigenson L, Carey S, Hauser M. The representations underlying infants' choice of more: object files versus analogue magnitude. Psychol Sci. 2002;13:150–156. doi: 10.1111/1467-9280.00427. [DOI] [PubMed] [Google Scholar]
- Fias W, Lammertyn J, Reynvoet B, Dupont P, Orban G. Parietal representation of symbolic and non-symbolic magnitude. J Cogn Neurosci. 2003;15:1–11. doi: 10.1162/089892903321107819. [DOI] [PubMed] [Google Scholar]
- Forster KI, Forster JC. DMDX: a windows display program with millisecond accuracy. Behav Res Methods Instrum Comput. 2003;35:116–124. doi: 10.3758/bf03195503. [DOI] [PubMed] [Google Scholar]
- Fregni F, Boggio PS, Valle AC, Rocha RR, Duarte J, Ferreira, et al. A sham-controlled trial of 5-day course of rTMS of the unaffected hemisphere in stroke patients. Stroke. 2006;37(8):2115–2122. doi: 10.1161/01.STR.0000231390.58967.6b. [DOI] [PubMed] [Google Scholar]
- Fullbright R, Manson C, Skudlarski P, Lacadie C, Gore J. Quantity determination and the distance effect with letters numbers and shapes: a functional MR imaging study of number processing. AJNR Am J Neuroradiol. 2003;23:197–200. [PMC free article] [PubMed] [Google Scholar]
- Gelman R, Gallistel CR. Language and the origin of numerical cognition. Science. 2004;306:441–443. doi: 10.1126/science.1105144. [DOI] [PubMed] [Google Scholar]
- Göbel SM, Walsh V, Rushworth MFS. The mental number line and the human angular gyrus. NeuroImage. 2001;14:1278–1289. doi: 10.1006/nimg.2001.0927. [DOI] [PubMed] [Google Scholar]
- Göbel SM, Johansen-Berg H, Behrens TE, Rushworth MFS. Response-selection related parietal activation during number comparison. J Cogn Neurosci. 2004;16:1536–1551. doi: 10.1162/0898929042568442. [DOI] [PubMed] [Google Scholar]
- Göbel SM, Calabria M, Farné A, Rossetti Y. Parietal rTMS distorts the mental number line: simulating ‘spatial’ neglect in healthy subjects. Neuropsychologia. 2005;44:860–868. doi: 10.1016/j.neuropsychologia.2005.09.007. [DOI] [PubMed] [Google Scholar]
- Göbel SM, Calabria M, Farné A, Giraud A, Rossetti Y. Parietal rTMS distorts the mental number line: simulating “spatial” neglect in healthy subjects. Neuropsychologia. 2006;44:860–868. doi: 10.1016/j.neuropsychologia.2005.09.007. [DOI] [PubMed] [Google Scholar]
- Hilgetag CC, Theoret H, Pascual-Leone A. Enhanced visual spatial attention ipsilateral to rTMS-induced ‘virtual lesions’ of human parietal cortex. Nat Neurosci. 2001;4:953–957. doi: 10.1038/nn0901-953. [DOI] [PubMed] [Google Scholar]
- Johnson DM. Confidence and speed in the two-category judgment. Arch Psychol. 1939;241:1–52. [Google Scholar]
- Kadosh R, Henik A, Rubinsten O, Mohr H, Dori H, Van de Ven V, Zorzi M, Goebel R, Linden D. Are numbers special? the comparison systems of the human brain investigated by fMRI. Neuropsychologia. 2005;43:1238–1248. doi: 10.1016/j.neuropsychologia.2004.12.017. [DOI] [PubMed] [Google Scholar]
- Kobayashi M, Hutchinson S, Theoret H, Schlaug G, Pascual-Leone A. A Repetitive TMS of the motor cortex improves ipsilateral sequential simple finger movements. Neurology. 2004;62:91–98. doi: 10.1212/wnl.62.1.91. [DOI] [PubMed] [Google Scholar]
- Kolb B, Whishaw IQ. Brain plasticity and behavior. Annu Rev Psychol. 1998;49:43–64. doi: 10.1146/annurev.psych.49.1.43. [DOI] [PubMed] [Google Scholar]
- Kosslyn SM, Pascual-Leone A, Felician O, Camposano S, Keenan JP, Thompson WL, Ganis G, Sukel KE, Alpert NM. The role of area 17 in visual imagery: convergent evidence from PET and rTMS. Science. 1999;284:167–170. doi: 10.1126/science.284.5411.167. [DOI] [PubMed] [Google Scholar]
- Lemer C, Dehaene S, Spelke E, Cohen L. Approximate quantities and exact number words: dissociable systems. Neuropsychologia. 2003;41:1942–1958. doi: 10.1016/s0028-3932(03)00123-4. [DOI] [PubMed] [Google Scholar]
- Mansur CG, Fregni F, Boggio PS, Riberto M, Gallucci-Neto J, Santos CM, Wagner T, Rigonatti SP, Marcolin MA, Pascual-Leone A. A sham stimulation-controlled trial of rTMS of the unaffected hemisphere in stroke patients. Neurology. 2005;64:802–804. doi: 10.1212/01.WNL.0000161839.38079.92. [DOI] [PubMed] [Google Scholar]
- Martin P, Naeser MA, Theoret H, Tormos JM, Nicholas M, Kurland J, Fregni F, Seekins H, Doron K, Pascual-Leone A. Transcranial magnetic stimulation as a complementary treatment for Aphasia. Semin Speech Lang. 2004;25:181–191. doi: 10.1055/s-2004-825654. [DOI] [PubMed] [Google Scholar]
- Mennemeier M, Pierce CA, Chatterjee A, Anderson B, Jewell G, Dowler R, Woods AJ, Glenn T, Mark VM. Biases in attentional orientation and magnitude estimation explain crossover: neglect is a disorder of both. J Cogn Neurosci. 2005;17:1194–1211. doi: 10.1162/0898929055002454. [DOI] [PMC free article] [PubMed] [Google Scholar]
- Moyer RS, Landauer TK. Time required for judgements of numerical inequality. Nature. 1967;215:1519–1520. doi: 10.1038/2151519a0. [DOI] [PubMed] [Google Scholar]
- Naccache L, Dehaene S. The priming method: imaging unconscious repetition priming reveals an abstract representation of number in the parietal lobes. Cereb Cortex. 2001;11:966–974. doi: 10.1093/cercor/11.10.966. [DOI] [PubMed] [Google Scholar]
- Naeser MA, Martin PI, Nicholas M, Baker EH, Seekins H, Helm-Estabrooks N, Cayer-Meade C, Kobayashi M, Theoret H, Fregni F, Tormos JM, Kurland J, Doron KW, Pascual-Leone A. Improved picture naming in chronic aphasia after TMS to part of right Broca's area: an open-protocol study. Brain Lang. 2005;93:95–105. doi: 10.1016/j.bandl.2004.08.004. [DOI] [PubMed] [Google Scholar]
- Nieder A, Miller EK. A parieto-frontal network for visual numerical information in the monkey. Proc Natl Acad Sci USA. 2004;101:7457–7462. doi: 10.1073/pnas.0402239101. [DOI] [PMC free article] [PubMed] [Google Scholar]
- Nieder A, Freedman DJ, Miller EK. Representation of the quantity of visual items in the primate prefrontal cortex. Science. 2002;297:1708–1711. doi: 10.1126/science.1072493. [DOI] [PubMed] [Google Scholar]
- Oliveri M, Rausei V, Koch G, Torriero S, Turriziani P, Caltagirone C. Overestimation of numerical distances in the left side of space. Neurology. 2004;11:2139–2141. doi: 10.1212/01.wnl.0000145975.58478.6d. [DOI] [PubMed] [Google Scholar]
- Ono M, Kubik S, Abernathey CD. Atlas of the Cerebral Sulci. Thieme; 1990. [Google Scholar]
- Pascual-Leone A, Walsh V, Rothwell J. Transcranial magnetic stimulation in cognitive neuroscience–Virtual lesion, chronometry, and functional connectivity. Curr Opin Neurobiol. 2000;10:232–237. doi: 10.1016/s0959-4388(00)00081-7. [DOI] [PubMed] [Google Scholar]
- Pascual-Leone AP, Davey NJ, Rothwell J, Wassermann EM, Puri BK. Handbook of transcranial magnetic stimulation. Paris: Arnold Publisher; 2002. [Google Scholar]
- Paus T, Jech R, Thompson CJ, Comeau R, Peters T, Evans A. Transcranial magnetic stimulation during positron emission tomography: a new method for studying connectivity of the cerebral cortex. J Neurosci. 1997;179:3178–3184. doi: 10.1523/JNEUROSCI.17-09-03178.1997. [DOI] [PMC free article] [PubMed] [Google Scholar]
- Paus T. Imaging the brain before, during, and after transcranial magnetic stimulation. Neuropsychologia. 1999;37:219–224. doi: 10.1016/s0028-3932(98)00096-7. [DOI] [PubMed] [Google Scholar]
- Piazza M, Izard V, Pinel P, Le Bihan D, Dehaene S. Tuning curves for approximate numerosity in the human intraparietal sulcus. Neuron. 2004;44:547–555. doi: 10.1016/j.neuron.2004.10.014. [DOI] [PubMed] [Google Scholar]
- Pinel P, Piazza M, Le Bihan D, Dehaene S. Distributed and overlapping cerebral representations of number, size, and luminance during comparative judgments. Neuron. 2004;41:983–993. doi: 10.1016/s0896-6273(04)00107-2. [DOI] [PubMed] [Google Scholar]
- Pinel P, Dehaene S, Riviere D, LeBihan D. Modulation of parietal activation by semantic distance in a number comparison task. Neuroimage. 2001;14:1013–1026. doi: 10.1006/nimg.2001.0913. [DOI] [PubMed] [Google Scholar]
- Polk T, Reed C, Keenan J, Hogard P, Anderson CA. A dissociation between symbolic number knowledge and analogue magnitude information. Brain Cogn. 2001;47:545–563. doi: 10.1006/brcg.2001.1486. [DOI] [PubMed] [Google Scholar]
- Ratinckx E, Brysbaert M, Reynvoet B. Bilateral Weld interactions and hemispheric asymmetry in number comparison. Neuropsychologia. 2001;39(4):335–345. doi: 10.1016/s0028-3932(00)00143-3. [DOI] [PubMed] [Google Scholar]
- Robertson EM, Theoret H, Pascual-Leone A. The problems solved and created by transcranial magnetic stimulation. J Cogn Neurosci. 2003;15:948–960. doi: 10.1162/089892903770007344. [DOI] [PubMed] [Google Scholar]
- Romero R, Anschel D, Sparing R, Gangitano M, Pascual-Leone A. Subthreshold low frequency repetitive transcranial magnetic stimulation selectively decreases facilitation in the motor cortex. Clin Neurophysiol. 2002;113:101–107. doi: 10.1016/s1388-2457(01)00693-9. [DOI] [PubMed] [Google Scholar]
- Rusconi E, Walsh V, Butterworth B. Dexterity with numbers: rTMS over left angular gyrus disrupts Wnger gnosis and number processing. Neuropsychologia. 2005;43:1609–1624. doi: 10.1016/j.neuropsychologia.2005.01.009. [DOI] [PubMed] [Google Scholar]
- Sandrini M, Rossini PM, Miniussi C. The differential involvement of inferior parietal lobule in number comparison: a rTMS study. Neuropsychologia. 2004;42:1902–1909. doi: 10.1016/j.neuropsychologia.2004.05.005. [DOI] [PubMed] [Google Scholar]
- Sathian K, Simon TJ, Peterson S, Patel GA, Hoffman JM, Grafton ST. Neural evidence linking visual object enumeration and attention. J Cogn Neurosci. 1999;11:36–51. doi: 10.1162/089892999563238. [DOI] [PubMed] [Google Scholar]
- Sawamura H, Shima K, Tanji J. Numerical representation for action in the parietal cortex of the monkey. Nature. 2002;415:918–922. doi: 10.1038/415918a. [DOI] [PubMed] [Google Scholar]
- Seymour SA, Reuter-Lorenz PA, Gazzaniga MS. The disconnection syndrome: basic findings reaffirmed. Brain. 1994;117:105–115. doi: 10.1093/brain/117.1.105. [DOI] [PubMed] [Google Scholar]
- Shuman M, Kanwisher N. Numerical magnitude in the nhuman parietal lobe; tests of representational generality and domain specificity. Neuron. 2004;44:557–569. doi: 10.1016/j.neuron.2004.10.008. [DOI] [PubMed] [Google Scholar]
- Stanescu-Cosson R, Pinel P, van de Moortele PF, LeBihan D, Cohen L, Dehaene S. Cerebral bases of calculation processes: impact of number size on the cerebral circuits for exact and approximative calculation. Brain. 2000;123:2240–2255. doi: 10.1093/brain/123.11.2240. [DOI] [PubMed] [Google Scholar]
- Stokes M, Chambers CD, Gould IC, Henderson TR, Janko NE, Allen NB, Mattingley JB. Simple metric for scaling motor threshold based on scalp-cortex distance: application to studies using transcranial magnetic stimulation. J Neurophysiol. 2005;94:4520–4527. doi: 10.1152/jn.00067.2005. [DOI] [PubMed] [Google Scholar]
- Takeuchi N, Chuma T, Matsuo Y, Watanabe I, Ikoma K. Repetitive transcranial magnetic stimulation of contralesional primary motor cortex improves hand function after stroke. Stroke. 2005;36:2681–2686. doi: 10.1161/01.STR.0000189658.51972.34. [DOI] [PubMed] [Google Scholar]
- Theoret H, Haque J, Pascual-Leone A. Increased variability of paced finger tapping accuracy following repetitive magnetic stimulation of the cerebellum in humans. Neurosci Lett. 2001;306:29–32. doi: 10.1016/s0304-3940(01)01860-2. [DOI] [PubMed] [Google Scholar]
- Theoret H, Kobayashi M, Valero-Cabre A, Pascual Leone A. Exploring paradoxical functional facilitation with TMS. Suppl Clin Neurophysiol. 2003;56:211–219. doi: 10.1016/s1567-424x(09)70224-7. [DOI] [PubMed] [Google Scholar]
- Thioux M, Pillon A, Samson D, De Partz MP, Noël MP, Seron X. The isolation of numerals at the semantic level. Neurocase. 1998;4:371–389. [Google Scholar]
- Turconi E, Jemel B, Rossion B, Seron X. Electrophysiological evidence for differential processing of numerical quantity and order in humans. Cogn Brain Res. 2004;21(1):22–38. doi: 10.1016/j.cogbrainres.2004.05.003. [DOI] [PubMed] [Google Scholar]
- Verguts T, Fias W. Representation of number in animals and humans: a neural model. J Cogn Neurosci. 2004;16:1493–1504. doi: 10.1162/0898929042568497. [DOI] [PubMed] [Google Scholar]
- Walsh V, Rushworth MFS. The use of transcranial magnetic stimulation in neuropsychological testing. Neuropsychologia. 1999;37:125–135. [PubMed] [Google Scholar]
- Walsh V, Pascual-Leone A. A neurochronometrics of mind. Cambridge, Massachusetts, London, England: The MIT Press; 2003. Transcranial magnetic stimulation. [Google Scholar]
- Warrington EK. The fractionation of arithmetic skills: a single case study. Q J Exp Psychol. 1982;34A:31–51. doi: 10.1080/14640748208400856. [DOI] [PubMed] [Google Scholar]
- Wasserman EM. Risk and safety of repetitive transcranial magnetic stimulation: report and suggested guidelines from the International workshop on the safety of repetitive transcranial magnetic stimulation, June 5–7, 1996. Electroencelophagr Clin Neurophysiol. 1998;108:1–16. doi: 10.1016/s0168-5597(97)00096-8. [DOI] [PubMed] [Google Scholar]
- Woods AJ, Mennemeier M, Garcia-Rill E, Meythaler J, Mark VW, Jewel GR, Murphy H. Bias in magnitude estimation following left hemisphere injury. Neuropsychologia. 2006;44:1406–1412. doi: 10.1016/j.neuropsychologia.2005.12.006. [DOI] [PMC free article] [PubMed] [Google Scholar]
- Wojciulik E, Kanwisher N. The generality of parietal involvement in visual attention. Neuron. 1999;23:747–764. doi: 10.1016/s0896-6273(01)80033-7. [DOI] [PubMed] [Google Scholar]
- Zorzi M, Stoianov I, Umiltà C. Computational modeling of numerical cognition. In: Campbell J, editor. Handbook of mathematical cognition. Vol. 5. London: Psychology Press; 2005. pp. 67–83. [Google Scholar]
- Xu F. Numerical competence in infancy: two systems of representation; Paper presented at the 12th Biennial International Conference on Infant Studies; Brighton, UK. 2000. [Google Scholar]
- Xu F, Spelke ES. Large number discrimination in 6-month old infants. Cognition. 2000;74:B1–B11. doi: 10.1016/s0010-0277(99)00066-9. [DOI] [PubMed] [Google Scholar]