

Abstract
Neurons selective for frequency modulated (FM) sweeps are common in auditory systems across different vertebrate groups and may underlie representation of species-specific vocalizations. Studies on mechanisms of FM sweep selectivity have primarily focused on sideband inhibition. Here, we present the first evidence for facilitatory mechanisms of FM sweep selectivity. Facilitatory interactions were found in 46 of 264 (17%) neurons tuned in the echolocation range (25–60 kHz) in the auditory cortex of the pallid bat. These neurons respond poorly to individual tones but are facilitated by combinations of tones with specific spectral and temporal intervals. Facilitation neurons show remarkable sensitivity to sub-millisecond differences in time delays between the two tones. Interestingly, the range of delays eliciting facilitation is not fixed but varies systematically with frequency difference between the two tones. Properties of facilitation strongly predict selectivity for the direction and rate of FM sweeps. Together with previous studies, there appear to be at least three mechanisms underlying FM rate and direction selectivity: sideband inhibition, duration tuning, and facilitation. Interestingly, similar mechanisms underlie direction and velocity tuning in the visual system, suggesting the evolution of similar computations across sensory systems to process dynamic sensory stimuli.
Keywords: auditory cortex, combination sensitivity, facilitation, sideband inhibition, FM sweeps, rebound from inhibition
Introduction
A fundamental question in neuroscience is whether different sensory systems solve analogous problems using similar computations. Important insight on this issue can be gained by comparing mechanisms underlying selectivity for stimuli moving across the sensory epithelium. Selectivity for various parameters of stimulus movement is common in sensory systems. Analogous properties include selectivity for movement direction and velocity in the visual system and direction and rate of frequency change in frequency modulated (FM) sweeps in the auditory system.
Studies of the mechanisms underlying selectivity for direction and rate have resulted in common models across sensory modalities. For example, asymmetric sideband inhibition gives rise to direction and rate (velocity) selectivity in both visual (Goodwin and Henry, 1978; Patel and Sillito, 1978; Fried et al., 2005; Razak and Pallas, 2005) and auditory systems (Suga, 1965; Zhang et al., 2003; Fuzessery et al., 2006; Razak and Fuzessery, 2006). Similarly, selectivity for the duration a stimulus spends within the excitatory receptive field gives rise to rate selectivity in both the visual (Duysens et al., 1985a,b) and auditory system (Fuzessery et al., 2006).
A third mechanism for direction and velocity/rate selectivity, based on facilitatory interactions (Segev and Rall, 1998), has been reported in the visual system (Movshon et al., 1978; Jagadeesh et al., 1993; Livingstone, 1998; Murthy and Humphrey, 1999), and theorized in the auditory system (Suga, 1973; Phillips et al., 1985; Heil et al., 1992; Covey and Casseday, 1999). Evidence for whether facilitation gives rise to selectivity for FM sweeps is, however, lacking. Here, we demonstrate the existence of facilitatory mechanisms underlying FM sweep rate and direction selectivity.
This study was also motivated by the fact that FM sweeps are common components of species-specific vocalizations. FM sweep-selective neurons are present in the auditory cortex of every species examined and may be involved in vocalization selectivity (Suga, 1965; Taniguchi et al., 1986; Heil et al., 1992; Mendelson et al., 1993; Kowalski et al., 1995; Heil and Irvine, 1998; Nelken and Versnel, 2000; Hart et al., 2003; Tian and Rauschecker, 2004). Determining the mechanisms of FM sweep selectivity will enhance our understanding of how selectivity for species-specific vocalizations is shaped by receptive field properties.
Here, we studied the role of facilitation in shaping FM sweep selectivity in the auditory cortex of the pallid bat. The pallid bat is suited for this study because the majority of cortical neurons are selective for the rate and direction of the FM sweep it uses in echolocation (Razak and Fuzessery, 2002, 2006). In addition, the relative contributions of duration tuning and sideband inhibition to sweep selectivity in the pallid bat are known (Fuzessery et al., 2006; Razak and Fuzessery, 2006). We present evidence for facilitatory responses to combinations of tones with frequencies in the echolocation range. The spectrotemporal relationships between tones eliciting facilitated responses accurately predict FM rate and direction selectivity.
Materials and Methods
Recordings were obtained from the auditory cortex of both cortical hemispheres in pallid bats captured in New Mexico and housed in the University of Wyoming animal facility. The bats were fed mealworms raised on ground Purina rat chow. The room was heated and maintained on a reversed 12 h light/dark cycle. All of the data reported were from single-unit recordings obtained from bats older than 50 d. All procedures followed the animal welfare guidelines required by the National Institutes of Health and Institutional Animal Care and Use Committee.
Surgical procedures.
Recordings were obtained from bats that were anesthetized with Metofane (methoxyflurane) inhalation, followed by an intraperitoneal injection of either urethane (1.9 mg/g) or pentobarbital sodium (30 μg/g body weight) and acepromazine (2 μg/g body weight). To expose the auditory cortex, the head was held in a bite bar, a midline incision was made in the scalp, and the muscles over the dorsal surface of the skull were reflected to the sides. The front of the skull was scraped clean and a layer of glass microbeads applied, followed by a layer of dental cement. The bat was then placed in a Plexiglas restraining device. A cylindrical aluminum head pin was inserted through a cross-bar over the bat's head and cemented to the previously prepared region of the skull. This pin served to hold the bat's head secure during the recording session. An exposure was made by excising a piece of skull over the location with best frequencies (BF) >30 kHz, known to be selective for FM sweeps. The size of the exposure was ∼2 mm2. Exposed muscle was covered with petroleum jelly (Vaseline), and exposed brain surface was covered with paraffin oil to prevent desiccation.
Recording procedures.
Experiments were conducted in a heated (30–33°C), sound-proofed chamber lined with anechoic foam. Stimuli were generated using Modular Instruments and Tucker-Davis Technologies digital hardware, and custom-written software (Fuzessery et al., 1991). The waveforms were amplified with a stereo amplifier and presented as closed-field stimuli through Infinity emit-K ribbon tweeters fitted with funnels that were inserted into the bat's pinnae and sealed there with petroleum jelly. This procedure attenuated speaker intensity level at the opposite ear by ≥30 dB (Fuzessery, 1996). The speaker-funnel frequency response curve was measured with a Bruel and Kjaer one-eighth inch microphone placed at the tip of the funnel. The response was flat from 10 to 20 kHz, showed a gradual increase of 20 dB between 20 and 35 kHz, and was flat from 35 to 60 kHz. Using glass microelectrodes (1 m NaCl, 2–5 MΩ impedance), recordings were obtained at depths between 200 and 500 μm. Penetrations were made orthogonal to the surface of the cortex. Response magnitudes and poststimulus time histograms were acquired and stored using a Modular Instruments high-speed clock controlled by custom software. Responses were quantified as the total number of action potentials elicited by 20 stimulus presentations. Single-unit recordings were identified based on the consistency of action potential amplitude and waveform displayed on an oscilloscope.
Data acquisition.
We focused exclusively on the high-frequency (25–60 kHz) FM sweep-selective region of auditory cortex (Razak and Fuzessery, 2002, 2006). When a neuron that responded to FM sweeps was isolated, the first step was to determine its response to tones. If the neuron responded to tones, sideband inhibition and its role in FM sweep selectivity was determined as reported previously (Razak and Fuzessery, 2006) (see below, Two-tone inhibition over time). A small percentage (∼15%) of neurons are “FM specialists” that respond strongly to downward FM sweeps but elicit <20% of maximum response to tones or upward FM sweeps (Razak and Fuzessery, 2002). These neurons were most likely to exhibit facilitation. When an FM specialist was isolated, the responses to upward and downward FM sweeps and to single tones were recorded, followed by the two-tone facilitation over time protocol (see below). The stimuli to quantify response selectivity were linear FM sweeps and tones with a 1/1 ms rise/fall time. For stimuli with durations <1 ms, the rise/fall times were half the stimulus duration.
FM rate and direction selectivity.
Rate selectivity was determined for downward FM sweeps by first recording responses to downward sweeps of at least two different bandwidths (BW) presented with durations of 0.5–70 ms. The sweep duration functions were then converted to rate selectivity functions by dividing the sweep BW by the sweep duration (kHz per msec). The neuron was classified as rate-selective if there was a reduction of >50% in maximum response as the FM rate was reduced. To determine whether the neuron was truly rate-tuned, and not simply sensitive to stimulus duration, the process was repeated at different sweep BWs.
To test for direction selectivity, the response to upward FM sweeps with the same range of duration and BW as the downward sweeps was recorded. A direction selectivity index (DSI) was calculated to quantify direction selectivity (O'Neill and Brimijoin, 2002). The formula used was DSI = (D − U)/(D + U). D and U are the maximum response magnitudes for downward and upward sweeps, respectively. The DSI of each neuron was calculated by comparing the maximum responses to upward and downward sweeps of the same BWs. In other words, the DSI was not necessarily calculated at the same sweep rate for the two sweep directions. Values of DSI can range between −1 and +1, with more positive values indicating higher selectivity for the downward direction. DSI values >0.6 are equivalent to the maximum response to the upward sweep being <25% of the maximum response to the downward sweep.
Two-tone facilitation over time.
As the specialists produced weak or no response to single tones, narrowband FM sweeps (BW of 10 kHz) were used to estimate the frequencies that excited the neuron. Once a range of excitatory frequencies was determined, a two-tone procedure was used to determine whether the neuron showed facilitation. Two manipulations were performed. First, two tones of the same duration (1 ms, 0.5 ms rise/fall time) and intensity (5–10 dB above threshold for FM sweeps) were used. The frequency of one tone was fixed within the range of excitatory frequencies. The frequency of the second tone was set up to 10 kHz lower, and the delay between the two tones was increased from −10 ms to +10 ms in 1 ms steps, with negative numbers denoting a low→high frequency sequence, and positive numbers denoting a high→low frequency sequence. If the response to a two-tone sequence was at least 50% greater than the sum of responses to individual tones, the neuron was classified as showing facilitation. In the second manipulation, the duration of the first tone was changed to determine whether facilitatory interactions occurred at signal offset.
Two-tone inhibition over time.
In the neurons that produced weak responses to single tones, it was possible to determine the existence of sideband inhibition. Because sideband inhibition can also create sweep rate and direction selectivity (Fuzessery et al., 2006; Razak and Fuzessery, 2006), it was important to examine the contributions of both inhibition and facilitation. To determine the arrival time and BW of sideband inhibition, a two-tone inhibition over time method was used (Calford and Semple, 1995; Brosch and Schreiner, 1997; Gordon and O'Neill, 1998). Two tones, one excitatory and the other inhibitory, were presented at various delays. The frequency of the excitatory tone was set at the BF of the neuron and was presented at a single intensity 10–20 dB above threshold with a duration of 3 ms. The inhibitory tone was presented at the same intensity and a longer duration (10 ms). Its frequency was varied between 5 and 70 kHz, and its onset time varied with respect to that of the excitatory tone. Below the BF, the frequency of the inhibitory tone was increased in 1 kHz steps. Because high-frequency inhibition (HFI) was typically very narrow (∼2–3 kHz) (Razak and Fuzessery, 2006), the resolution was 0.1 kHz for testing HFI. The delay-frequency combinations that resulted in inhibition of response to the excitatory tone for at least four of five (80% inhibition) consecutive presentations served to map out the spectrum and arrival times of inhibitory frequencies. Inhibition that occurred only when the excitatory tone was delayed denoted delayed inhibition arriving after excitation. This is analogous to forward masking. Inhibition that occurred even when the excitatory tone was advanced demonstrated an early inhibition that arrived before excitation. This is analogous to backward masking.
Data representation and analysis.
The response magnitudes reported are the number of action potentials in response to 20 stimulus repetitions at 1 Hz repetition rate. Error bars show SEM.
Results
Types of facilitatory interactions
The vast majority of cortical neurons tuned in the echolocation range (20–60 kHz) have a selectivity for FM rate and direction that is created by sideband inhibition (Razak and Fuzessery, 2006). These neurons respond to both tones and FM sweeps. Here we present data from 46 of 265 (17%; 11 bats) neurons (FM specialists) that appear to depend primarily on facilitation for FM sweep selectivity. These neurons responded selectively to FM sweeps and elicited <20% of maximum FM sweep response to tones.
Figure 1 presents a typical example of facilitation in an FM specialist (Fig. 1A). The neuron responded strongly to the downward sweep (50–20 kHz). An upward sweep with the same BW or individual tones elicited fewer spikes. The responses to 1 ms duration tone pairs are shown in Figure 1B. Positive delays indicate that the high-frequency tone was presented first (high→low). Negative delays indicate a low→high-frequency tone sequence. The summed response to the individual 31 and 29 kHz tones was eight spikes (Fig. 1B, dashed line). The response was three times greater when the two tones were delayed 1 ms, with the high-frequency tone leading (Fig. 1B) indicating that the two-tone sequence caused facilitation. The response declined as the positive delay increased, indicating an optimal range of delays that elicited facilitation. The response to the two-tone sequence was less than the summed response whether the low-frequency tone was presented first (Fig. 1B, negative delays), showing that facilitation was asymmetric favoring the high→low sequence in this neuron, and also that the opposite sequence might be inhibitory.
Figure 1.
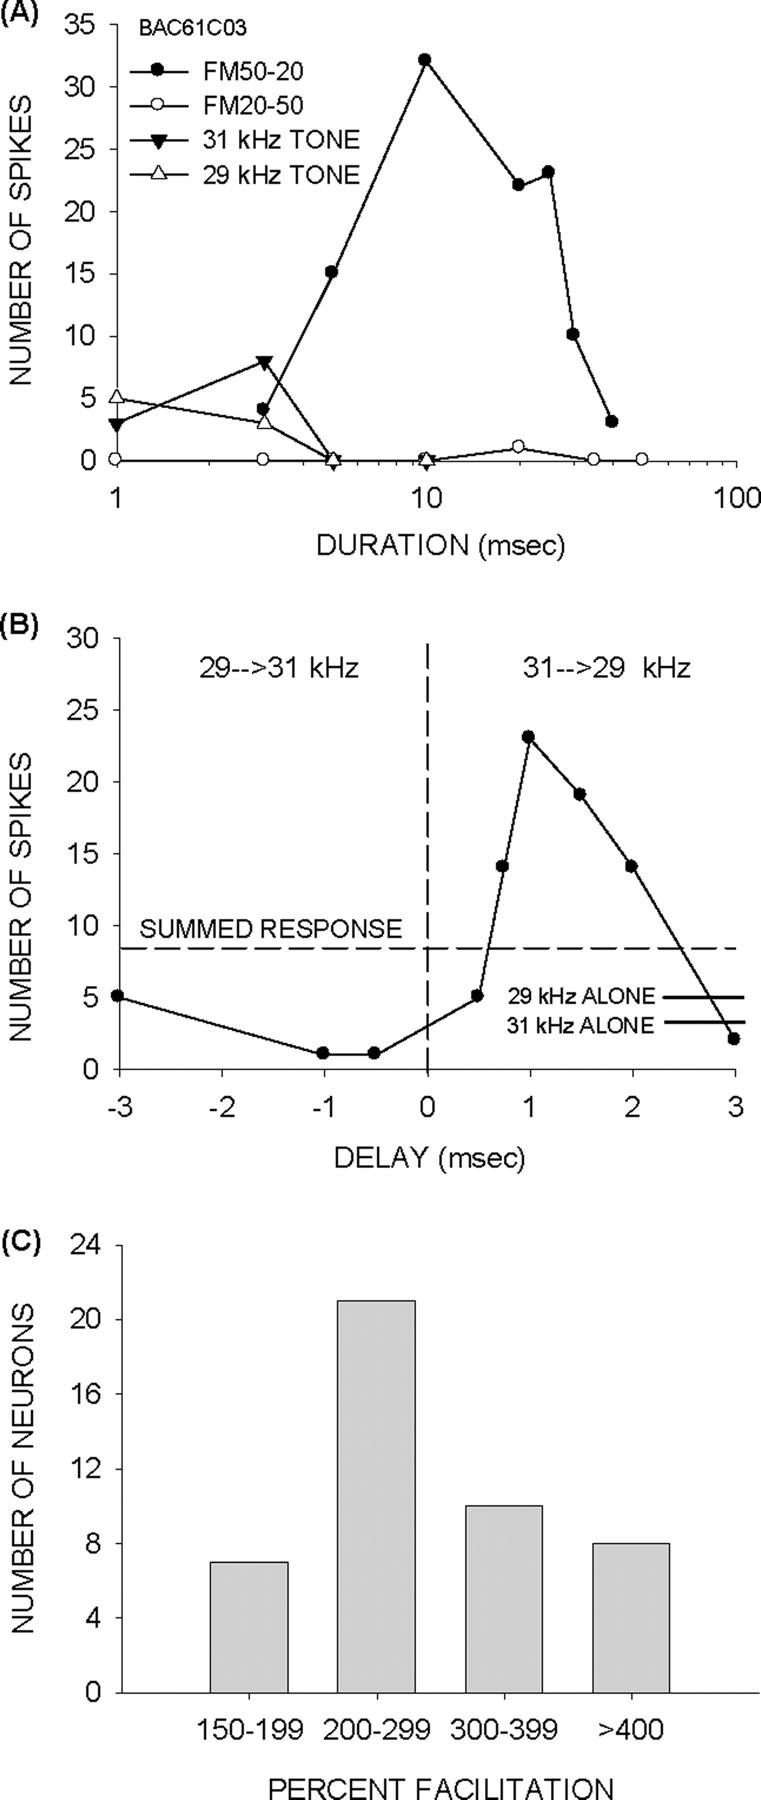
Facilitatory interactions in FM specialists. A, The neuron responded to downward FM sweeps but not to upward sweeps or individual tones present in the sweep. B, Two-tone tests on the same neuron revealed asymmetric facilitation, with the high→low sequence (positive delays) producing facilitation. The solid horizontal lines near the bottom right corner indicate the response magnitude to individual tones. The horizontal dashed line shows the sum of responses to the two tones presented individually (summed response). The low→high sequence (negative delays) produced a response that was lower than the summed response showing that inhibition might enhance the asymmetry. The peak facilitation occurred at 1 ms delay. The response declined toward the summed response for longer delays. C, Histogram of the range of facilitation observed in the FM specialists. In all 46 FM specialists, the response to the two-tone sequence was at least 50% stronger than the response to the sum of individual tone responses.
Facilitatory interactions were observed in all FM specialists. To quantify the degree of facilitation, the ratio of the maximum response to the two-tone sequence and the summed responses to the individual tones was calculated. In all 46 FM specialists, the response to a two-tone sequence was at least 50% stronger than the summed responses (Fig. 1C). In fact, in the vast majority of neurons, the sequence response was more than double the summed response.
The majority of neurons (39 of 46, 85%) with facilitation exhibited an asymmetry favoring the high→low sequence (positive delays). In the remaining seven neurons, the facilitation was similar for both positive and negative delays. For example, in the neuron shown in Figure 2A, the response to the tone sequence was ∼2.5× the summed response at both positive and negative delays. None of the neurons exhibited asymmetric facilitation favoring negative delays. Among the neurons with asymmetric facilitation, inhibition of >50% relative to the summed response for negative delays was observed in 13 (33%) neurons (Fig. 1B). Thus, the response asymmetry in some facilitated neurons is enhanced by inhibition for negative delays. The remaining neurons did not show evidence of inhibition (Figs. 2B, 5C). The example neuron in Figure 2B showed facilitation for a 38→34 kHz sequence. The response to a 34→38 kHz sequence was similar to the summed response. In this neuron, a lack of facilitation for the low→high sequence, rather than inhibition, appears to generate the asymmetry.
Figure 2.
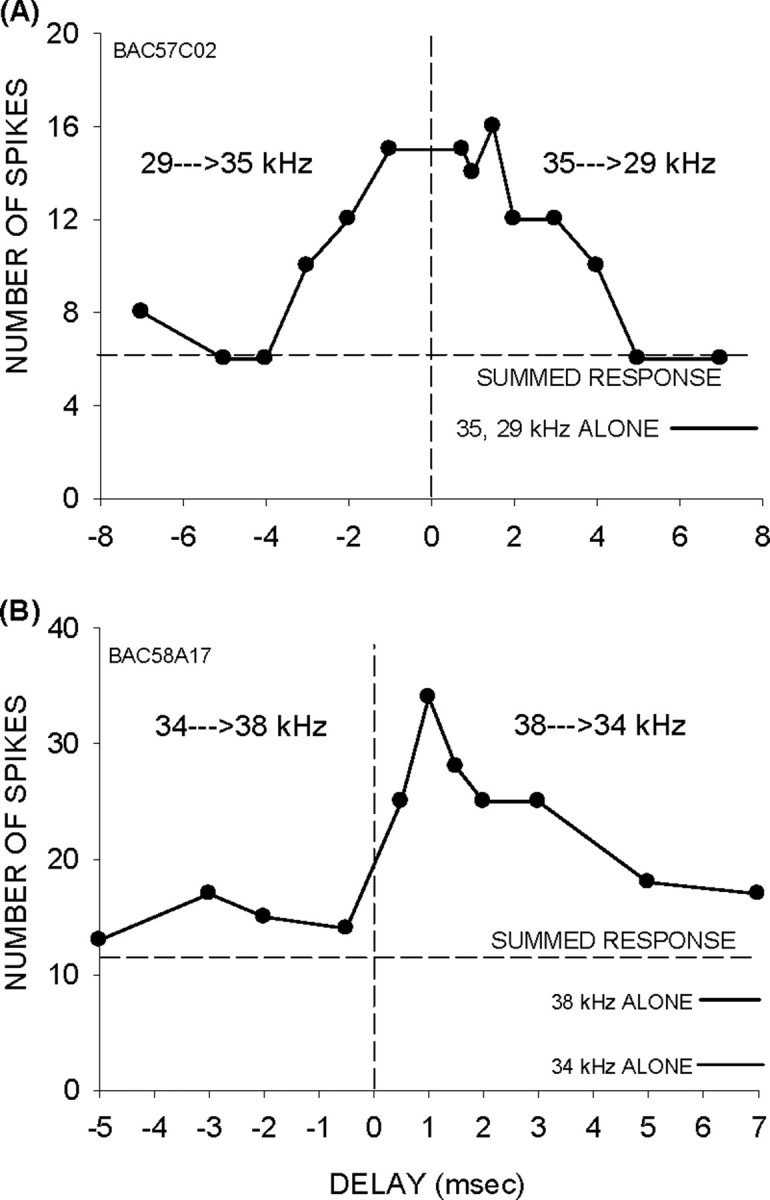
A, A neuron in which both positive and negative delays produced facilitation (symmetric facilitation). B, A neuron in which the response to the low→high sequence was similar to the summed response, but the high→low sequence elicited facilitation suggesting that asymmetry in inhibition alone does not account for the observed asymmetrical facilitation. The solid horizontal lines near the bottom right corner of each panel indicate the response magnitude to individual tones. The horizontal dashed line indicates the sum of responses to individual tones.
Figure 5.

Direction selectivity is predicted by the symmetry of facilitation. A, B, A neuron with strongly asymmetric facilitation is also strongly direction-selective. C, D, A neuron with intermediate SI and DSI. E, F, A neuron with symmetric facilitation and no direction selectivity. Horizontal lines are as in Figure 4.
In the example shown in Figures 1B and 2, the tones were of 1 ms duration, and maximum facilitation occurred at a delay of +1 ms. Maximum facilitation occurred when the offset of the first tone coincided with the onset of the second tone, suggesting that the coincidence of subthreshold events generated by offset of the first tone and the onset of the second tone may cause facilitation. If this were the case, then facilitation should occur at longer delays when longer duration tones were used. To test this prediction, the duration of both the tones was increased in 23 of 46 facilitation neurons. In 7 of 23 (30%) neurons, facilitation occurred at the offset of the first tone. The neuron in Figure 3A showed asymmetric facilitation for a 39→34 kHz sequence regardless of whether the individual tone duration was 1, 3, or 5 ms. Peak facilitation occurred at 1, 3, and 5 ms delays for the 1, 3, and 5 ms tone duration, respectively. Figure 3B shows a second example of offset facilitation in which maximum facilitation occurred at 1, 6, and 10 ms delays for tones of 1, 5, and 10 ms duration. These data suggest that the coincidence of subthreshold events generated by the offset of the first tone and the onset of the second tone creates facilitation in these neurons.
Figure 3.

Types of facilitatory interactions. A, A neuron in which facilitation occurs at the offset of the first tone. Increasing the duration of the tones results in maximum facilitation at delays corresponding to the duration of the first tone. The horizontal lines show the summed responses to the different durations of individual tones. B, A second example of offset facilitation. C, A neuron in which facilitation occurred at a fixed delay regardless of the tone duration. D, A neuron in which facilitation occurred for tones with 1 ms duration but not for tones with 3 ms duration.
Maximum facilitation was not tied to the offset of the first tone in 8 of 23 (34.5%) neurons. The neuron in Figure 3C showed facilitation for the 35→31 kHz tone sequence. Maximum facilitation occurred at ∼1 ms delay regardless of whether the tone duration was 1, 3, or 5 ms. These data suggest that, in this neuron, facilitation was created by the coincidence of subthreshold onset events generated by the tones. In the remaining eight neurons, facilitation was observed only for the 1 ms tone durations and not for longer durations (Fig. 3D). In these eight neurons, it was not clear whether facilitation was tied to onset or offset.
Spectral range of facilitation
Figures 1–3 suggest that the frequencies eliciting facilitation were within 10 kHz of each other, suggesting that spectral integration occurs over a narrow range in these neurons. To more precisely determine this spectral range, multiple frequency pairs of 1 ms tones across the echolocation range (25–60 kHz) were tested in nine neurons. The lower frequency of the sequence was kept constant at 25 kHz, whereas the higher frequency was changed in 1 kHz steps between 25 and 60 kHz. The delay between the two tones was varied from 0.5–10 ms. The lower frequency was then increased by 1 or 2 kHz, and the previous step was repeated. Figure 4 shows the range of facilitatory frequencies of four neurons. These plots indicate the responses elicited by the two-tone sequence for different frequency combinations, all presented at a delay of 1 ms, which elicited maximum responses. For example, the neuron in Figure 4A was maximally facilitated for a 33→31 kHz high–low sequence. Two-tone facilitation was elicited only by frequencies that were within 6 kHz of each other. Attributable to asymmetrical facilitation, these “two-tone tuning curves” are skewed to favor the high→low sequence. In all of the neurons, the difference in frequencies eliciting facilitation was between 6 and 10 kHz.
Figure 4.

Spectral range of facilitation. A–D, Contour plots of facilitation frequency tuning curves from four different neurons. The response elicited by each two-tone sequence at 1 ms delay was normalized by the maximum response elicited by a frequency combination at 1 ms delay. The x and y axes show the low and high frequency, respectively, of a pair of tones. These figures show that the frequency difference between the two tones causing facilitation was <10 kHz, with closely spaced frequencies causing maximum facilitation.
Facilitatory interactions predict FM sweep direction selectivity
The asymmetries in facilitation favoring the high→low tone sequence would be expected to favor direction selectivity for the downward sweeps. To test whether there was a correlation between symmetry of facilitation and direction selectivity, FM sweep direction selectivity was tested in 36 neurons that showed two-tone facilitation. The degree of symmetry in facilitation was quantified using a symmetry index (SI). The SI was calculated for each neuron as the ratio of maximum response at negative and positive delays over a range of at least ±5 ms. The values of SI range between 0 and 1, with low values indicating a strong preference for the high→low sequence. Figure 5A shows a neuron with an SI = 0.36. The neuron was strongly selective for the downward sweep direction (DSI, 0.92) (Fig. 5B). Figure 5, C and D, shows a neuron with intermediate SI (0.52) and DSI (0.46). Figure 5, E and F, shows a neuron with symmetric facilitation (SI, 1) and no direction selectivity (DSI, 0.02).
There was a correlation between SI and DSI in the population of facilitation neurons (Fig. 6) (R2 = 0.74; p < 0.001). Seventy-four percent (29 of 39) of neurons had an SI ≤0.5. That is, these neurons showed at least twice the response to the positive delay than the negative delay. Most of these neurons (20 of 29, 69%) were direction-selective according to the DSI ≥0.6 criterion. The majority of neurons with SI >0.5 exhibited a DSI <0.3.
Figure 6.

Symmetry index and direction selectivity are correlated. Most neurons with SI <0.5 were direction-selective, whereas all neurons with SI >0.5 were not direction-selective.
It must be noted, however, that considerable variability exists in DSI for a given SI. This suggests that properties of facilitation cannot completely explain direction selectivity, and other mechanisms, such as sideband inhibition, may also contribute. In the pallid bat auditory cortex, an early arriving low-frequency inhibition (LFI) is known to shape direction selectivity (Razak and Fuzessery, 2006, 2007). However, because most facilitation neurons respond weakly to tones, it was possible to detect the presence of sideband inhibition using the two-tone inhibition over time test (see Materials and Methods) in only three neurons. All three neurons had an early arriving LFI (Fig. 7B).
Figure 7.

Contributions of multiple mechanisms to direction selectivity. A, The neuron showed asymmetric facilitation. The horizontal line indicates summed responses to individual tones. The tone duration used was 1 ms. B, The neuron also exhibited sideband inhibition (gray boxes), with LFI centered at 32 kHz and HFI centered at 43 kHz. The white rectangle shows the excitatory (+) frequency tuning curve. C, The neuron was strongly direction-selective when the sweeps included the LFI (50–30 kHz vs 30–50 kHz). D, The neuron was also direction-selective when the sweep was confined to the excitatory tuning curve (42–38 kHz vs 38–42 kHz). However, the DSI was lower for the narrowband sweeps compared with the broadband sweep suggesting that facilitation alone can shape direction selectivity, but multiple mechanisms are involved. E, F, A second example of a facilitation neuron showing direction selectivity even for narrowband sweeps confined within the excitatory tuning curve. In this case, the neuron was direction-selective for sweeps with 2 kHz BW.
To distinguish between sideband inhibition and facilitation as the mechanism of direction selectivity, we presented sweeps within the tuning curve, which excluded the sidebands. If sideband inhibition was the dominant mechanism, neurons should not be direction-selective for sweeps inside the excitatory tuning curve. If facilitation was dominant, neurons should remain direction-selective.
Of seven neurons, all continued to exhibit direction-selective responses for sweeps within the tuning curve, although the DSI decreased as the sweep BW decreased. Figure 7A shows a neuron with asymmetric facilitation (SI, 0.23). The neuron also had a band of LFI centered at 32 kHz and arriving 0.5 ms earlier than excitation (Fig. 7B). The neuron was completely direction-selective with a DSI = 1 (Fig. 7C). For sweeps within the tuning curve (42–38 kHz), the neuron still responded better to downward than upward sweeps, although the DSI decreased to 0.4 (Fig. 7D). The response to the 38–42 kHz upward sweep was similar to the response to the two-tone sequence with negative delays. These data suggest that asymmetric facilitation creates part of the direction selectivity, whereas LFI refines it further. Figure 7, E and F, shows a dramatic example of direction-selective responses within the tuning curve. The frequencies that elicited facilitation in this neuron were between 27 and 34 kHz. The neuron was direction-selective for broadband sweeps (50–20 kHz) (Fig. 7E). Even sweeps with 2 kHz BWs within the range of frequencies causing facilitation elicited direction-selective responses (Fig. 7F).
Facilitatory interactions predict downward FM rate selectivity
If facilitation underlies FM rate selectivity, then the spectrotemporal intervals generating facilitation should predict properties of rate selectivity. The assumption here is that selectivity for sweeps can be mimicked using two pure tones in the sweep delayed at an appropriate interval. Specifically, the following predictions were made: predicted best FM rate = [high frequency (HF) − low frequency (LF)]/delay of maximum facilitation (DMF); predicted 50% cutoff (CO) rate = (HF − LF)/50% delay, where HF and LF are the high and low frequencies in the two-tone sequence, DMF is the delay of maximum facilitation, and 50% delay is the delay at which the two-tone response decreases to 50% at increasing delays.
To test these predictions, the actual best FM rate and the 50% CO rate were measured from the rate selectivity functions (Fig. 8). The best rate (BR) of a neuron was the geometric center of rates that elicited >80% of maximum response. The 50% CO was the rate at which the response declined to 50% of maximum at slow rates.
Figure 8.

Properties of facilitation strongly predict FM rate selectivity. A, FM rate selectivity functions recorded at two different BW show that this neuron had a BR = 2.1 kHz/msec and 50% CO = 1.3 kHz/msec. These values are indicated by the vertical dashed arrows. B, The DMF and the 50% delay were used to predict the BR and the 50% CO rate of the same neuron shown in A. The horizontal dashed lines indicate the 80 and 50% of maximum response, whereas the vertical dashed lines indicate delays at which these responses occur. The predicted values are almost identical to actual measures of rate selectivity. C, Correlation between predicted and actual 50% CO rates. D, Correlation between predicted and actual BR.
For the example shown in Figure 8B, the predicted 50% CO rate is (32–30)/1.4 = 1.3 kHz/msec. This value was similar to the actual 50% CO rate (1.3 kHz/msec) (Fig. 8A) of this neuron. Across the population, there was a significant correlation between the predicted and actual 50% CO rate (Fig. 8C). It should be noted that the 50% delay can increase for longer durations, particularly among offset neurons, because the delay of maximum facilitation depends on the duration of the first tone (Fig. 3). All predictions in Figure 8C were based on facilitation curves obtained with 1 ms duration tones to maintain consistency across neurons in generating predictions, regardless of whether the neuron showed offset facilitation or not.
For two-tone facilitation to consistently predict 50% CO rate, the 50% delay must increase if the frequency interval between the two tones is increased. Figure 9A shows a neuron in which the 50% delay increased with frequency interval. Because of the different response magnitudes for different frequency combinations, normalized response magnitudes are shown to ease visualization of the 50% delay. The 50% delay was 1.8, 2.2, and 4.2 ms for frequency intervals of 3, 4, and 5 kHz, respectively. This resulted in predicted 50% CO rates of 1.6, 1.8, and 1.2 kHz/msec. The average predicted 50% CO (1.5 kHz/msec) was similar to the actual value of 1.3 kHz/msec in this neuron. Figure 9B shows a second example. The 50% delay was 1.9, 2.6, and 5.5 ms for frequency intervals of 2, 3, and 5 kHz, respectively. The predicted 50% CO rates were 1.1, 1.2, and 0.9 kHz/msec. The average of these values (1.1 kHz/msec) was similar to the actual 50% CO rate (1.3 kHz/msec). All eight neurons in which the 50% CO was predicted over multiple frequency intervals showed a similar consistency and accuracy in predicting 50% CO rate (Fig. 9C). These data show that the delays eliciting facilitation are not fixed but depend on the interval between the tone frequencies.
Figure 9.
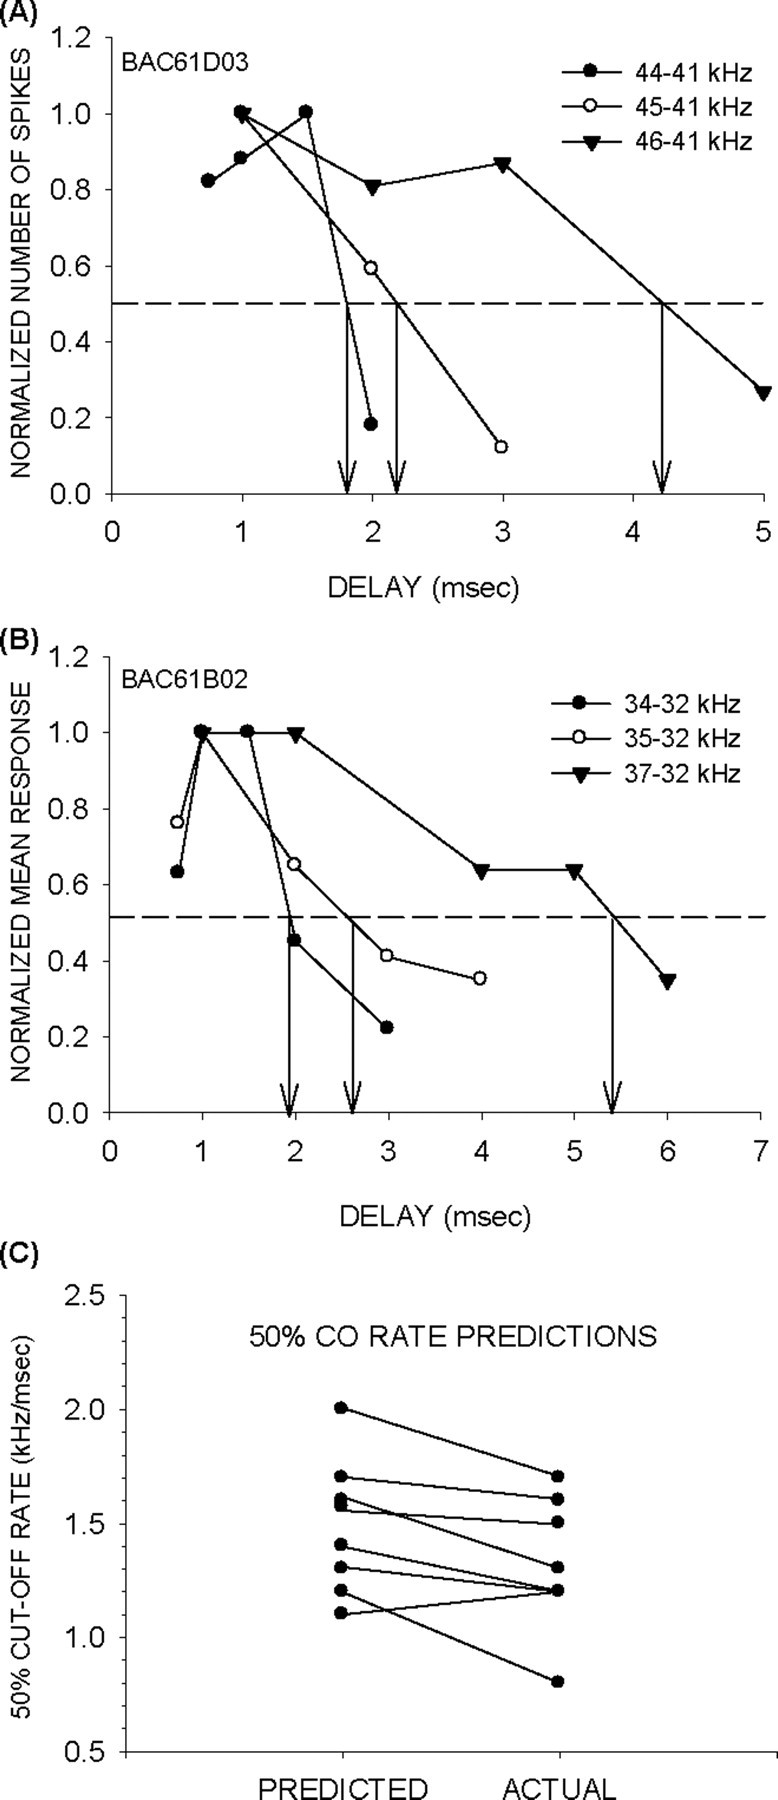
The 50% delay depends on the frequency interval. A, B, Two examples in which the delay (vertical arrows) at which the response decreased to 50% of maximum increased with frequency interval. The dashed line indicates the 50% response. C, Predicted versus actual 50% CO rates for the eight neurons from which 50% delays were measured at multiple frequency combinations.
The DMF predicted the BR. The DMF was calculated from the facilitation plot as the geometric center of delays that caused >80% of maximum response. The BR was predicted by dividing the frequency difference between the two tones that elicit facilitation by the DMF. For instance, the predicted BR of the neuron in Figure 8B is (32–30)/1 = 2 kHz/msec. This value closely matched the actual BR of the neuron (Fig. 8A). Across the population, there was a significant correlation between predicted and actual BR (Fig. 8D).
For consistent BR predictions, the DMF must increase with the frequency interval. In all (n = 10) neurons from which facilitation curves were measured at multiple frequency intervals, the DMF increased systematically with frequency difference. Also, in all neurons, the increase in DMF occurred because of a broadening of the facilitation curve. For example, in the neuron shown in Figure 10, increasing the frequency intervals caused facilitation functions to broaden. Figure 10, A and B, shows the raw and normalized data, respectively. The range of delays that produced >50% of maximum response increased with frequency intervals. Figure 10C shows the positive correlation between frequency intervals between the two tones and the 50% width of the facilitation curve (delays at which response was within 50% of maximum response). Figure 10D shows the positive correlation between the frequency interval and the DMF. The reciprocal of the slope of this function (in kilohertz per millisecond) is a value representing the frequency interval/delay combinations that elicit maximum facilitation. For FM sweeps, if the delay between any two frequencies in the sweep corresponds to the DMF of the neuron, there should be maximum response to that sweep. That is, the reciprocal of the slope of the “frequency interval versus DMF” function should correspond to the BR of the neuron. In the example shown in Figure 10, the predicted BR of the neuron is 2.9 kHz/msec (Fig. 10D). The actual BR of the neuron for downward sweeps was 2.8 kHz/msec.
Figure 10.
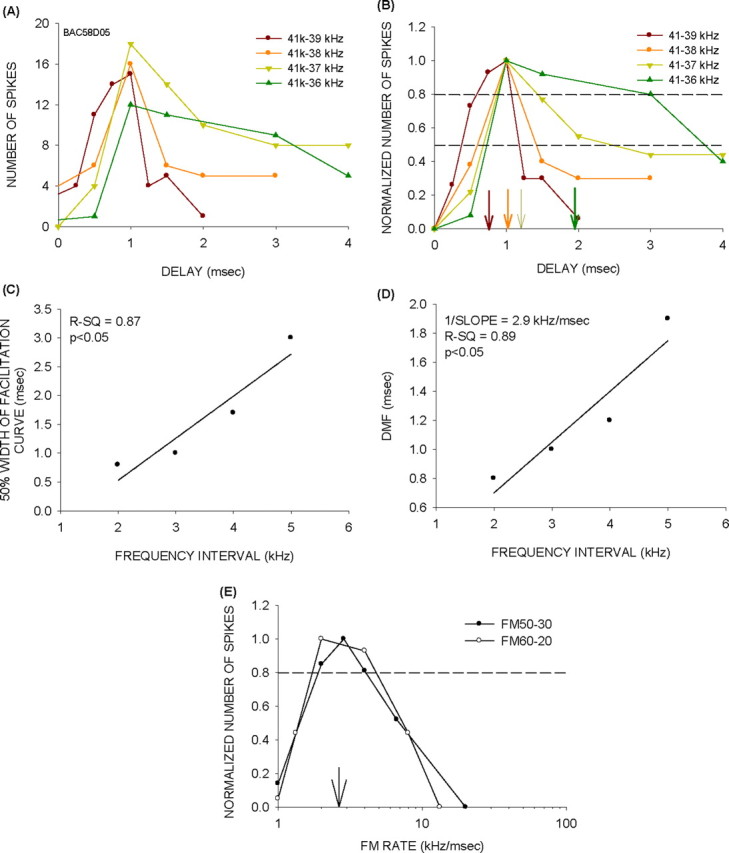
The range of delays eliciting facilitation increases with frequency interval between the two tones. A, Raw data from a neuron in which the facilitation curve became broader as the frequency interval was increased. B, Normalized data for the same neuron shown in A. The 50 and 80% of maximum responses are shown by horizontal lines. The vertical arrows point to the DMF at different frequency intervals. The arrows and the facilitation plots are gray-shade matched as indicated in the legend. C, The relationship between frequency interval and the 50% width of the facilitation curve. D, The relationship between frequency interval and DMF. The reciprocal of the slope of this function is the predicted BR. E, The FM rate selectivity functions recorded from the neuron. The arrow shows the actual BR of this neuron.
Two additional examples of the effect of increasing frequency interval on the 50% width of the facilitation curve and the DMF are shown in Figure 11A,D. In these examples, more than one data point is shown for some frequency intervals because these neurons were tested with the same frequency interval more than once but with different absolute frequencies (e.g., 38/36 kHz and 37/35 kHz both have a 2 kHz frequency interval, but the absolute frequencies are different). In both of these neurons, the 50% width and DMF increase systematically with frequency interval. The reciprocal of the slope of the frequency interval/DMF function (Fig. 11B,E) predicts BR of these neurons (Fig. 11C,F). Figure 11, G and H, shows the broadening and shifts in DMF with frequency interval for all 10 neurons. Figure 11I shows the similarity between predicted and actual BR. Thus, the range of delays that elicit maximum response is not fixed but increases as the frequency interval between the two tones increases.
Figure 11.

Best rate predictions. A, B, D, E, The relationship between frequency intervals and 50% width (A, D) and DMF (B, E) from two different neurons. B, C, E, F, The predicted BRs shown as the reciprocal of the slope of functions in B and E are closely matched to the actual BRs shown in C and F (arrows). G, H, Relationship of frequency interval and 50% width of facilitation curve (G) and DMF (H) in all 10 neurons. I, Predicted versus actual BR of 9 of 10 neurons from which facilitation curves were obtained at multiple frequency combinations. In one neuron, FM sweep selectivity was not recorded. The actual BR was therefore not known.
The role of facilitation in shaping rate selectivity was also tested in seven neurons by sweeping inside the facilitation tuning curve. If inhibitory sidebands were involved in shaping rate selectivity, rate tuning should be reduced for sweeps inside the tuning curve (Razak and Fuzessery, 2006). In the example shown (Fig. 12A), the BR and the 50% CO rate were similar whether a 60–20 kHz sweep or a 33–30 kHz sweep was used. The 34–29 kHz and 33–30 kHz sweeps were inside the tuning curve for this neuron (range of facilitatory frequencies was between 28 and 37 kHz). The neuron shown in Figure 12B was also rate selective for sweeps inside the tuning curve (range of facilitatory frequencies was between 27 and 34 kHz), but the BR and 50% CO rate changed with sweep BW. Figure 7, in addition to showing direction selectivity inside the excitatory tuning curve, also serves to provide further examples of rate selectivity for downward FM sweeps inside the tuning curve. In the example shown in Figure 7, C and D, rate selectivity properties were similar between the narrow and broadband downward FM sweeps. In the example shown in Figure 7, E and F, both BR and 50% CO rate were lower for the narrowband sweep.
Figure 12.

Facilitation shapes FM rate selectivity. A, The FM rate selectivity functions of a facilitation neuron. Regardless of whether broadband sweeps that start and end well outside the tuning curve or narrowband sweeps that are confined to the tuning curve are used, the FM rate selectivity is the same. B, This neuron was rate selective for sweeps confined to the tuning curve, but the BR and 50% CO rate were slower for the narrowband sweeps compared with the broadband sweep.
In all seven neurons tested, rate tuning was still present for sweeps inside the tuning curve, with similar tuning present in four neurons and BW-dependent changes in BR and 50% CO seen in the remaining three. These data suggest that facilitation alone can shape rate selective responses to downward FM sweeps.
Sensitivity of facilitation neurons
Facilitation neurons were sensitive to small differences in tone delays. For example, consider the facilitation function for the 34–33 kHz sequence in Figure 13A. This neuron responded maximally at ∼0.75 ms delay. The response then decreased to the summed tone response (Fig. 13A, dashed line) at 1.35 ms delay, indicating that the neuron was sensitive to delays that differed by only 600 μs. The neuron in Figure 13B showed even greater temporal sensitivity, with response decreasing from maximum to summed tone response with a delay change of 400 μs. To quantify the range of temporal sensitivity across the population, the minimum change in delay required to cause the response to decrease from maximum to the summed tone response was measured at a 1 kHz frequency difference between the tones in eight neurons. Temporal sensitivity ranged between 300 and 1100 μs (mean 720 ± 26 μs; n = 8).
Figure 13.

Facilitation neurons show strong sensitivity to sub-millisecond differences in delay. A, B, The dashed lines indicate the summed tone responses. The response of these two neurons decreases from maximum to the summed tone response for difference in delays in the 100s of microsecond range.
Discussion
This study provides the first evidence for facilitation as a mechanism for FM rate and direction selectivity. The facilitation neurons show remarkable sensitivity to frequency-delay combinations. The main finding is that facilitatory responses to linear combinations of tones strongly predict selectivity for the direction and rate of FM sweeps. Moreover, the range of delays that elicit facilitation is not fixed but increases with frequency interval between the two tones in a way that consistently predicts rate selectivity.
Possible mechanisms of facilitation
Three main types of facilitatory interactions were observed in this study. In nearly 30% of the neurons, increasing the durations of the two tones resulted in a systematic delay of the DMF to coincide with the offset of the leading tone. In another 30% of neurons, regardless of the duration of the tones, the DMF was ∼1 ms. In the remaining neurons, facilitation was observed only for short duration tones. One possible mechanism for the first type of facilitation is coincidence of rebound from inhibition generated by offset of the leading tone with the depolarization generated by the onset of the lagging tone (Margoliash, 1983; Hattori and Suga, 1997; Covey and Casseday, 1999; Nataraj and Wenstrup, 2005). The hypothesis is that the leading sound onset generates an IPSP. The IPSP lasts the duration of the first tone and produces a rebound depolarization at sound offset. This rebound coincides with a depolarization triggered by the onset of the lagging tone to generate spikes. The fact that the DMF shifts to coincide with leading tone offset suggests that the rebound depolarization occurs at leading tone offset.
Margoliash (1983) suggested that a coincidence of rebound from inhibition generated by one syllable and excitation from another syllable might shape order selectivity in birdsong. Nataraj and Wenstrup (2005) showed that a coincidence of postinhibitory rebound excitation can underlie facilitation in the mustached bat inferior colliculus (IC). Their evidence that blocking inhibition actually reduces facilitation supports this notion. A mechanism suggested to underlie such postinhibitory facilitation is the hyperpolarization-induced reduction of a low-threshold potassium conductance which causes a transient increase in excitability (Dodla et al., 2006). The low-threshold T-type Ca2+ ion channel also plays a role in postinhibitory rebound depolarization (Sun and Wu, 2008).
The second type of facilitation, wherein the maximum response occurs at ∼1 ms regardless of tone duration, may arise resulting from coincidence of subthreshold EPSPs generated by the onset of the two tones. A delay of 1 ms between the two tones causes maximum facilitation. This fact suggests that the latency of the EPSP generated by the first tone may be delayed by ∼1 ms relative to the latency of the EPSP generated by the second tone. Also, the fact that the high→low sequence elicited facilitation in most neurons suggests a gradient of increasing latency with increasing frequencies within the receptive field. In the reverse direction, the input from the low-frequency tone arrives before the input from the high-frequency tone, and facilitation does not occur. Alternatively, this facilitation may also occur because of rebound from IPSPs generated by stimulus onset, but lasting <1 ms regardless of the tone durations.
Where such theoretical facilitatory mechanisms might originally create this delay sensitivity is not clear. Although the auditory cortex is reported to show increased temporal precision under the anesthesia used in this study (Ter-Mikaelian et al., 2007), the same facilitatory properties are present in the pallid bat IC (Z. M. Fuzessery, M. D. Richardson, A. J. Williams, unpublished data), suggesting that the auditory cortex may inherit its delay sensitivity from lower levels of the auditory system.
The presence of a relationship (spectrotemporal inseparability) between frequency and latency within the receptive field has been reported in both auditory cortex (deCharms et al., 1998; Depireux et al., 2001; Linden et al., 2003) and IC (Langner et al., 1987; Andoni et al., 2007). Studies in the IC of bats have suggested that such frequency-latency relationships may give rise to FM sweep selectivity (Andoni et al., 2007; Voytenko and Galazyuk, 2007). Modification of the differences in latency across frequencies can give rise to selectivity for different FM rates and direction. Thus, facilitation can generate selectivity for both sweep direction and a wide range of FM sweep rates present in species-specific vocalizations.
Comparison with combination sensitive interactions observed in other species
Neural selectivity for the temporal relationship between different acoustic elements has been observed in several species (Suga, 1973; Glass and Wollberg, 1983; Margoliash, 1983; McKenna et al., 1989). The best studied examples include frogs, songbirds, and bats. In the frog midbrain (Alder and Rose, 1998) and songbird forebrain (Lewicki and Konishi, 1995), the integration appears to occur over a long time window (10s to 100s of milliseconds). Margoliash (1983) also showed that song-selective neurons integrate pairs of song components separated by 10s to 100s of milliseconds but do not respond to individual components. The long temporal integration may generate selectivity for species-typical communication calls with durations of several hundred milliseconds. In bats, neurons involved in target ranging show facilitation for combinations of two components of the echolocation calls with specific delays between them (O'Neill and Suga, 1982; Portfors and Wenstrup, 1999). The delay-tuned neurons appear to be sensitive to delays between 1 and 20 ms, with a resolution of a few milliseconds. In addition, delay tuned neurons typically integrate information across frequencies that are multiple octaves apart. Such integration shapes selectivity for harmonic combinations in communication calls or pulse-echo processing in echolocation.
The facilitation neurons in the pallid bat cortex differ in three key aspects from the previously discussed combination sensitive neurons. First, they have temporal resolution in the 100s of microseconds and appear to be specialized to generate selectivity for fast downward FM sweeps. Second, these neurons integrate information over a narrow range of frequencies. Third, their range of best delays is not fixed but increases with frequency interval in a way that predicts consistent rate selectivity. Thus, these neurons are sensitive to a specific combination of frequency and time intervals generated by FM sweeps. All neurons tested show changes in range of DMF with frequency interval in a way that predicts consistent values of best FM rates, suggesting that they are specialized to process the FM sweeps used in echolocation.
Thus, comparisons across all of these species suggest that their auditory systems incorporate a wide range of temporal resolution (from 100s of microseconds to 100s of milliseconds) and spectral integration (from fractions of an octave to multiple octaves) to represent species-specific vocalizations (Grothe and Klump, 2000).
Similar mechanisms for analogous response properties across sensory systems
In the auditory cortex, both facilitation (this study) and sideband inhibition (Suga, 1965; Zhang et al., 2003; Razak and Fuzessery, 2006) are involved in shaping sweep selectivity. In the IC, in addition to sideband inhibition (Fuzessery and Hall, 1996; Gordon and O'Neill, 1998; Fuzessery et al., 2006), FM sweep selectivity depends on duration tuning (Fuzessery et al., 2006). The present study shows that sideband inhibition can enhance selectivity shaped by facilitation, indicating that multiple mechanisms may interact to give rise to FM sweep selectivity in individual neurons. Together, these studies suggest that there are at least three different mechanisms shaping FM sweep selectivity in the auditory system. In the mammalian visual system, similar mechanisms have been shown to shape movement direction and velocity selectivity (Goodwin and Henry, 1978; Movshon et al., 1978; Patel and Sillito, 1978; Duysens et al., 1985a,b; Jagadeesh et al., 1993; Livingstone, 1998; Murthy and Humphrey, 1999; Fried et al., 2005; Razak and Pallas, 2005). The difference appears to be in the relative extent to which each of these mechanisms contributes to selectivity in the different sensory systems. This suggests common computational solutions in terms of neural circuitry (Douglas and Martin, 2007) across sensory systems and species that shape selectivity for analogous stimulus patterns.
Footnotes
This work was supported by National Institute on Deafness and Other Communication Disorders Grant DC05202 and IDeA Network of Biomedical Research Excellence Grant P20 RR0 16474-04. We thank T. Zumsteg for valuable comments on this manuscript and G. McLellan for programming the software required for this study.
References
- Alder TB, Rose GJ. Long-term temporal integration in the anuran auditory system. Nat Neurosci. 1998;1:519–523. doi: 10.1038/2237. [DOI] [PubMed] [Google Scholar]
- Andoni S, Li N, Pollak GD. Spectrotemporal receptive fields in the inferior colliculus revealing selectivity for spectral motion in conspecific vocalizations. J Neurosci. 2007;27:4882–4893. doi: 10.1523/JNEUROSCI.4342-06.2007. [DOI] [PMC free article] [PubMed] [Google Scholar]
- Brosch M, Schreiner CE. Time course of forward masking tuning curves in cat primary auditory cortex. J Neurophysiol. 1997;77:923–943. doi: 10.1152/jn.1997.77.2.923. [DOI] [PubMed] [Google Scholar]
- Calford MB, Semple MN. Monaural inhibition in cat auditory cortex. J Neurophysiol. 1995;73:1876–1891. doi: 10.1152/jn.1995.73.5.1876. [DOI] [PubMed] [Google Scholar]
- Covey E, Casseday JH. Timing in the auditory system of the bat. Annu Rev Physiol. 1999;61:457–476. doi: 10.1146/annurev.physiol.61.1.457. [DOI] [PubMed] [Google Scholar]
- deCharms RC, Blake DT, Merzenich MM. Optimizing sound features for cortical neurons. Science. 1998;280:1439–1443. doi: 10.1126/science.280.5368.1439. [DOI] [PubMed] [Google Scholar]
- Depireux DA, Simon JZ, Klein DJ, Shamma SA. Spectro-temporal response field characterization with dynamic ripples in ferret primary auditory cortex. J Neurophysiol. 2001;85:1220–1234. doi: 10.1152/jn.2001.85.3.1220. [DOI] [PubMed] [Google Scholar]
- Dodla R, Svirskis G, Rinzel J. Well-timed, brief inhibition can promote spiking: postinhibitory facilitation. J Neurophysiol. 2006;95:2664–2677. doi: 10.1152/jn.00752.2005. [DOI] [PMC free article] [PubMed] [Google Scholar]
- Douglas RJ, Martin KAC. Mapping the matrix: the ways of neocortex. Neuron. 2007;56:226–238. doi: 10.1016/j.neuron.2007.10.017. [DOI] [PubMed] [Google Scholar]
- Duysens J, Orban GA, Cremieux J. Velocity selectivity in the cat visual system. II. Independence from interactions between different loci. J Neurophysiol. 1985a;54:1050–1067. doi: 10.1152/jn.1985.54.4.1050. [DOI] [PubMed] [Google Scholar]
- Duysens J, Orban GA, Cremieux J, Maes H. Velocity selectivity in the cat visual system. III. Contribution of temporal factors. J Neurophysiol. 1985b;54:1068–1083. doi: 10.1152/jn.1985.54.4.1068. [DOI] [PubMed] [Google Scholar]
- Fried SI, Münch TA, Werblin FS. Directional selectivity is formed at multiple levels by laterally offset inhibition in the rabbit retina. Neuron. 2005;46:117–127. doi: 10.1016/j.neuron.2005.02.007. [DOI] [PubMed] [Google Scholar]
- Fuzessery ZM. Monaural and binaural spectral cues created by the external ears of the pallid bat. Hear Res. 1996;95:1–17. doi: 10.1016/0378-5955(95)00223-5. [DOI] [PubMed] [Google Scholar]
- Fuzessery ZM, Hall JC. The role of GABA in shaping frequency tuning and selectivity for FM sweep direction in the inferior colliculus. J Neurophysiol. 1996;76:1059–1073. doi: 10.1152/jn.1996.76.2.1059. [DOI] [PubMed] [Google Scholar]
- Fuzessery ZM, Gumtow RG, Lane R. A microcomputer-controlled system for use in auditory physiology. J Neurosci Methods. 1991;36:45–52. doi: 10.1016/0165-0270(91)90136-n. [DOI] [PubMed] [Google Scholar]
- Fuzessery ZM, Richardson MD, Coburn MS. Neural mechanisms underlying selectivity for the rate and direction of frequency-modulated sweeps in the inferior colliculus of the pallid bat. J Neurophysiol. 2006;96:1320–1336. doi: 10.1152/jn.00021.2006. [DOI] [PubMed] [Google Scholar]
- Glass I, Wollberg Z. Auditory cortex responses to sequences of normal and reversed squirrel monkey vocalizations. Brain Behav Evol. 1983;22:13–21. doi: 10.1159/000121503. [DOI] [PubMed] [Google Scholar]
- Goodwin AW, Henry GH. The influence of stimulus velocity on the responses of single neurones in the striate cortex. J Physiol. 1978;277:467–482. doi: 10.1113/jphysiol.1978.sp012285. [DOI] [PMC free article] [PubMed] [Google Scholar]
- Gordon M, O'Neill WE. Temporal processing across frequency channels by FM selective auditory neurons can account for FM rate selectivity. Hear Res. 1998;122:97–108. doi: 10.1016/s0378-5955(98)00087-2. [DOI] [PubMed] [Google Scholar]
- Grothe B, Klump GM. Temporal processing in sensory systems. Curr Opin Neurobiol. 2000;10:467–473. doi: 10.1016/s0959-4388(00)00115-x. [DOI] [PubMed] [Google Scholar]
- Hart HC, Palmer AR, Hall DA. Amplitude and frequency-modulated stimuli activate common regions of human auditory cortex. Cereb Cortex. 2003;13:773–781. doi: 10.1093/cercor/13.7.773. [DOI] [PubMed] [Google Scholar]
- Hattori T, Suga N. The inferior colliculus of the mustached bat has the frequency-vs-latency coordinates. J Comp Physiol. 1997;180:271–284. doi: 10.1007/s003590050047. [DOI] [PubMed] [Google Scholar]
- Heil P, Irvine DR. Functional specialization in auditory cortex: responses to frequency-modulated stimuli in the cat's posterior auditory field. J Neurophysiol. 1998;79:3041–3059. doi: 10.1152/jn.1998.79.6.3041. [DOI] [PubMed] [Google Scholar]
- Heil P, Langner G, Scheich H. Processing of frequency-modulated stimuli in the chick auditory cortex analogue: evidence for topographic representations and possible mechanisms of rate and directional sensitivity. J Comp Physiol. 1992;171:583–600. doi: 10.1007/BF00194107. [DOI] [PubMed] [Google Scholar]
- Jagadeesh B, Wheat HS, Ferster D. Linearity of summation of synaptic potentials underlying direction selectivity in simple cells of the cat visual cortex. Science. 1993;262:1901–1904. doi: 10.1126/science.8266083. [DOI] [PubMed] [Google Scholar]
- Kowalski N, Versnel H, Shamma SA. Comparison of responses in the anterior and primary auditory fields of the ferret cortex. J Neurophysiol. 1995;73:1513–1523. doi: 10.1152/jn.1995.73.4.1513. [DOI] [PubMed] [Google Scholar]
- Langner G, Schreiner C, Merzenich MM. Covariation of latency and temporal resolution in the inferior colliculus of the cat. Hear Res. 1987;31:197–201. doi: 10.1016/0378-5955(87)90127-4. [DOI] [PubMed] [Google Scholar]
- Lewicki MS, Konishi M. Mechanisms underlying the sensitivity of songbird forebrain neurons to temporal order. Proc Natl Acad Sci U S A. 1995;92:5582–5586. doi: 10.1073/pnas.92.12.5582. [DOI] [PMC free article] [PubMed] [Google Scholar]
- Linden JF, Liu RC, Sahani M, Schreiner CE, Merzenich MM. Spectrotemporal structure of receptive fields in areas AI and AAF of mouse auditory cortex. J Neurophysiol. 2003;90:2660–2675. doi: 10.1152/jn.00751.2002. [DOI] [PubMed] [Google Scholar]
- Livingstone MS. Mechanisms of direction selectivity in macaque V1. Neuron. 1998;20:509–526. doi: 10.1016/s0896-6273(00)80991-5. [DOI] [PubMed] [Google Scholar]
- Margoliash D. Acoustic parameters underlying the responses of song-specific neurons in the white-crowned sparrow. J Neurosci. 1983;3:1039–1057. doi: 10.1523/JNEUROSCI.03-05-01039.1983. [DOI] [PMC free article] [PubMed] [Google Scholar]
- McKenna TM, Weinberger NM, Diamond DM. Responses of single auditory cortical neurons to tone sequences. Brain Res. 1989;481:142–153. doi: 10.1016/0006-8993(89)90494-0. [DOI] [PubMed] [Google Scholar]
- Mendelson JR, Schreiner CE, Sutter ML, Grasse KL. Functional topography of cat primary auditory cortex: responses to frequency-modulated sweeps. Exp Brain Res. 1993;94:65–87. doi: 10.1007/BF00230471. [DOI] [PubMed] [Google Scholar]
- Movshon JA, Thompson ID, Tolhurst DJ. Spatial summation in the receptive fields of simple cells in the cat's striate cortex. J Physiol. 1978;283:53–77. doi: 10.1113/jphysiol.1978.sp012488. [DOI] [PMC free article] [PubMed] [Google Scholar]
- Murthy A, Humphrey AL. Inhibitory contributions to spatiotemporal receptive-field structure and direction selectivity in simple cells of cat area 17. J Neurophysiol. 1999;81:1212–1224. doi: 10.1152/jn.1999.81.3.1212. [DOI] [PubMed] [Google Scholar]
- Nataraj K, Wenstrup JJ. Roles of inhibition in creating complex auditory responses in the inferior colliculus: facilitated combination-sensitive neurons. J Neurophysiol. 2005;93:3294–3312. doi: 10.1152/jn.01152.2004. [DOI] [PubMed] [Google Scholar]
- Nelken I, Versnel H. Responses to linear and logarithmic frequency-modulated sweeps in ferret primary auditory cortex. Eur J Neurosci. 2000;12:549–562. doi: 10.1046/j.1460-9568.2000.00935.x. [DOI] [PubMed] [Google Scholar]
- O'Neill WE, Brimijoin WO. Directional selectivity for FM sweeps in the suprageniculate nucleus of the mustached bat medial geniculate body. J Neurophysiol. 2002;88:172–187. doi: 10.1152/jn.00966.2001. [DOI] [PMC free article] [PubMed] [Google Scholar]
- O'Neill WE, Suga N. Encoding of target range and its representation in the auditory cortex of the mustached bat. J Neurosci. 1982;2:17–31. doi: 10.1523/JNEUROSCI.02-01-00017.1982. [DOI] [PMC free article] [PubMed] [Google Scholar]
- Patel HH, Sillito AM. Inhibition and velocity tuning in the cat visual cortex [proceedings] J Physiol. 1978;284:113P–114P. [PubMed] [Google Scholar]
- Phillips DP, Mendelson JR, Cynader MS, Douglas RM. Responses of single neurones in cat auditory cortex to time-varying stimuli: frequency-modulated tones of narrow excursion. Exp Brain Res. 1985;58:443–454. doi: 10.1007/BF00235862. [DOI] [PubMed] [Google Scholar]
- Portfors CV, Wenstrup JJ. Delay-tuned neurons in the inferior colliculus of the mustached bat: implications for analyses of target distance. J Neurophysiol. 1999;82:1326–1338. doi: 10.1152/jn.1999.82.3.1326. [DOI] [PubMed] [Google Scholar]
- Razak KA, Fuzessery ZM. Functional organization of the pallid bat auditory cortex: emphasis on binural organization. J Neurophysiol. 2002;87:72–86. doi: 10.1152/jn.00226.2001. [DOI] [PubMed] [Google Scholar]
- Razak KA, Fuzessery ZM. Neural mechanisms underlying selectivity for the rate and direction of frequency modulated sweeps in the auditory cortex of the pallid bat. J Neurophysiol. 2006;96:1303–1319. doi: 10.1152/jn.00020.2006. [DOI] [PubMed] [Google Scholar]
- Razak KA, Fuzessery ZM. Development of inhibitory mechanisms underlying selectivity for the rate and direction of frequency-modulated sweeps in the auditory cortex. J Neurosci. 2007;27:1769–1781. doi: 10.1523/JNEUROSCI.3851-06.2007. [DOI] [PMC free article] [PubMed] [Google Scholar]
- Razak KA, Pallas SL. Neural mechanisms of stimulus velocity tuning in the superior colliculus. J Neurophysiol. 2005;94:3573–3589. doi: 10.1152/jn.00816.2004. [DOI] [PMC free article] [PubMed] [Google Scholar]
- Segev I, Rall W. Excitable dendrites and spines: earlier theoretical insights elucidate recent direct observations. Trends Neurosci. 1998;21:453–460. doi: 10.1016/s0166-2236(98)01327-7. [DOI] [PubMed] [Google Scholar]
- Suga N. Functional properties of auditory neurons in the cortex of echolocating bats. J Physiol. 1965;181:67l–700. doi: 10.1113/jphysiol.1965.sp007791. [DOI] [PMC free article] [PubMed] [Google Scholar]
- Suga N. Feature extraction in the auditory system of bats. In: Moller AR, editor. Basic mechanisms in hearing. New York: Academic; 1973. pp. 675–712. [Google Scholar]
- Sun H, Wu SH. Physiological characteristics of postinhibitory rebound depolarization in neurons of the rat's dorsal cortex of the inferior colliculus studied in vitro. Brain Res. 2008 doi: 10.1016/j.brainres.2008.06.010. in press. [DOI] [PubMed] [Google Scholar]
- Taniguchi I, Niwa H, Wong D, Suga N. Response properties of FM-FM combination-sensitive neurons in the auditory cortex of the mustached bat. J Comp Physiol. 1986;159:331–337. doi: 10.1007/BF00603979. [DOI] [PubMed] [Google Scholar]
- Ter-Mikaelian M, Sanes DH, Semple MN. Transformation of temporal properties between auditory midbrain and cortex in the awake Mongolian gerbil. J Neurosci. 2007;27:6091–6102. doi: 10.1523/JNEUROSCI.4848-06.2007. [DOI] [PMC free article] [PubMed] [Google Scholar]
- Tian B, Rauschecker JP. Processing of frequency-modulated sounds in the lateral auditory belt cortex of the rhesus monkey. J Neurophysiol. 2004;92:2993–3013. doi: 10.1152/jn.00472.2003. [DOI] [PubMed] [Google Scholar]
- Voytenko SV, Galazyuk AV. Intracellular recording reveals temporal integration in inferior colliculus neurons of awake bats. J Neurophysiol. 2007;97:1368–1378. doi: 10.1152/jn.00976.2006. [DOI] [PubMed] [Google Scholar]
- Zhang LI, Tan AY, Schreiner CE, Merzenich MM. Topography and synaptic shaping of direction selectivity in primary auditory cortex. Nature. 2003;424:201–205. doi: 10.1038/nature01796. [DOI] [PubMed] [Google Scholar]