

Abstract
Multimeric ligands are ligands that contain multiple binding domains that simultaneously target multiple cell surface proteins. Due to cooperative binding, multimeric ligands can have high avidity for cells (tumor) expressing all targeting proteins and only show minimal binding to cells (normal tissues) expressing none or only some of the targets. Identifying combinations of targets that concurrently express in tumor cells, but not in normal cells is a challenging task. Here, we describe a novel approach for identifying such combinations using genome-wide gene expression profiling followed by immunohistochemistry. We first generated a database of mRNA gene expression profiles for 28 pancreatic cancer specimens and 103 normal tissue samples representing 28 unique tissue/cell types using DNA microarrays. The expression data for genes that encode proteins with cell surface epitopes were then extracted from the database and analyzed using a novel multivariate rule-based computational approach to identify gene combinations that are expressed at an efficient binding level in tumors, but not in normal tissues. These combinations were further ranked according to the proportion of tumor samples that expressed the sets at efficient levels. Protein expression of the genes contained in the top ranked combinations was confirmed using immunohistochemistry on a pancreatic tumor tissue and normal tissue microarrays. Co-expression of targets was further validated by their combined expression in pancreatic cancer cell lines using immunocytochemistry. These validated gene combinations thus encompass a list of cell surface targets that can be used to develop multimeric ligands for the imaging and treatment of pancreatic cancer.
Keywords: target combinations, pancreatic cancer, multimeric ligands, DNA microarray, tissue microarray
INTRODUCTION
Using peptide-based ligands to target imaging or therapeutic agents to the surface of tumor cells is an actively investigated area of research. Several such ligands were developed and have shown very promising results in animal models and, in some cases were successfully tested in humans. A series of RGD peptide-based ligands coupled with a variety of proteins, peptides, small molecules, nucleic acids and radiotracers were developed to deliver therapeutics and imaging agents to tumor vasculature (1). Recently, the 18F-Galacto-RGD ligand was tested in humans and showed highly desirable pharmacokinetics and good visualization of the αvβ3-integrin expression with PET scanning (2, 3). Radiolabeled monoclonal antibodies that target cell surface antigens have been approved for the treatment of B-cell non-Hodgkin's lymphoma (4). However, results of using such antibody conjugates in the treatment of solid tumors are less encouraging (5, 6).
One major limitation of monomeric ligand based agents is that the cell surface targets must be highly expressed in tumor cells relative to normal tissues, which rarely occurs. As a possible solution, several groups are developing multivalent ligands containing multiple binding domains that target two or more separate proteins on the cell surface (7-12). Most multimeric ligands developed have been homomultimers (7, 10) . Heteromultivalent ligands have also been attempted (9). Recently, we prepared heterodimeric ligands that simultaneously targeted both the human δ-opioid and melanocortin receptors, which demonstrated up to a 50-fold increase in binding (13).
One challenge facing the development of multivalent ligands is the identification of cell-surface target combinations that are expressed concurrently in tumor cells but not in normal cells. It is conceivable that a single target will only be expressed in a fraction of patients' tumors. It is therefore very likely that there will be even less of a percentage of patients' tumors expressing a combination of targets. This suggests that a collection of multimeric ligands might be needed to treat all patients with the same general classification of disease, e.g. pancreatic cancer. Therefore, the successful development of a therapeutically useful multimeric ligand requires a systematic approach to identify combinations of cell surface targets that may be broadly applicable over large subsets of patients.
The ideal approach to identify protein targets would be a systematic direct survey comparing cell surface protein levels in normal and tumor tissues. Although advances in proteomic technology have made it possible for genome-wide protein profiling, it is still very difficult to completely and quantitatively elucidate all cell surface proteins. The main technological pitfall is that the majority of cell surface proteins are either plasma membrane bound or integral to the membrane, which renders the traditional 2-dimensional gel electrophoresis ineffective in resolving them. Recent reports describe new affinity tagging or radioisotope labeling to separate cell surface proteins from other cellular proteins. The number of cell surface proteins detected by these methods varies dramatically from a few to several hundreds depending on sample and detection methods used (14, 15). The number of plasma membrane proteins that can be measured quantitatively is even smaller (16). Overall, only a small percentage of cell surface proteins can be quantitatively detected by the most advanced proteomics technology currently available. Additional difficulties occur when applying proteomic analysis directly to tissue samples (17).
DNA microarray, a systematic approach for detecting mRNA transcripts, is considerably more mature compared to the current proteomics technology and is thus an attractive alternative for identifying expression of cell surface proteins. Nonetheless, there are potential limitations in using DNA microarrays to identify cell surface targets. For instance, it is generally known that mRNA and protein levels are not necessarily correlated. However, there is some evidence to indicate that levels of transcript and protein may have a greater correlation for cell surface gene products compared to products localized in other parts of the cell. Loyet and colleagues found that in human primary T helper cells, only 6 out of 38 (16%) of membrane proteins showed differences between the protein and transcript levels (16). Although it is impossible to eliminate these limitations, we postulated that by performing secondary validation assays at the protein level, such as immunohistochemistry, they could be greatly alleviated.
Herein, we describe the development of a multivariate computational method for identifying target combinations. Using this method, we have identified a list of lead target combinations that can be used for the development of multimeric ligands. Targets of two different combinations were validated using tissue microarray (TMA) based immunohistochemistry and were further validated by quantifying their combined expression in pancreatic cancer cell lines.
MATERIALS AND METHODS
Tissue specimens and RNA samples
Eight fresh frozen pancreatic adenocarcinoma (PanAdo) tissues and 4 normal pancreas tissues were obtained from the Tissue Acquisition Shared Service at the Arizona Cancer Center. Microarray data for a second set of 20 PanAdo tissue samples were obtained from the Molecular Profiling Institute (Phoenix, Arizona). RNA samples for normal tissues representing 28 different organ sites were purchased from Biochain (Hayward, CA) and Stratagene (La Jolla, CA). Paraffin embedded pancreatic tissues were obtained from the Biospecimen Repository Core of the Pancreatic Cancer P01 project (CA109552) at Translational Genomics Research Institute. All tissues samples were provided without patient identifiers or personal information, and an institutional review board (IRB) exemption was obtained for their use.
Gene expression analysis using DNA Microarrays
Total RNA was isolated from fresh frozen tissues using the RNAeasy kit (Qiagen, Valencia, CA). Microarray analyses, including target labeling and chip hybridization and processing, were carried out following manufacturer recommended protocols (Agilent Technologies, Palo Alto, CA). Briefly, 1 μg of total RNA was used to generate CY5 cRNA targets using the Agilent low input RNA fluorescent linear amplification kit. RNA samples isolated from normal pancreas were labeled with CY3 to serve as a reference. In some cases, normal tissues were run on the CY3 channel and a tumor sample (from the same organ type as the normal tissue) was run on the CY5 channel. The concentration and integrity of fluorescent cRNA were analyzed using the Agilent 2100 Bioanalyzer. Equal amounts of labeled cRNA targets from the sample and the reference were then hybridized onto the Agilent Human 1A oligonucleotide arrays. Hybridization signals were acquired and normalized using Agilent's Feature Extraction software (v.7.1). DNA microarray profiles for pancreatic cell lines, obtained from ATCC, were generated by the same procedure using total RNA isolated from cells grown to ∼80% confluence.
Compilation of a cell-surface gene database
A list of genes encoding proteins with cell surface epitopes was compiled by first manually browsing through the entire GO (Gene Ontology) hierarchical vocabulary using the CGAP (Cancer Genome Anatomy Project) GO browser. Each category was followed through the hierarchy to the lowest possible level in order to select lists of genes encoding proteins with cell-surface epitopes, while excluding lists that did not include cell-surface proteins. A combined list of 6,389 genes was compiled. Genes that are not represented on the Agilent Human 1A arrays were removed and the resulting list contained 4,407 genes. Each of those genes were manually checked using information from existing databases (Genecard, Harvester, Entrez, Protein Database and UniProt) to assure they encode cell surface proteins. Genes known to- or predicted to-encode cell-surface products by similarity/homology were retained. Those known not to be cell-surface, or if the sub-cellular localization was not determinable, were removed. Our final list contains a total of 2177 genes on the Agilent Human 1A V2 and 1928 genes on the 1A V1 chip (Supplementary Table 1).
Cluster Analysis
Hierarchical clustering (agglomerative procedure) was used to generate dendrograms from the median normalized microarray expression data by assembling all tissue samples into a single tree based on their similarities. The clustering algorithm was based on the average-linkage method as previously described (18). Since our tissue samples included 28 normal tissue types and the PanAdo tissue group, the repetitive clustering process was stopped when 29 groups were formed.
Tissue microarray construction and immunohistochemistry
Formalin-fixed paraffin embedded tissues were first examined with H&E staining using whole sections to identify pathologically distinct areas of interest (tumor, adjacent normal and normal). TMAs were constructed by punching 1.0 mm discs and re-embedding them into a new paraffin block (19-22). Each TMA block was cut into 5μm sections and H & E staining was performed on every 50th section to assess retention of desired pathologies. TMA slides for normal tissues in 0.6 mm spot sizes (Version CHTN2002N1) were provided by the Cooperative Human Tissue Network funded by NCI/NIH.
To optimize staining conditions, antibodies were titrated against regular tissue sections and ‘tester’ TMA slides containing a variety of tumor and normal tissues. TMA slides were first subjected to antigen retrieval by heating at 100°C in citrate buffer (0.1M, pH 6.0) for 5-30 min, depending on the antibody. Slides were then incubated with primary antibodies at optimal dilutions for 30 minutes at room temperature. Biotinylated secondary antibodies were applied, followed by streptavidin-peroxidase complex (Vision BioSystems, Novell, MA) and resolved with diaminobenzidine chromogen. Stained slides were evaluated using light microscopy and scored (0 = negative to 3+ = intensely positive) by a board-certified pathologist (G.H.). Primary antibodies and dilutions used were: rabbit anti-PTPRR (Orbigen, San Diego, CA), 1:100; rabbit anti-SLC2A13 (US Biological, Swampscott, MA), 1:300; mouse anti-PCDHB10 (Abnova, Teipei, ROC), 1:75; and rabbit anti-IL1RAP (Abcam, Cambridge, MA), 1:150.
Quantitative Real-Time RT-PCR
Quantitative real-time RT-PCR (qRT-PCR) was performed as previously described (23) with the following changes. Primer sets were designed to generate cDNA and perform RT-PCR from ACTB (β-actin), IL1RAP, PCDHB10, PTPRR, and SLC2A13 mRNA. PCR conditions were determined so that maximum yield without spurious priming was achieved. RT-PCR was conducted using a Smart Cycler® (Cephid, Sunnyvale, CA) and the QuantiTect SYBR Green RT-PCR Kit (Qiagen). As controls, a no-RT reaction was run for each extract and a no-template reaction was included during each experiment. Melt curves yielded a single melt-peak for all template reactions and a minimal melt peak for the no-template control reaction. Raw mRNA expression values were determined as being 2−CT, where CT is the second derivative of the fluorescence curve.
Immunocytochemistry (ICC)
Expression of protein in pancreatic cancer cell lines was determined using the same primary antibodies used in the immunohistochemistry. ICC was performed as previously reported by Lynch, et al (24). Secondary antibodies used were AlexaFluor488 Goat Anti-rabbit and AlexaFluor488 Goat Anti-mouse (Invitrogen, San Diego, CA). Following optimization, primary antibodies were diluted 1:50 and secondary antibodies were diluted 1:200. Cells were grown to 80% confluence on glass coverslips. Experiments were performed in parallel, i.e. cells stained for each target were seeded, cultured and stained simultaneously. ICC was performed in duplicate for each cell-line and primary antibody combination. Vectashield® H-1000 mounting medium for fluorescence (Vector Laboratories, Burlingame, CA) was used. Background labeling was determined by staining with only secondary antibody. Relative staining intensity as compared to the no-primary antibody control was recorded as: +++ = high, ++ = moderate, + = low.
To demonstrate co-expression of three targets in a single cell, a triple-label experiment was performed. A coverslip of Capan-1 cells stained for PTPRR using AlexaFluor488 Goat Anti-rabbit secondary antibody was subsequently stained for PCDHB10 using Goat Anti-mouse Texas Red secondary antibody (Invitrogen). The dual stained coverslip was then blocked overnight using unlabeled Goat Anti-rabbit IgG (Sigma, St. Louis, MO) at a 1:5 dilution. After blocking, the coverslip was stained for IL1RAP using Cy5 Goat Anti-rabbit secondary antibody (Jackson ImmunoResearch Laboratories, West Grove, PA) and mounted. The triple-labeled Capan-1 cells were then inspected and imaged for each target using an epifluorescence microscope using fluorochrome specific excitation and emission wavelengths. A blocking control was performed using a coverslip stained with AlexaFluor488 Goat Anti-rabbit secondary antibody. After blocking overnight, the control coverslip was stained using Cy5 Goat Anti-rabbit secondary antibody, mounted and imaged. No Cy5 fluorescence was observed for the blocking control (data not shown).
RESULTS
Microarray gene expression profiling
We have generated microarray data for 103 normal tissue samples representing 28 different organ sites and 28 PanAdo tissue samples. The feature intensity values for each sample were normalized by the array median intensity. Consistent with observations of others (25), the internal stability of the data set was determined by multidimensional scaling (MDS) analysis (Figure 1A). Although obtained from different sources representing diverse ethnic, age and gender groups, normal tissue samples belonging to the same organ type clustered together. Interestingly, the PanAdo samples did not always cluster together, indicating that gene expression patterns in pancreatic tumors are heterogeneous.
Figure 1.


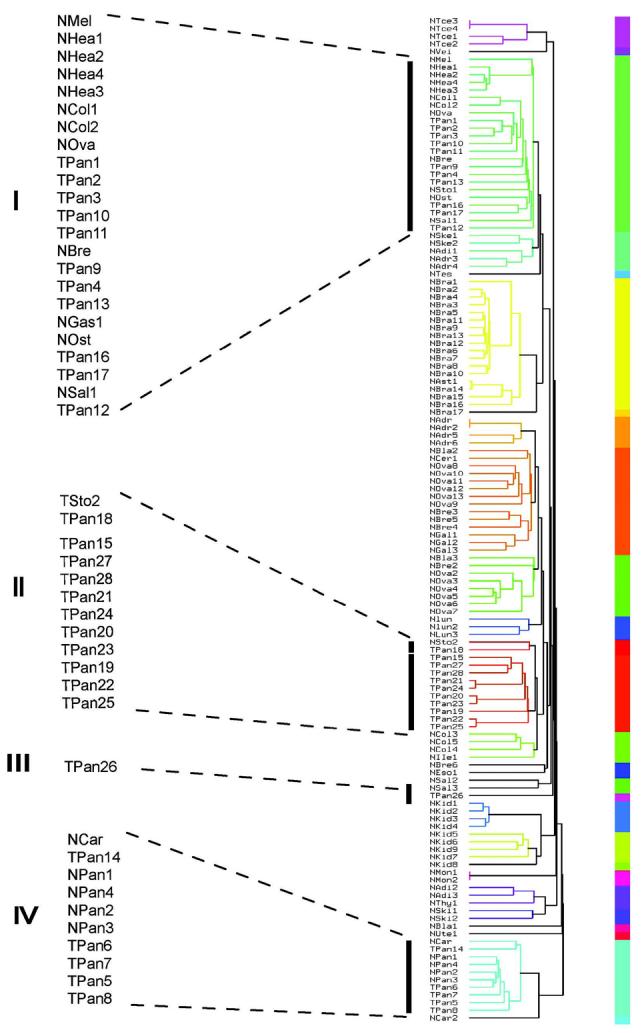
A) Multidimensional scaling plots of the PanAdo tissues (black dots) and normal tissues (gray dots) based on microarray gene expression data. B) Microarray intensity distribution plots of PanAdo samples (dashed line) and normal tissue samples (solid line). Vertical lines show cutoff values for demarcating a gene as either “express” in a given tumor sample (dashed line with a circle) or “not expressed” in a given normal sample (dashed line with a cross). C) Dendrogram of PanAdo tissue groupings with normal tissues based on expression of cell-surface genes. NMel: normal melanocytes; Nhea: Normal heart; NCol: Normal colon; NBre: Nornal breast; NOva: Normal ovary; NOst: Normal osteoblasts; NSal: Normal salivary gland; NSke: Normal skeletal muscle; NAdi: Normal adipose tissue; NAdr: Normal Adrenal gland; NSto: Normal stomach; NCar: Normal cartilage tissue; NPan: Normal pancreas; TPan: Pancreatic adenocarcinoma samples.
To facilitate data analysis and minimize target validation work, we curated a list of genes that encode proteins with cell surface epitopes or were predicted to be present on the cell surface by sequence homology or similarity. This list is limited to genes present on the Agilent Human 1A array. Since the Agilent 1A chips contain nearly every annotated gene (>18,000 genes), this list should represent most cell surface proteins suitable for ligand discovery. Although it is acknowledged that this list is not necessarily complete, it represents our best attempt to assemble a list of cell-surface genes and was used herein to identify cell surface target combinations specific for pancreatic cancer.
Area-based cutoff values for coverage analysis
The frequency histogram of mRNA abundance followed a pseudo-power law (Figure 1B). Thus, an important component of our analysis was identifying where to demarcate “expressed” genes from “non-expressed”. Although the level of mRNA expression is not always linearly related to the level of protein translation and subsequent localization to the cell surface, it is helpful to estimate the minimum level of mRNA expression that can lead to a level of protein at the cell surface sufficient for binding of an imaging or therapeutic agent. To make a best estimate, we adjusted the normal and tumor threshold values (see vertical lines in Figure 1B) to maximize the stringency of the coverage analyses, but still provide target combinations. The threshold values for normal tissues were defined as the intensity value below which proteins were considered “not expressed”. Similarly, the threshold values for tumor tissues were defined as the value above which proteins were considered “expressed.” It was observed that, at normal threshold values below 0.35, extremely large numbers of combinations were identified. It was likewise observed that tumor threshold values greater than 0.75 led to the lack of identified combinations. Thus, area-based cutoffs that provided useful numbers of target combinations ranged from 0.35 to 0.55 for the normal tissues, and 0.55 to 0.75 for tumor tissues. Combinations that provided the highest coverage amongst tumor tissues with the most stringent cutoff values were selected for further validation.
Algorithm design for target identification
The avidity of a heteromultivalent ligand is determined by the affinities of the individual binding moieties combined with the presence and concentration of each target receptor on the cell surface. The specificity of a multimeric agent is largely determined by differences in the expression of each target protein between normal and tumor tissues. For example, a hetero-trivalent ligand will bind more avidly to a cell that expresses all three complimentary cell-surface receptors, compared to cells that express only 2, or 1, target proteins. Rose and others have determined that detection of an image detail by the human eye requires a signal intensity-to-noise ratio (SNR) of at least 2 (26, 27). Thus for imaging, a 3-fold signal enhancement in a target tissue relative to background enhancement is generally required for reliable detection. It is estimated that for targeted therapies, a 100-fold increase in binding to target tissue relative to normal tissues is required (8, 28). Vagner and others have reported that ligands exhibiting heterobivalent binding interactions demonstrate an ∼50-fold increase in binding relative to monovalent interactions (13).
From these observations we estimated that a difference of 2 in the number of proteins targeted by heteromultimeric ligands in tumor tissue relative to normal tissues should provide a discriminating power that is sufficient for therapy or imaging. Thus, to identify gene combinations that will be useful for multimeric ligands, we invoked an “N-2” rule, i.e. if a gene combination contains N genes and the tumor expresses all N genes, no more than N-2 genes may be expressed in any given normal tissue (if it is a two- gene combination, the gene(s) must not be expressed in any normal tissues). To identify target combinations that meet this rule, we first binarized the expression of the cell surface genes to “not-expressed” or “expressed” for each tissue sample using area-based cutoff values with the highest possible stringency (vide supra).
To identify the target combinations, a coverage flag was assigned to each tumor sample for each possible combination. If a tumor sample expresses all N targets in a given combination, it was assigned the flag ‘1’, otherwise, it was assigned ‘0’. Likewise, if a normal tissue expresses more than N-2 genes, it was assigned ‘1’, otherwise, it was assigned ‘0’. Combinations with coverage flag ‘1’ in any normal tissue were subsequently eliminated. The remaining combination was then ranked by the sum of coverage flags for all tumor samples. Thus, the highest ranked combinations were predicted to cover the most tumors and have little or low avidity to all normal tissues. As higher dimensional combinations are computed it is possible that the same tumor samples could be covered by lower dimensional combinations. In order to only select combinations that covered more tumor samples than any lower dimension combinations we introduced the Coverage Measurement(ψ) to quantify each combination. If ψq is the Coverage Measurement for qth dimension, then a combination with q+1 dimensions is said to have an improvement in coverage over a combination with q dimensions only if ψq+1 > ψq. Only combinations with a higher Coverage Measurement than all combinations with lower dimensions (ψq+1>Vψ1,ψ2,…,ψq) were selected as valid target combinations.
Target combinations
Using this N-2 rule based algorithm we have identified a list of 3-gene (Table 1) and 4-gene (Table 1) combinations that each cover at least 3 out of 28 (11%) of the PanAdo samples. Many of these combinations share the same one or two genes. These common genes are not expressed in the majority of the normal tissues but require additional genes to differentiate the tumor samples from all normal tissues. Target combinations that contain 5 or more genes can be generated using the same computational methods. Interestingly, the algorithm did not identify any 2-gene combinations, indicating that there are no two genes that do not express in any of the normal tissues and that have a higher coverage measurement in tumor samples than either of the genes themselves at the cutoff levels we used. The number of possible combinations increases exponentially as the number of targets contained in a given combination increases.
Table 1.
Top 3-gene and 4-gene combinations identified based microarray data analyses
| Combination | Gene Symbols | Tumor Coverage by Cluster Analysis Grouping (See Figure 1C) |
||||
|---|---|---|---|---|---|---|
| 3-Gene Combinations | 1 | TM4SF4 | PCDHB10 | FCGR1A | Group II: TPan21, TPan22, TPan24 and TPan25 |
|
| 2 | IL1RAP | PCDHB10 | SLCO1B3 | Group II: TPan21, TPan22, TPan24 and TPan25 |
||
| 3 | PTPRR | IL1RAP | PCDHB10 | Group II: TPan22 and TPan25 Group III: TPan26. |
||
| 4 | IL1RAP | PCDHB10 | SLC2A13 | Group II: TPan22 and TPan25. Group III: TPan26. |
||
| 5 | TM4SF4 | PCDHB10 | SLC2A13 | Group II: TPan22 and TPan25 Group III: TPan26 |
||
| 6 | PCDHB10 | FCGR1A | SLCO1B3 | Group II: TPan21, TPan22, TPan24 and TPan25 |
||
| 7 | CLEC4A | PCDHB10 | SLCO1B3 | Group II: TPan21, TPan22, TPan24 and TPan25 |
||
| 4-Gene Combinations | 1 | TM4SF4 | FCGR1A | ASGR1 | IL1RAP | Group II: TPan19, TPan21, TPan22, TPan24, TPan25 and TPan27. |
| 2 | TM4SF4 | PCDHB10 | PCDHB9 | IL1RAP | Group II: TPan21, TPan22, TPan24 and TPan25 Group III: TPan26. |
|
| 3 | TNFSF4 | TM4SF4 | MGC34923 | TGFBR1 | Group II: TPan15, TPan19, TPan22, TPan25 and TPan27. |
|
| 4 | PCDHB8 | HLA-DQA1 | PCDHB10 | SLCO1B3 | Group II: TPan18, TPan21, TPan22, TPan24 and TPan25. |
|
| 5 | PTPRR | PTPRC | SLCO1B3 | ASGR1 | Group I: TPan10. Group II: TPan20, TPan22, TPan23, TPan25 and TPan28. |
|
| 6 | PTPRR | MS4A4A | SLCO1B3 | ASGR1 | Group I: TPan10. Group II: TPan20, TPan22, TPan23, TPan25 and TPan28. |
|
| 7 | PTPRR | CEACAM6 | MS4A4A | SLCO1B3 | Group I: TPan10. Group II: TPan20, TPan22, TPan23, TPan25 and TPan28. |
|
Grouping of pancreatic cancer based on cell-surface expression
To characterize the heterogeneity of the pancreatic cancer tissues in terms of cell-surface expression, we performed cluster analyses of all normal and tumor samples using microarray data corresponding to our list of cell-surface genes. Dendrograms were generated that demonstrate clustering of the PanAdo tissues into four groups by cell-surface expression (Figure 1C). The majority (96%) of the tumor tissues were represented by three major groupings (I, II and IV). Group II contains two very close clusters (the Nsto2/TPan18 cluster and the TPan16/TPan19-TPan25/TPan27-TPan28 cluster). Group IV tumors clustered with the normal pancreatic tissues, indicating that these tumors may be difficult to distinguish from normal pancreas by cell-surface expression, or that the tumor biopsy samples in group IV contained a high percentage of normal tissue. Groups I and II each represent 39% of the tumor samples. As further evidence that these groupings are relevant, the 3- and 4-gene combinations that were identified as having the broadest coverage (Table 1) predominantly covered tumors in the tightly clustered group II. However, as evidence of some overlapping amongst the groups, three of the 3-gene combinations and one of 4-gene combinations also covered the single tumor in group III, and three of the 4-gene combinations covered one tumor in group I. Together, the identified combinations covered 100% of the group II tumors. Most tumors in group I were covered in 4- gene combinations that were ranked lower than the ones selected for further validation, and many of these combinations included two tumors from group I. Five tumors did not appear in any combinations identified by these analyses, one from Group I and four of the five from group IV. Hence, these analyses provided combinations covering 82% of the PanAdo tissues tested.
Validation of targets using TMAs
To further validate the target combinations, we performed TMA based immunohistochemistry to examine protein levels of the targets in tissue samples. TMAs constructed from pancreatic cancer and normal tissues were used. The pancreatic cancer TMA contained 52 cases of pancreatic ductal adenocarcinomas, each of which was represented by at least two tumor cores. In addition, 38 of these cases were represented by a core from the matching adjacent normal region. The TMA also included 4 cases of normal pancreas from individuals with healthy pancreas. The normal tissue TMA contained 282 cores representing 66 different normal tissue types.
Commercial antibodies for targets of two 3-gene combinations were obtained for immunostaining: protein tyrosine phosphatase receptor type R (PTPRR); protocadherin beta 10 (PCDHB10); interleukin-1 receptor accessory protein (IL1RAP); and solute carrier family 2, member 13 (SLC2A13). Immunostaining was performed using optimized conditions and was scored by a board-certified pathologist (G.H.). Results for the PanAdo TMA are summarized in Table 2. All four targets showed strong staining in most tumor tissues and minimal or no staining in adjacent normal tissues. PTPRR was highly (≥2+) expressed in 75% of the tumor cases whereas only 10% of the adjacent normal tissues showed the similar level of staining. 37% of the tumor cases had 2+ or greater staining for PCDHB10 and only 1 out of 35 (3%) evaluable adjacent normal tissues showed 2+ staining. About 50% of the tumor cases showed 2+ or higher expression for IL1RAP and a similar number of cases showed 2+ or higher SLC2A13 staining. In contrast, almost all adjacent normal cases (except one case for SLC2A13 which was stained 2+) expressed these two targets at low levels (0 or 1+). None of the targets were stained more than 1+ in the normal pancreas tissues (Table 2). Overall, among the 46 tumor cases that were evaluable for all three members of the PTPRR, PCDHB10 and IL1RAP combination, 15 of them (33%) were stained 2+ or higher for all 3 targets and 38 of them (82%) expressed all three at 1+ or higher level. Likewise, among the 46 tumor cases that were evaluable for all three targets in the PTPRR, PCDH10 and SLC2A13 combination, eight (17%) expressed all three targets at 2+ or higher level and 35 (76%) expressed all three at 1+ or higher level. The percentage of positive (≥1+) staining for the combinations are much higher than the percentage of tumor coverage calculated from the microarray data, but the percentages of 2+ or higher cases in the IHC are only 2 or 3 fold higher than those from the microarray coverage analyses (11% for both combinations). This lower estimate of coverage by the microarray analysis is expected since we used cutoff values with the highest possible stringency in parsing the microarray data (vide supra). Representative staining of the targets in ductal pancreatic adenocarcinoma tissues and normal ductal pancreatic tissues are shown in Figures 2A and 2B, respectively. PTPRR staining was mostly cytoplasmic. Borderline ductal tumor lesions and dilating ducts had moderate staining (scored 1-2+). Staining for IL1RAP was also mostly cytoplasmic. Borderline tumors had quite strong staining (2-3+). Some acinar cells also stained positive for IL1RAP. Staining for PCDHB10 was also mostly cytoplasmic. Borderline tumor cells generally had strong staining (scored 2-3+). Pancreas acinar cells were also modestly positive for PCDHB10. Staining for SLC2A13 was both membranous and cytoplasmic. Borderline tumors were modestly positive for SLC2A13.
Table 2.
Summary of pancreatic tumor TMA immunostaining results for four targets
| Target | Sample Classification |
Score | % of Cases With ≥ 2+ |
||||
|---|---|---|---|---|---|---|---|
| 0 | 1+ | 2+ | 3+ | N/E | |||
| PTPRR | Normal | 2 | 2 | 0 | 0 | 0 | 0 |
| Adjacent Normal | 7 | 21 | 3 | 0 | 7 | 10 | |
| Tumor | 0 | 12 | 28 | 8 | 4 | 75 | |
| PCDHB10 | Normal | 3 | 1 | 0 | 0 | 0 | 0 |
| Adjacent Normal | 7 | 27 | 1 | 0 | 3 | 3 | |
| Tumor | 1 | 21 | 22 | 4 | 4 | 37 | |
| IL1RAP | Normal | 4 | 0 | 0 | 0 | 0 | 0 |
| Adjacent Normal | 24 | 5 | 0 | 0 | 9 | 0 | |
| Tumor | 6 | 19 | 18 | 5 | 4 | 48 | |
| SLC2A13 | Normal | 2 | 0 | 0 | 0 | 2 | 0 |
| Adjacent Normal | 20 | 10 | 1 | 0 | 7 | 3 | |
| Tumor | 7 | 18 | 18 | 4 | 5 | 47 | |
Figure 2.

Validation of target combinations by IHC in tissue microarrays (TMAs) and ICC in the Capan-1 pancreatic cancer cell line. A) Representative IHC staining images of four targets, PTPRR, IL1RAP, PCDHB10 and SLC2A13 in ductal pancreatic tumor tissues. B) Representative IHC staining images of the four targets in normal pancreatic ducts. C) Triple-label ICC showing co-expression of all 3 targets of the PTPRR, IL1RAP and PCDHB10 combination in the same set of Capan-1 pancreatic cancer cells.
Staining results for the four targets in the normal TMA was more complex than for the tumor TMA, as the normal TMA represented a variety of tissue types. All four targets had positive staining in certain normal tissue types, but the staining intensity was relatively weak (mostly 1+ or 2+). The gastric mucosa and vessel structures of placenta, uterus and heart myocardium were stained positive for PTPRR. Weak staining of PTPRR was also seen in the adrenal gland, salivary gland and genital tract structures such as seminal vesicles and fallopian tubes. Gastric mucosa and small intestine were focally positive for IL1RAP. Pancreas acinar cells were modestly stained for IL1RAP. Positive staining for IL1RAP was also observed in genital tracts such as epididymis, fallopian tubes and corpus luteum of ovary. Most gastrointestinal tract tissues were stained positive for PCDHB10. The adrenal and kidney were also stained strong for PCDHB10 (2-3+). Staining of SLC2A13 was not as extensive as the other 3 targets. Only weak staining was seen in lymphatic endothelium, bladder endothelium, kidney medulla, adrenal gland and gastric mucosa (Table 3).
Table 3.
Summary of immunostaining results on normal TMA for two target combinations.
| Tissue Type | Combination 1 | Combination 2 | ||||
|---|---|---|---|---|---|---|
| PTPRR | IL1RAP | PCDHB10 | IL1RAP | PCDHB10 | SLC2A13 | |
| Gastric mucosa | 3+ | 1+ | 1+ | 1+ | 1+ | 1+ |
| Small intestine * | 0 | 2+ | 1+ | 2+ | 1+ | 0 |
| Epididymis * | 1+ | 1+ | 1+ | 1+ | 1+ | 0 |
| Seminiferous tubules * | 1+ | 0 | 2+ | 0 | 2+ | 0 |
| Gallbladder | 1+ | 1+ | 0 | 1+ | 0 | 0 |
| Salivary gland | 1+ | 0 | 1+ | 0 | 1+ | 0 |
| Hair follicles * | 0 | 1+ | 1+ | 1+ | 1+ | 0 |
| Fallopian tube * | 2+ | 2+ | 1+ | 2+ | 1+ | 0 |
| Adrenal gland | 1+ | 0 | 3+ | 0 | 3+ | 1+ |
| Bronchial cartilage * | 1+ | 0 | 1+ | 0 | 1+ | 0 |
| Uterus smooth muscle | 1+ | 0 | 1+ | 0 | 1+ | 0 |
| Ovary, corpus luteum | 1+ | 1+ | 1+ | 1+ | 1+ | 0 |
| Placenta * | 1+ | 1+ | 1+ | 1+ | 1+ | 0 |
| Appendix * | 0 | 1+ | 1+ | 1+ | 1+ | 1+ |
| Bronchial epithelium | 1+ | 0 | 1+ | 0 | 1+ | 0 |
| Kidney | 1+ | 0 | 2+ | 0 | 2+ | 1+ |
| Bladder epithelium | 1+ | 2+ | 1+ | 2+ | 1+ | 1+ |
There are a few tissue types that stained positive for two or three of the targets in each combination. As shown in Table 3, 17 tissue types had positive staining for 2 of the 3 targets in the PTPRR, IL1RAP and PCDHB10 combination. Likewise, there are 11 tissue types that were positive for at least 2 of the 3 targets in the PTPRR, IL1RAP and SLC2A13 combination. As described earlier, these two target combinations were identified based on the DNA microarray profiling data on 28 different normal tissue types. The microarray data analysis predicted that not more than one target would be expressed in any of the 28 normal tissue types. Although most of the tissue types that showed positive IHC staining for two or more targets were not included in our DNA microarray profiling study, there are some tissue types that appear to be inconsistent between RNA expression (DNA microarray) and protein expression (IHC).
Co-expression of targets in pancreatic cancer cell lines
Since targets were validated in tumor tissue samples that have a heterogeneous mixture of cell types, determination of target expression in existing pancreatic cancer cell lines would serve as further validation. Microarray data were generated for 11 pancreatic adenocarcinoma cell lines. From these data, 5 lines (AsPC-1, Capan-1, HPAFII, PSN-1 and SU86.86) were selected that may express all three targets in at least one of the validated three-gene combinations. Expression of the four validated targets (IL1RAP, PCDHB10, PTPRR and SLC2A13) was determined quantitatively at the level of mRNA by qRT-PCR, and qualitatively at the level of protein by ICC (Table 4). Cell lines were identified that expressed all three targets in both validated combinations, e.g. AsPC-1 and Capan-1 cells express targets for both combinations at relatively high levels. For the IL1RAP-PCDHB10-PTPRR combination, Capan-1 cells expressed mRNA ranging from 0.006-0.05 the level of β-actin (ACTB) mRNA and demonstrated relatively high staining for all three targets by ICC. Since cultures used for ICC were seeded and stained simultaneously, and 100% of cells were stained for each target, it is unlikely that staining for each target was due to staining of discrete subpopulations within each culture. Hence, it can be concluded from these data that the targets are co-expressed in these cells.
Table 4.
Co-expression of validated targets in pancreatic cancer cell lines.
| Target | IL1RAP | PCDHB10 | PTPRR | SLC2A13 | ||||
|---|---|---|---|---|---|---|---|---|
| Cell Line |
mRNA (sem)# |
Protein† | mRNA (sem)# |
Protein† | mRNA (sem)# |
Protein† | mRNA (sem)# |
Protein† |
| AsPC-1 | 1.9 (0.1) | +++ | 13 (3) | +++ | 57 (10) | +++ | 90 (10) | +++ |
| Capan-1 | 12 (2) | +++ | 5.5 (0.8) | +++ | 46 (8) | +++ | 1.5 (0.8) | +++ |
| HPAFII | 0.63 (0.1) | +++ | 2.0 (0.3) | ++ | 26 (5) | +++ | 5.9 (4) | +++ |
| PSN-1 | 0.70 (0.1) | +++ | 0.044 (0.004) | ++ | 0.1 (0.09) | ++ | 11 (0.6) | ++ |
| SU86.86 | 0.62 (0.1) | + | 0.009 (0.005) | ++ | 2.3 (0.1) | ++ | 0.39 (0.1) | ++ |
Normalized to β-actin (ACTB) expression [(target gene 2−CT/ACTB 2−CT) * 1000]. Data are the mean of 3 samples and error values are the standard error of the mean (sem).
Relative staining intensity as compared to no 1° Ab control: +++ = high, ++ = moderate, + = low. Controls had no staining.
To verify co-expression in the same cells, triple-label ICC was performed for all three targets in the IL1RAP-PCDHB10-PTPRR combination on Capan-1 cells using secondary antibodies with spectrally distinct fluorochromes. As shown in Figure 2C, Capan-1 cells demonstrated co-expression of these three targets, and staining is observed throughout the cell for all three targets.
DISCUSSION
We report the identification of gene combinations that can be used to develop multi-targeted ligands using DNA microarray based gene expression profiling. Each combination contains genes that are concurrently expressed in pancreatic cancer but not in a variety of normal tissue types including normal pancreas. Genes included in the combination list are either known to encode cell surface proteins or are predicted to encode proteins with transmembrane (plasma membrane) domains based on database annotations. We sought to overcome one of the potential pitfalls of DNA microarray based target identification wherein mRNA levels do not always correlate with protein levels at the cell surface by examining the protein levels of two of the 3-gene combinations by TMA based immunohistochemistry. Protein expression levels of the targets were consistent with the DNA microarray data in PanAdo tissues and in a majority of normal tissues. However, there was a subset of normal tissues that showed expression of 2 or more targets in the 3-gene combinations. There are possible explanations for such discrepancies: first, it could be that target mRNA expression levels are not correlated with protein expression in some tissue types; second, some tissue types, such as the adrenal gland, are highly immunoreactive and the IHC signal might not be target specific; and finally, differences might be due to the fact that the microarray study tissues were not dissected for different cell types, whereas in the IHC evaluation, the intensity score was based on the cell types that exhibited the strongest staining. Further study is needed to pinpoint the exact reason.
Multimeric ligand targeting of cancer is based on the premise that cell surface target combinations highly specific to tumor cells can be identified. A number of studies have reported gene expression profiles of pancreatic cancers using various approaches. Typically, many cell surface genes/proteins were identified as upregulated in pancreatic cancer relative to normal pancreas. However, very few of these genes were validated as imaging targets mainly due to their low specificity against normal tissues besides pancreas. Our approach for identifying cell surface targets is different from other approaches in that we emphasize low or no target expression amongst all normal tissue types rather than high expression in tumor tissues. Due to the unique binding kinetics of multimeric ligands, a high level of expression for individual targets is desired but may not be absolutely required. Although the binding of multimeric ligands to their targets could be complicated, it is expected that multimeric ligands will have increased binding compared to monomeric ligands. This increase in avidity can be attributed to a variety of different factors including an increased local, or effective, concentration of ligand following binding of the first ligand of the multimer and decreased off-rates of a multimeric ligand, resulting in an apparent cooperativity (8, 10, 13). This suggests that the affinity of each individual ligand for binding the respective target need not be very high.
For a multimeric ligand to be effective, it requires the targets be concurrently expressed on the cell surface of tumor cells. As a result, a target combination might cover a lower percentage of patients compared to single targets. We found that the highest percentage of patient tumors covered by a target combination is 11% for 3-gene combinations and 21% for 4-gene combinations. Hence, multiple combinations are needed to treat all patients with a general classification of disease. This study identified combinations that together covered 82% of the PanAdo tissues analyzed. Of the 18% of tumors not covered, 80% of them clustered in group IV (Figure 1C) with normal pancreas tissue. The number of combinations needed to cover a majority of pancreatic cancers is difficult to predict, since there is some overlap in coverage amongst target combinations. Since most of the targets identified in this study do not already have ligands suitable for the assembly of multimeric ligands, further progress will require the development of ligands for each individual target, which is not a trivial task. Determining the exact number of combinations that will be required is somewhat dependent upon real progress in the development of specific ligands.
In summary, our results demonstrate that target combinations that are potentially very selective for a certain cell type (pancreatic adenocarcinoma cells in this case) can be identified using an approach combining DNA microarray expression profiling and TMA based immunohistochemistry. We are currently in the process of developing multimeric ligands for target combinations identified herein to further validate our targeting strategy.
Supplementary Material
ACKNOWLEDGMENTS
We like to thank Deepthi Chidambaram, Xiaoyang Zhang, Vidya Edupuganti for their assistance in data analyses, Drs. Michael Bittner, Seungchan Kim and Jianping Hua for valuable discussions, and James Lowey and Dr. Edward Suh for technical support of the High Performance Computing System for this project.
Financial support: NCI grants (CA097360, CA095944 and CA109552) and a grant from the Arizona Biomedical Research Commission (ABRC).
Abbreviations
- TMA
tissue microarray
- IHC
immunohistochemistry
- ICC
immunocytochemistry
Footnotes
Conflict of interest: None
REFERENCES
- 1.Temming K, Schiffelers RM, Molema G, Kok RJ. RGD-based strategies for selective delivery of therapeutics and imaging agents to the tumour vasculature. Drug Resist Updat. 2005;8:381–402. doi: 10.1016/j.drup.2005.10.002. [DOI] [PubMed] [Google Scholar]
- 2.Haubner R, Weber WA, Beer AJ, et al. Noninvasive visualization of the activated alphavbeta3 integrin in cancer patients by positron emission tomography and [18F]Galacto- RGD. PLoS Med. 2005;2:e70. doi: 10.1371/journal.pmed.0020070. [DOI] [PMC free article] [PubMed] [Google Scholar]
- 3.Beer AJ, Haubner R, Wolf I, et al. PET-based human dosimetry of 18F-galacto-RGD, a new radiotracer for imaging alpha v beta3 expression. J Nucl Med. 2006;47:763–9. [PubMed] [Google Scholar]
- 4.Goldenberg DM, Sharkey RM. Novel radiolabeled antibody conjugates. Oncogene. 2007;26:3734–44. doi: 10.1038/sj.onc.1210373. [DOI] [PubMed] [Google Scholar]
- 5.Jhanwar YS, Divgi C. Current status of therapy of solid tumors. J Nucl Med. 2005;46(Suppl 1):141S–50S. [PubMed] [Google Scholar]
- 6.Goldenberg DM, Sharkey RM. Advances in cancer therapy with radiolabeled monoclonal antibodies. Q J Nucl Med Mol Imaging. 2006;50:248–64. [PubMed] [Google Scholar]
- 7.Boturyn D, Coll JL, Garanger E, Favrot MC, Dumy P. Template assembled cyclopeptides as multimeric system for integrin targeting and endocytosis. J Am Chem Soc. 2004;126:5730–9. doi: 10.1021/ja049926n. [DOI] [PubMed] [Google Scholar]
- 8.Handl HL, Vagner J, Han H, Mash E, Hruby VJ, Gillies RJ. Hitting multiple targets with multimeric ligands. Expert Opin Ther Targets. 2004;8:565–86. doi: 10.1517/14728222.8.6.565. [DOI] [PubMed] [Google Scholar]
- 9.Laugel B, Boulter JM, Lissin N, et al. Design of soluble recombinant T cell receptors for antigen targeting and T cell inhibition. J Biol Chem. 2005;280:1882–92. doi: 10.1074/jbc.M409427200. [DOI] [PubMed] [Google Scholar]
- 10.Vagner J, Handl HL, Gillies RJ, Hruby VJ. Novel targeting strategy based on multimeric ligands for drug delivery and molecular imaging: homooligomers of alpha-MSH. Bioorg Med Chem Lett. 2004;14:211–5. doi: 10.1016/j.bmcl.2003.09.079. [DOI] [PubMed] [Google Scholar]
- 11.Garanger E, Boturyn D, Coll JL, Favrot MC, Dumy P. Multivalent RGD synthetic peptides as potent alphaVbeta3 integrin ligands. Org Biomol Chem. 2006;4:1958–65. doi: 10.1039/b517706e. [DOI] [PubMed] [Google Scholar]
- 12.Caplan MR, Rosca EV. Targeting drugs to combinations of receptors: a modeling analysis of potential specificity. Ann Biomed Eng. 2005;33:1113–24. doi: 10.1007/s10439-005-5779-1. [DOI] [PubMed] [Google Scholar]
- 13.Vagner J, Xu L, Handl HL, et al. Heterobivalent Ligands Crosslink Multiple Cell-Surface Receptors: The Human Melanocortin-4 and delta-Opioid Receptors. Angew Chem Int Ed Engl. 2008;47:1685–8. doi: 10.1002/anie.200702770. [DOI] [PMC free article] [PubMed] [Google Scholar]
- 14.Boyd RS, Adam PJ, Patel S, et al. Proteomic analysis of the cell-surface membrane in chronic lymphocytic leukemia: identification of two novel proteins, BCNP1 and MIG2B. Leukemia. 2003;17:1605–12. doi: 10.1038/sj.leu.2402993. [DOI] [PubMed] [Google Scholar]
- 15.Zhao Y, Zhang W, Kho Y. Proteomic analysis of integral plasma membrane proteins. Anal Chem. 2004;76:1817–23. doi: 10.1021/ac0354037. [DOI] [PubMed] [Google Scholar]
- 16.Loyet KM, Ouyang W, Eaton DL, Stults JT. Proteomic profiling of surface proteins on Th1 and Th2 cells. J Proteome Res. 2005;4:400–9. doi: 10.1021/pr049810q. [DOI] [PubMed] [Google Scholar]
- 17.Tangrea MA, Wallis BS, Gillespie JW, Gannot G, Emmert-Buck MR, Chuaqui RF. Novel proteomic approaches for tissue analysis. Expert Rev Proteomics. 2004;1:185–92. doi: 10.1586/14789450.1.2.185. [DOI] [PubMed] [Google Scholar]
- 18.Dougherty ER, Barrera J, Brun M, et al. Inference from clustering with application to gene-expression microarrays. J Comput Biol. 2002;9:105–26. doi: 10.1089/10665270252833217. [DOI] [PubMed] [Google Scholar]
- 19.Kononen J, Bubendorf L, Kallioniemi A, et al. Tissue microarrays for high-throughput molecular profiling of tumor specimens. Nat Med. 1998;4:844–7. doi: 10.1038/nm0798-844. [DOI] [PubMed] [Google Scholar]
- 20.Andersen CL, Hostetter G, Grigoryan A, Sauter G, Kallioniemi A. Improved procedure for fluorescence in situ hybridization on tissue microarrays. Cytometry. 2001;45:83–6. doi: 10.1002/1097-0320(20011001)45:2<83::aid-cyto1149>3.0.co;2-p. [DOI] [PubMed] [Google Scholar]
- 21.Mousses S, Bubendorf L, Wagner U, et al. Clinical validation of candidate genes associated with prostate cancer progression in the CWR22 model system using tissue microarrays. Cancer Res. 2002;62:1256–60. [PubMed] [Google Scholar]
- 22.Watanabe A, Cornelison R, Hostetter G. Tissue microarrays: applications in genomic research. Expert Rev Mol Diagn. 2005;5:171–81. doi: 10.1586/14737159.5.2.171. [DOI] [PubMed] [Google Scholar]
- 23.Morse DL, Carroll D, Weberg L, Borgstrom MC, Ranger-Moore J, Gillies RJ. Determining suitable internal standards for mRNA quantification of increasing cancer progression in human breast cells by real-time reverse transcriptase polymerase chain reaction. Anal Biochem. 2005;342:69–77. doi: 10.1016/j.ab.2005.03.034. [DOI] [PubMed] [Google Scholar]
- 24.Lynch RM, Fogarty KE, Fay FS. Modulation of hexokinase association with mitochondria analyzed with quantitative three-dimensional confocal microscopy. J Cell Biol. 1991;112:385–95. doi: 10.1083/jcb.112.3.385. [DOI] [PMC free article] [PubMed] [Google Scholar]
- 25.Son CG, Bilke S, Davis S, et al. Database of mRNA gene expression profiles of multiple human organs. Genome Res. 2005;15:443–50. doi: 10.1101/gr.3124505. [DOI] [PMC free article] [PubMed] [Google Scholar]
- 26.Rose A. The sensitivity performance of the human eye on an absolute scale. J Opt Soc Am. 1948;38:196. doi: 10.1364/josa.38.000196. [DOI] [PubMed] [Google Scholar]
- 27.Barrett HH, Swindell W. In: Noise in Images. Barrett HH, Swindell W, editors. Radiological Imaging: Academic Press; 1981. pp. 494–560. [Google Scholar]
- 28.Mammen M, Choi S-K, Whitesides GM. Polyvalent Interactions in Biological Systems: Implications for Design and Use of Multivalent Ligands and Inhibitors. Angewandte Chemie. 1998;37:2754–96. doi: 10.1002/(SICI)1521-3773(19981102)37:20<2754::AID-ANIE2754>3.0.CO;2-3. [DOI] [PubMed] [Google Scholar]
Associated Data
This section collects any data citations, data availability statements, or supplementary materials included in this article.