Abstract
Neuroglobin (Ngb) is a monomeric protein that, despite the small sequence similarity with other globins, displays the typical globin fold. In the absence of exogenous ligands, the ferric and the ferrous forms of Ngb are both hexacoordinated to the distal and proximal histidines. In the ferrous form, oxygen, nitric oxide or carbon monoxide can displace the distal histidine, yielding a reversible adduct. Crystallographic data show that the binding of an exogenous ligand is associated to structural changes involving heme sliding and a topological reorganization of the internal cavities. Molecular dynamics (MD) simulations in solution show that the heme oscillates between two positions, much as the ones observed in the crystal structure, although the occupancy is different. The simulations also suggest that ligand binding in solution can affect the flexibility and conformation of residues connecting the C and D helices, referred to as the CD corner, which is coupled to the configuration adopted by the distal histidine. In this study, we report the results of 30 ns MD simulations of CO-bound Ngb in the crystal. Our goal was to compare the protein dynamical behavior in the crystal with the results supplied by the previous MD simulation of CO-bound Ngb in solution and the x-ray experimental data. The results show that the different environments (crystal or solution) affect the dynamics of the heme group and of the CD corner.
INTRODUCTION
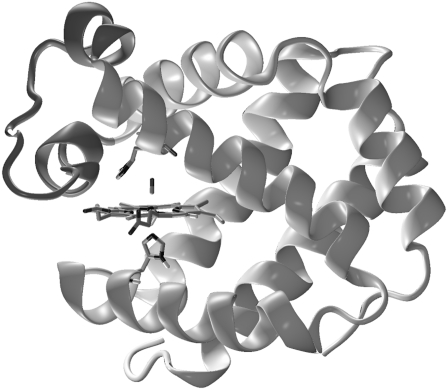
Neuroglobin (Ngb; Fig. 1) is a globular protein expressed in the brain (1) that is composed of a single polypeptide and a prosthetic group, the heme, which reversibly binds oxygen and other diatomic ligands at the sixth coordination position. In the absence of exogenous ligands, the ferric and the ferrous forms of Ngb are both hexacoordinated to the distal His64(E7) and to the proximal His96(F8) side chains (2–5). In the ferrous form, binding of O2 or CO displaces the distal histidine, implying competition between the exogenous ligand and His64 for the sixth coordination position on the heme.
FIGURE 1.
Sample configuration of NgbCO as extracted from MD simulations in solution. The heme, distal His64(E7) and proximal His96(F8) are depicted by sticks. The CD corner, composed of helices C and D and the CD loop, is highlighted.
The physiologic role of Ngb is still debated. Nevertheless, studies have convincingly demonstrated that Ngb is involved in the activation of a neuroprotective mechanism against hypoxia-ischemia (6–8). Although the exact biochemical mechanism underlying such Ngb-mediated neuroprotection is still unclear, it has been demonstrated that Ngb interacts with the Gα subunit of the Gαβγ protein (9,10), acting as a guanine nucleotide dissociation inhibitor. Studies recently showed that Ngb interacts with the Gα subunit via the CD corner, a region composed of the CD loop and part of the adjacent C and D helices (11). Moreover, a molecular dynamics (MD) simulation in solution indicated that the CD loop flexibility in Ngb is related to the dynamics of the distal site, in particular to the configuration assumed by the distal His64(E7) (12).
The three-dimensional structure was solved by x-ray diffraction for the unliganded ferric Ngb from human and mouse (3,5) and for the CO-bound ferrous Ngb (13). These crystal structures do not account for any flip/flop motion of the CD loop as detected by the MD simulations in solution. In addition, comparison of the crystallographic structure of ferric and ferrous CO-bound Ngb (NgbCO) showed that binding of CO is associated to structural changes involving a significant heme sliding and a topological reorganization of the internal cavities (5,13). Thus, it was suggested that the heme sliding may underlie a new mechanism for ligand binding modulation (13,14). Because the heme displacement within the frame of the globin fold leaves the position of the distal histidine almost unchanged, such a mechanism may control the binding kinetics of the exogenous ligand.
The above-described MD simulation of NgbCO in water revealed a heme sliding that occurs over the time range of the simulation (12). However, the simulation showed that the configuration of the heme in the NgbCO crystal structure is slightly less stable in solution than in the crystal; consequently, the heme preferentially populates another position roughly corresponding to that observed when the heme is bound to the distal histidine side chain. These discrepancies between x-ray results and MD simulations may be due to the different environments (crystal or solution) of the experimental and computational studies. Given the likely functional significance of the heme sliding and CD corner motion, we performed an MD simulation of NgbCO in the crystal to clarify the origin of these differences. Our results are in excellent agreement with the x-ray data, showing that the differences previously observed are due to the different environments.
METHODS
Initial coordinates were taken from the 1.7 Å resolution crystal structure of the CO-bound murine Ngb (Protein Data Bank (PDB) entry 1W92) (13). The NgbCO crystal belonged to the R32 space group, which has the following rhombohedral unit cell parameters: a = b = 8.337 nm, c = 11.098 nm, and γ = 120° (13). The R32 crystal unit cell contains 18 symmetry-related molecules; therefore, the starting coordinates of the crystal unit cell were obtained by applying the R32 symmetry transformation.
The simulations were carried out with the Gromacs software package (15) using the GROMOS96 force field (16), version number 43A1; this software was used previously for simulations of proteins in the crystal by Walser et al. (17,18), who performed tests on its reliability. In addition, this force field was used in the MD simulations of the CO migration in myoglobin crystal and provided structural and kinetic results that were in excellent agreement with the experimental data (19).
Because the experimental crystal structure corresponded to pH 7.5, Glu and Asp residues and the heme prosthetic groups were assumed to be deprotonated, whereas Lys and Arg residues were assumed to be protonated. The His side chains were modeled as nonprotonated.
The 18 proteins were hydrated by placing 1926 SPC water molecules (20) at crystallographic sites and 10758 at noncrystallographic sites. A total of 90 Na+ counterions were added by replacing water molecules at the most negative electrical potential to provide a neutral simulation box. The solvent box was generated by two different solvent additions, each followed by a solvent relaxation session. Such a procedure provided a homogenously distributed solvent outside the proteins, with a box density close to that in the experimental crystal. The solvent was relaxed by energy minimization followed by 50 ps MD at 300 K, whereas protein and CO atomic positions were restrained with a harmonic potential. The system was then energy minimized without restraints, and its temperature brought to 293 K in a stepwise manner; 300 ps MD runs at 50, 100, 150, 200, 250, 293 K were carried out before starting the production runs.
Simulations used for subsequent analysis were carried out at 293 K using the isothermal temperature coupling (21) within a constant volume box and using periodic boundary conditions. Initial velocities were taken randomly from a Maxwell distribution. The bond lengths were constrained by using the LINCS algorithm (22). A time step of 2 fs was used. The particle mesh Ewald (PME) method (23) was used for the calculation of the long-range interactions, with a grid spacing of 0.12 nm combined with a fourth-order B-spline interpolation to compute the potential and forces between grid points. A nonbonded pair list cutoff of 9 Å was used for short-range interactions, and the pair list was updated every five time steps. A single simulation of the R32 crystal cell was carried out, and 18 trajectories (each 30 ns in length) of crystallized NgbCO were obtained.
RESULTS
During the MD simulation, the protein molecules were allowed to translate and/or rotate. The results show that the center of mass of each protein oscillates around a fixed position with a root mean-square fluctuation ranging from 0.6 to 1.1 Å. In addition, the crystal structure maintains the R32 space group symmetry.
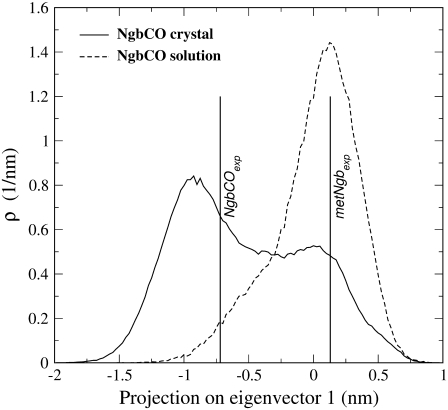
The motion of the heme in the NgbCO crystal simulations was monitored with the essential dynamics analysis (24), which was performed on all heme atoms (with the exception of the terminal propionic groups). To coherently compare solution and crystal simulations, the eigenvectors used were those obtained by essential dynamics analysis performed on NgbCO in solution, which has been described previously (12). We observed that the motion associated with the first eigenvector was a rototranslational displacement in the direction from D to B pyrrole rings and corresponded to the heme sliding movement observed in a comparison of the experimental crystal structures of NgbCO and metNgb (5,13). Fig. 2 shows the heme position distribution along the first eigenvector in the crystal (solid line) and in the solution (dashed line). It is interesting to note that the two distributions are quite different. In solution, the heme mainly occupies a position characterized by positive values of the first eigenvector projection that corresponds roughly to the heme position in the metNgb when the heme is bound to the distal histidine (∼0.13 nm). In the crystal, the distribution is characterized by two maxima: 0.01 and −0.92 nm, respectively. The latter and more populated configuration almost corresponds to the position occupied by the heme in the experimental crystal structure (−0.72 nm).
FIGURE 2.
Heme displacement distributions along its first essential eigenvector in carboxy Ngb in the crystal (solid line) and in solution (dashed line). The values corresponding to the experimental heme positions in carboxy Ngb (−0.72 nm) and metNgb (0.13 nm) in the crystal are indicated by vertical bars. Note that, with a single value in the abscissa, the distribution converges to a Dirac function.
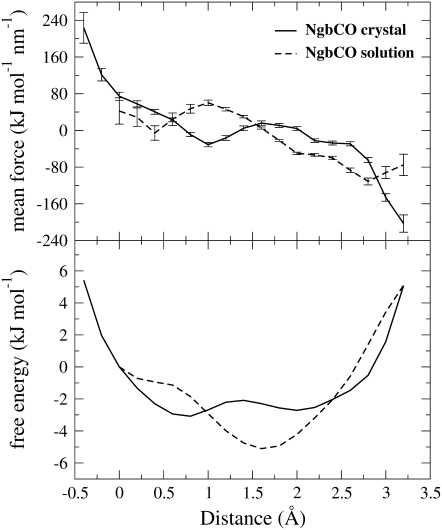
The free energy landscape of the heme displacement was calculated by the potential of mean force method (25). In Fig. 3, the free energy landscape of the heme displacement in the crystal is compared to that obtained by NgbCO simulation in solution (12). The abscissa refers to a direction representing the heme displacement by means of the heme-sliding mechanism (12). Fig. 3 also shows a destabilization of the positions at 1.5–2.0 Å, moving from solution to the crystal environment. Furthermore, the position of the heme in the experimental NgbCO crystal structure (0.3 Å), which corresponds in solution to an almost flat region with a free energy value of ∼5 kJ/mol greater than the energy minimum, becomes the most stable configuration in the crystal, with a free energy value at least ∼1 kJ/mol less than the other minimum, corresponding to a relative occupancy of 60:40 at 293 K.
FIGURE 3.
Mean force with their standard deviations (upper panel) and heme group free energy landscape (bottom panel) for carboxy Ngb in the crystal (solid line) and in solution (dashed line). In brief, the method is based on the choice of a direction and on the calculation of the mean force acting on the heme center of mass along this direction. The mean force corresponds to the free energy gradient.
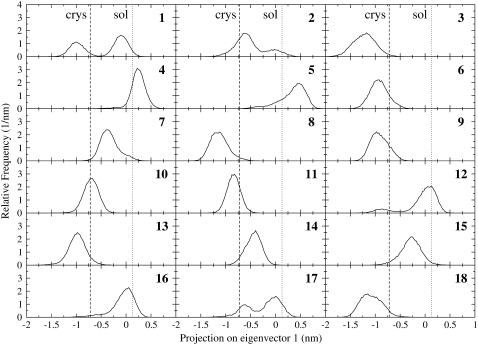
In Fig. 4, the distribution of the heme group in the essential coordinate, representing the sliding motion, is shown for each molecule. The vertical lines represent the position in the crystal structure and in the solution simulation described previously (12). Most of the heme groups oscillate around one of the two principal positions, whereas a few of them (trajectories 1, 2, 12, and 17) oscillate between the two positions.
FIGURE 4.
Heme displacement distributions along its first essential eigenvector in the carboxy Ngb crystal. The distributions are shown for each protein molecule in the crystal unit cell (1–18). The vertical lines represent the principal configurations detected in the crystal (dashed line) and in solution (dotted lines).
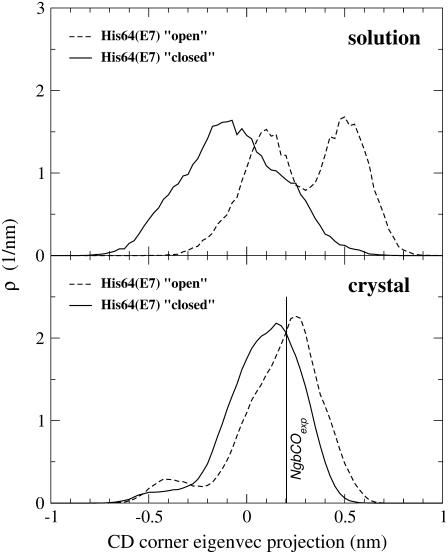
In the previous study of NgbCO simulation in solution (12), the dynamical behavior of the CD corner was monitored by the essential dynamics analysis, which demonstrated the distribution of the projection of its trajectory onto the first essential eigenvector. The study by Anselmi et al. (12) showed that, in solution, the CD loop flipped between two configurations whenever the distal histidine side chain had swung toward the solvent. We observed a bimodal distribution when distal histidine was in the open configuration, whereas a unimodal distribution was found with the histidine side chain in the closed position (Fig. 5, upper panel). Such configurations were conventionally labeled “a” and “b” and identified by the projection distributions centered at ∼−0.1 nm and 0.5 nm, respectively. It is important to note that, in the configuration marked with “a”, the CD corner is placed in an inner position. This position corresponds to a distance between the center of the CD loop (represented by Gly46 Cα) and the heme plane (determined from the NgbCO crystal structure) of ∼1.2 Å under the plane. When the CD corner flips in the other configuration marked with “b”, such distance increases up to ∼7.6 Å over the heme plane, and the CD corner moves toward an outer position. Significantly, the distance between the CD loop center and the heme plane in the crystal structure is ∼2.4 Å over the plane. The analysis of the MD simulation in the crystal showed that the distal histidine side chain populates two configurations corresponding to the “closed” and “open” states characterized in the previous study by Anselmi et al. (12). The CD loop, however, does not flip between the two distinct configurations “a” and “b”, as observed in solution when the histidine side chain is open. Fig. 5 (bottom panel) shows the two distributions of the projection onto the first essential eigenvector corresponding to the distal His64 closed (solid line) and open (dashed line) configurations. These relatively broad distributions are characterized by a single peak centered at ∼0.2 nm and almost correspond to the position occupied by the CD loop in the experimental crystal structure.
FIGURE 5.
Distribution of the projection onto the CD corner first essential eigenvector for carboxy Ngb in the crystal (lower panel) and in solution (upper panel). The distribution corresponding to the distal His64(E7) “closed” (solid line) or “open” (dashed line) configurations are shown. The value corresponding to the experimental CD corner position in carboxy Ngb (0.20 nm) is indicated by a vertical bar.
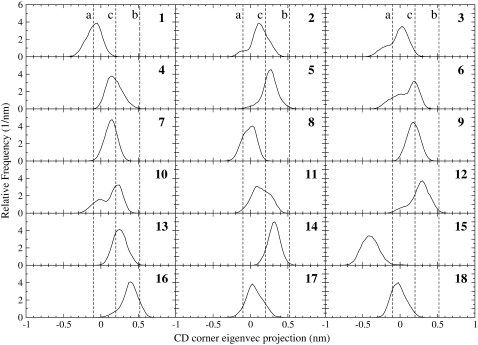
To evaluate whether there was a symmetry-related protein molecule with behavior resembling that observed in solution, the CD corner motion for each trajectory was monitored with essential dynamics analysis. In Fig. 6, the distribution of the CD corner in the essential coordinate, representing the flip-flop motion observed in solution, is shown for each molecule. The vertical lines represent the inner (a), outer (b), and crystal (c) positions. Most of the loops are close to the crystal positions (trajectories 4, 5, 7, 9, 11, 13, 14, and 16), and some of them populate the inner configuration “a” (trajectories 1, 8, 15, 17, and 18). Moreover, in a few trajectories (2,3,6,12), the CD corner oscillates between the two configurations with a clear preference for the crystal position. It should be noted that the CD corner steadily populates the outer configuration “b” in none of the 18 trajectories, even though we can observe that it occasionally approaches such a position (that is, in the trajectory 16).
FIGURE 6.
Distribution of the projection onto the CD corner first essential eigenvector for each protein molecule in the crystal unit cell (1–18). The vertical dashed lines represent the projection values corresponding to the CD corner configurations detected in solution (a and b) and in the crystal structure (c).
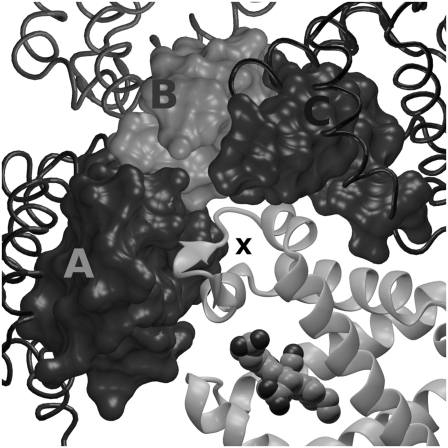
The analysis of the intermolecular contacts involving the CD corner residues shows that the CD loop is trapped by at least three different arrays of short contacts (distance <6 Å) with residues of the contiguous proteins, as is shown in Table 1 and in Fig. 7. The three protein molecules involved in the contacts with the CD loop are indicated with the capital letters A, B, and C (Fig. 7); these correspond to symmetry transformations (−y, x − y, z), (2/3 + y, 1/3 + x, 1/3 − z), and (2/3 + x − y, 1/3 − y, 1/3 − z), respectively. Of importance is that the results may be exactly extended to the other symmetry-related protein molecules of the crystal unit cell, and they do not depend on the choice of the reference protein. The CD corner interacts with residues connecting the G and H helices and the BC loop of protein “A”, with the CD corner of protein “B”, and with the B and G helices of protein “C”. The results clearly show that the reduced mobility of the CD corner in the crystal and the lack of the outer configuration observed in solution have to be ascribed to crystal packing contacts.
TABLE 1.
Residues involved in the contacts between the reference CD corner and the neighbor protein molecules in Ngb crystal unit cell (also see Fig. 7)
| CD corner | Protein A | Protein B | Protein C |
|---|---|---|---|
| Pro36 | Ala33, Leu34 | ||
| Ser37 | Leu34, Thr108 | ||
| Pro40 | Leu34, Glu111 | ||
| Leu41 | Glu111 | ||
| Gly46 | Glu118, Arg130 | ||
| Arg47 | Glu118 | ||
| Gln48 | Arg30, Glu111, Leu114, Tyr115, Glu118 | ||
| Ser50 | Arg30 | Ser50, Ser51, Glu53, Asp54 | |
| Ser51 | Ser50, Ser51 | ||
| Glu53 | Ser50 | Ala29, Arg30, Ala33, Tyr115 | |
| Asp54 | Ser50 | Lys119 | |
| Leu56 | Thr25, Val26, Ala29 | ||
| Ser57 | Val26, Lys119 |
FIGURE 7.
CD corner interactions in the crystal unit cell. The CD corner (indicated by X) is surrounded by three symmetry-related protein molecules (marked by A, B, and C) whose positions correspond to as many symmetry transformations (see text). The protein “A” interacts with the CD corner through the helices G and H and the BC loop, the protein “B” through the CD loop, and the protein “C” through the helices B and G.
CONCLUSIONS
In this study, we have carried out an MD simulation of NgbCO in the crystal. The purpose was to compare the protein dynamical behavior in the crystal with the results obtained for the same protein by a previous MD simulation in solution (12) and with the x-ray experimental data (13). We have focused mainly on the structural/dynamical modifications that occur in the heme-sliding mechanism and in the CD corner fluctuations moving from solution to the crystal environment.
The free energy landscape, related to the translational component of the heme sliding, is significantly different in the two environments. In fact, the heme position observed in the experimental NgbCO crystal structure becomes the more stable configuration in the simulated crystal, with a free energy value ∼1 kJ/mol less than the other minimum. In solution, however, such a position was ∼5 kJ/mol less stable with respect to the same minimum. Therefore, the heme position at 0.3 Å (Fig. 3) undergoes a stabilization in moving from solution to the crystal, which is in agreement with diffraction data. Furthermore, in the crystal, we observed that the CD corner was almost “frozen” in the position observed in the crystal, whereas in solution it underwent a significant flip-flop displacement between two distinct configurations. We have tentatively assigned the functional significance of this finding to the binding of Ngb to the α-subunit of the Gαβγ protein (11).
The analysis of the CD corner interactions clearly shows that its mobility and prevailing configuration is restrained due to the crystal packing. Although we did not perform any tests on the force field parameters used in the simulation, the close packing that we observed seems to exclude any effect due to the force field. A different configuration of the CD corner might be experimentally observed if Ngb were crystallized in a different space group.
These results show that, although crystallography and MD simulations in solution yield, as expected, almost the same description of the NgbCO structural behavior, some clear-cut differences can be detected. In the case of Ngb, the motions observed by MD in solution and not seen in the crystallographic data are not negligible, given that the relevant conformational changes may be a crucial component of the neuroprotective role of Ngb (11,14). The results suggest that the structural features that were not detected in the crystal were probably restrained by the pattern of contacts with other Ngb molecules in the lattice (Table 1 and Fig. 7), which reduce the mobility of specific parts of the protein surface. Recently, high-resolution x-ray diffraction data on myoglobin showed a substantial conformational variance in protein peripheral regions by comparing the crystal structures obtained for different space groups (26). These data suggest that distinct packing arrangements may select part of the configurations that are representative of the protein ensemble in solution. It may be advisable, therefore, to solve several different crystal forms to have a more complete view of the dynamics of a structure, although this approach may be either impossible or very demanding. Hence, MD simulations can be effectively used to explore the behavior of a protein in different environments and, combined with x-ray measurements and other experimental techniques, can provide a more complete description of protein structural dynamics.
Acknowledgments
The authors thank the Consorzio interuniversitario per le Applicazioni di Supercalcolo per Università e Ricerca (CASPUR) for computational support.
This work was supported by grants from the Ministero dell‘Istruzione, dell’Università e della Ricerca (MIUR) (Fondo per gli Investimenti della Ricerca di Base (FIRB) projects on structure, function, dynamics and folding of proteins (RBIN04PWC_001 to A.D.N. and RBLA03B3KC_004 to M.B.) and by a grant to M.B. from the University of Rome “La Sapienza”. M.A. acknowledges support by the University of Rome “La Sapienza”.
Editor: Ron Elber.
References
- 1.Burmester, T., B. Weich, S. Reinhardt, and T. Hankeln. 2000. A vertebrate globin expressed in the brain. Nature. 407:520–523. [DOI] [PubMed] [Google Scholar]
- 2.Dewilde, S., L. Kiger, T. Burmester, T. Hankeln, V. Baudin-Creuza, T. Aerts, M. C. Marden, R. Caubergs, and L. Moens. 2001. Biochemical characterization and ligand binding properties of neuroglobin, a novel member of the globin family. J. Biol. Chem. 276:38949–38955. [DOI] [PubMed] [Google Scholar]
- 3.Pesce, A., S. Dewilde, M. Nardini, L. Moens, P. Ascenzi, T. Hankeln, T. Burmester, and M. Bolognesi. 2003. Human brain neuroglobin structure reveals a distinct mode of controlling oxygen affinity. Structure. 11:1087–1095. [DOI] [PubMed] [Google Scholar]
- 4.Nienhaus, K., J. M. Kriegl, and G. U. Nienhaus. 2004. Structural dynamics in the active site of murine neuroglobin and its effects on ligand binding. J. Biol. Chem. 279:22944–22952. [DOI] [PubMed] [Google Scholar]
- 5.Vallone, B., K. Nienhaus, M. Brunori, and G. U. Nienhaus. 2004. The structure of murine neuroglobin: novel pathways for ligand migration and binding. Proteins. 56:85–92. [DOI] [PubMed] [Google Scholar]
- 6.Sun, Y., K. Jin, X. O. Mao, Y. Zhu, and D. A. Greenberg. 2001. Neuroglobin is up-regulated by and protects neurons from hypoxic-ischemic injury. Proc. Natl. Acad. Sci. USA. 98:15306–15311. [DOI] [PMC free article] [PubMed] [Google Scholar]
- 7.Sun, Y., K. Jin, A. Peel, X. O. Mao, L. Xie, and D. A. Greenberg. 2003. Neuroglobin protects the brain from experimental stroke in vivo. Proc. Natl. Acad. Sci. USA. 100:3497–3500. [DOI] [PMC free article] [PubMed] [Google Scholar]
- 8.Khan, A. A., X. O. Mao, S. Banwait, C. M. DerMardirossian, G. M. Bokoch, K. Jin, and D. A. Greenberg. 2008. Regulation of hypoxic neuronal death signaling by neuroglobin. FASEB J. 22:1737–1747. [DOI] [PMC free article] [PubMed] [Google Scholar]
- 9.Wakasugi, K., T. Nakano, and I. Morishima. 2003. Oxidized human neuroglobin acts as a heterotrimeric Gα protein guanine nucleotide dissociation inhibitor. J. Biol. Chem. 278:36505–36512. [DOI] [PubMed] [Google Scholar]
- 10.Wakasugi, K., and I. Morishima. 2005. Identification of residues in human neuroglobin crucial for Guanine nucleotide dissociation inhibitor activity. Biochemistry. 44:2943–2948. [DOI] [PubMed] [Google Scholar]
- 11.Kitatsuji, C., M. Kurogochi, S. Nishimura, K. Ishimori, and K. Wakasugi. 2007. Molecular basis of guanine nucleotide dissociation inhibitor activity of human neuroglobin by chemical cross-linking and mass spectrometry. J. Mol. Biol. 368:150–160. [DOI] [PubMed] [Google Scholar]
- 12.Anselmi, M., M. Brunori, B. Vallone, and A. Di Nola. 2007. Molecular dynamics simulation of deoxy and carboxy murine neuroglobin in water. Biophys. J. 93:434–441. [DOI] [PMC free article] [PubMed] [Google Scholar]
- 13.Vallone, B., K. Nienhaus, A. Matthes, M. Brunori, and G. U. Nienhaus. 2004. The structure of carbonmonoxy neuroglobin reveals a heme-sliding mechanism for control of ligand affinity. Proc. Natl. Acad. Sci. USA. 101:17351–17356. [DOI] [PMC free article] [PubMed] [Google Scholar]
- 14.Brunori, M., and B. Vallone. 2007. Neuroglobin, seven years after. Cell. Mol. Life Sci. 64:1259–1268. [DOI] [PMC free article] [PubMed] [Google Scholar]
- 15.Van Der Spoel, D., E. Lindahl, B. Hess, G. Groenhof, A. E. Mark, and H. J. C. Berendsen. 2005. GROMACS: Fast, flexible, and free. J. Comput. Chem. 26:1701–1718. [DOI] [PubMed] [Google Scholar]
- 16.van Gunsteren, W. F., S. R. Billeter, A. A. Eising, P. H. Hünenberger, P. Kruger, A. E. Mark, W. R. P. Scott, and I. G. Tironi. 1996. Biomolecular Simulations: The GROMOS96 Manual and User Guide. vdf Hochschulverlag AG an der ETH Zürich and BIOMOS b.v., Zürich, Groningen.
- 17.Walser, R., P. H. Hunenberger, and W. F. van Gunsteren. 2001. Comparison of different schemes to treat long-range electrostatic interactions in molecular dynamics simulations of a protein crystal. Proteins. 43:509–519. [DOI] [PubMed] [Google Scholar]
- 18.Walser, R., P. H. Hunenberger, and W. F. van Gunsteren. 2002. Molecular dynamics simulations of a double unit cell in a protein crystal: volume relaxation at constant pressure and correlation of motions between the two unit cells. Proteins. 48:327–340. [DOI] [PubMed] [Google Scholar]
- 19.Anselmi, M., A. Di Nola, and A. Amadei. 2008. The kinetics of ligand migration in crystallized myoglobin as revealed by molecular dynamics simulations. Biophys. J. 94:4277–4281. [DOI] [PMC free article] [PubMed] [Google Scholar]
- 20.Berendsen, H. J. C., J. P. M. Postma, W. F. van Gunsteren, and J. Hermans. 1981. Interaction models for water in relation to protein hydration. In Intermolecular Forces. B. Pullman, editor. D. Reidel Publishing, Dordrecht, The Netherlands. 331–342.
- 21.Evans, D. J., and G. P. Morriss. 1990. Statistical Mechanics of Nonequilibrium Liquids. Academic, London.
- 22.Hess, B., H. Bekker, H. J. C. Berendsen, and J. G. E. M. Fraaije. 1997. LINCS: a linear constraint solver for molecular simulations. J. Comput. Chem. 18:1463–1472. [Google Scholar]
- 23.Essmann, U., L. Perera, M. L. Berkowitz, T. Darden, H. Lee, and L. G. Pedersen. 1995. A smooth particle mesh Ewald method. J. Chem. Phys. 103:8577–8593. [Google Scholar]
- 24.Amadei, A., A. B. Linssen, and H. J. Berendsen. 1993. Essential dynamics of proteins. Proteins. 17:412–425. [DOI] [PubMed] [Google Scholar]
- 25.Beveridge, D. L., and F. M. Di Capua. 1989. Free energy via molecular simulation: a primer. In Computer Simulation of Biomolecular Systems. W. F. Van Gunsteren and P. K. Weiner, editors. ESCOM, Leiden. 1–26.
- 26.Kondrashov, D. A., W. Zhang, R. Aranda 4th, B. Stec, and G. N. Phillips Jr. 2008. Sampling of the native conformational ensemble of myoglobin via structures in different crystalline environments. Proteins. 70:353–362. [DOI] [PubMed] [Google Scholar]


