Abstract
In pathological conditions such as ischemic cardiomyopathy and heart failure, differentiation of fibroblasts into myofibroblasts may result in myocyte-fibroblast electrical coupling via gap junctions. We hypothesized that myofibroblast proliferation and increased heterocellular coupling significantly alter two-dimensional cardiac wave propagation and reentry dynamics. Co-cultures of myocytes and myofibroblasts from neonatal rat ventricles were optically mapped using a voltage-sensitive dye during pacing and sustained reentry. The myofibroblast/myocyte ratio was changed systematically, and junctional coupling of the myofibroblasts was reduced or increased using silencing RNAi or adenoviral overexpression of Cx43, respectively. Numerical simulations in two-dimensional models were used to quantify the effects of heterocellular coupling on conduction velocity (CV) and reentry dynamics. In both simulations and experiments, reentry frequency and CV diminished with larger myofibroblast/myocyte area ratios; complexity of propagation increased, resulting in wave fractionation and reentry multiplication. The relationship between CV and coupling was biphasic: an initial decrease in CV was followed by an increase as heterocellular coupling increased. Low heterocellular coupling resulted in fragmented and wavy wavefronts; at high coupling wavefronts became smoother. Heterocellular coupling alters conduction velocity, reentry stability, and complexity of wave propagation. The results provide novel insight into the mechanisms whereby electrical myocyte-myofibroblast interactions modify wave propagation and the propensity to reentrant arrhythmias.
INTRODUCTION
Cardiac fibroblast proliferation and concomitant collagenous matrix accumulation (fibrosis) develop during myocardial remodeling in ischemic, hypertensive, hypertrophic, and dilated cardiomyopathies (1); arrhythmogenic right ventricular cardiomyopathy (2); and heart failure. Fibrosis has been implicated in arrhythmia initiation and maintenance affecting electrical propagation through slow, discontinuous conduction with “zigzag” propagation (3,4), reduced regional coupling (5), abrupt changes in fibrotic bundle size (6), and micro-anatomical reentry (7). Most clinical, experimental, and numerical studies have regarded fibroblasts and fibrosis as electrically insulating obstacles, although some evidence of fibroblast-to-myocyte electrical coupling was shown in the rabbit SA node (8). However, heart injury promotes fibroblast differentiation into myofibroblasts (9), which have been shown to be coupled electrotonically to myocytes in vitro (10–14).
Despite accumulating evidence of potential heterocellular electrical coupling in the diseased myocardium and its implications in arrhythmogenesis, the electrophysiological interplay between myofibroblasts and their neighboring myocytes has not been studied in detail. Myofibroblasts are unexcitable cells; their resting membrane potential is less negative than myocytes, and their membrane resistance is higher (13,15,16). These characteristics suggest that myofibroblasts may function as a sink for electrical charge and as short and long-range conductors (17).
We characterized the effect of heterocellular electrotonic coupling on wave propagation and arrhythmogenesis in myocyte-myofibroblast co-cultures and in numerical models. In the experiments, we employed connexin43 (Cx43) silencing and overexpression techniques to modify the heterocellular coupling. Simulations provided additional mechanistic insights by examining activation patterns and dissecting unique contributions of electrotonic coupling and myofibroblast/myocyte ratio.
METHODS
Heterocellular co-cultures
Cardiocytes from neonatal Sprague-Dawley rats (Charles River, MA) were isolated and cultured according to methods adapted from Miragoli et al (12). All procedures followed institutional guidelines. Briefly, hearts from 1- and 2-day-old rats were aseptically removed and collected in calcium-and-magnesium-free Hank's balanced salt solution (HBSS). Finely minced ventricles were digested in 0.125% trypsin (Roche Applied Science, Indianapolis, IN) and 0.15% pancreatin (Sigma, St. Louis, MO) at 37°C in consecutive 15-min steps. Cell suspensions were centrifuged and resuspended in medium M199 (Cambrex, East Rutherford, NJ) containing 10% fetal bovine serum (FBS) (Cellgro, Lawrence, KS), 20 units/mL penicillin, 20 μg/mL streptomycin. For co-cultures in which myofibroblasts required no treatment before co-culture with myocytes, the heterocellular cell suspension was plated at different cell densities in 35 mm collagen type IV (Sigma)-coated tissue culture dishes to allow myofibroblasts to proliferate resulting in confluent monolayers with varying myocyte/myofibroblast ratios. For cultures in which a low myofibroblast/myocyte ratio was desired, the myofibroblasts were depleted through a two-hour differential preplating. The myofibroblast-rich population obtained during the preplating step was kept under conditions identical to the myocytes. After 6 days in culture myofibroblasts were treated with Cx43 silencing or overexpression agents (see next section) and plated with freshly dissociated myocytes at varying myofibroblast/myocyte ratios. Bromodeoxyuridine was added to the growth media to minimize cell proliferation with consequent RNAi/adenoviral dilution loss. Media changes (with 5% FBS medium) were performed 24 and 72 hr after seeding. Experiments were carried out after 4 additional days in culture at 37°C. In uniform myocyte cultures, the average phase 0 upstroke velocity was 40 V/sec, and the action potential duration (APD) at 80% repolarization (APD80) at 2Hz pacing was 205 ± 20 ms.
Cx43 silencing
Myofibroblasts were transfected with a custom-designed rat-specific Stealth RNAi construct directed against Cx43 (sequence: GGCUUGCUGAGAACCUACAUCAUCA) (Invitrogen, Carlsbad, CA) before co-culture with myocytes. The sequence GAUACACUGCGUUUCGCUUCGAGUA was used as a negative control. RNAi transfection was performed before co-culture with myocytes using Lipofectamine RNAiMAX (Invitrogen) in serum-free M199 medium without antibiotics. Serum was restored after 4 hr. RNAi uptake in myofibroblasts was assessed using BLOCK-iT™ Control Fluorescent Oligo (Invitrogen), and transfection efficiency was found to be ∼80% (Supplementary Material, Data S1).
Cx43 overexpression
We used an AdenoExpress Ad5.CMV-hCx43 (MP Biomedicals, Irvine, CA) adenoviral construct with an Ad5 subtype delta L327, E1 deleted viral backbone with a CMV promoter to overexpress Cx43 in myofibroblast-rich cultures. Myofibroblasts were incubated with the virus at a multiplicity of infection of 5 during 4 hr before co-culture with myocytes. Control myofibroblasts were infected with a GFP adenovirus (Ad_GFP) at the same multiplicity of infection.
Immunohistochemistry
Cells were fixed with 4% paraformaldehyde/phosphate buffered saline PBS, permeabilized with 0.1% Triton/(PBS) and blocked with 5% normal donkey serum/0.05% Tween20 in PBS. Myocytes were identified using a mouse monoclonal antibody directed against sarcomeric α-actinin (Sigma) and a horseradish peroxidase-conjugated secondary antibody (Jackson Immunoresearch, West Grove, PA) in combination with Nova Red horseradish peroxidase substrate (Vector Laboratories, Burlingame, CA). Cx43 expression was assessed in sparsely plated heterocellular preparations using a rabbit primary antibody (Chemicon, Billerica, MA) and fluorochrome-labeled secondary antibodies (Jackson Immunoresearch). Nuclei were stained with 4′,6-Diamidino-2-phenylindole (DAPI). Images were obtained on a Zeiss Axioplan 2e imager equipped with structured illumination (Apotome).
Western blotting
Western immunoblots were performed using anti-Cx43 polyclonal and anti-β-actin monoclonal primary antibodies (Chemicon) diluted to 1:1000 in blocking buffer (5% nonfat dry milk in PBS with 0.05% Tween20). Incubation in primary antibodies was done overnight at 4°C. Incubation in horseradish peroxidase-conjugated anti-rabbit IgG and anti-mouse IgG (Jackson Immunoresearch) (1:10000 dilution) was done in blocking solution for 60 min at room temperature. Immunoreactive bands were visualized with chemiluminescent (Pierce, Rockford, IL). Quantification of the Western blot results was obtained using a BioRad ChemiDoc system.
Optical Mapping
Culture dishes were placed on a heating chamber and continuously superfused at 37°C with HBSS (Sigma) containing (in mmol/L): CaCl2 (1.6), KCl (5.4), MgSO4 (0.8), KH2PO4 (0.4), NaHCO3 (4.2), NaCl (136.9), NaHPO4 (0.3), D-Glucose (5.5), and HEPES (10); and NaOH (pH 7.4). Unless otherwise stated, quiescent preparations were paced (pulse duration, 5 ms; strength, 2× diastolic threshold) using a thin extracellular bipolar electrode. Pacing frequencies started at 1 Hz and increased until loss of 1:1 capture or initiation of reentry. When reentry did not occur spontaneously, it was induced by burst pacing. Membrane voltage was recorded after staining the monolayers with di-8-ANEPPS (40 μmol/L) (Invitrogen) for 10 min. Four-second movies were obtained at 500 frames/s (LabWindows Acquisition) using an 80 × 80 pixel CCD camera (SciMeasure Analytical Systems, Decatur, GA). Phototoxicity was minimized by limiting light exposure to 10–50 s. Signals were amplified, filtered, and digitized for offline analysis. No electromechanical uncouplers were used.
Optical data analysis
Conduction velocity (CV) was measured based on local conduction vectors determined in a central area of the preparations as described (18). Sites of wavebreak marked by phase singularities (PSs) were identified in phase maps (19). PSs are defined as sites toward which all phases of the action potential converge and around which the continuous spatial phase change reflects the processes of excitation, plateau, repolarization, and recovery of the action potential.
Correlation of myocyte/myofibroblast ratio with electrophysiology
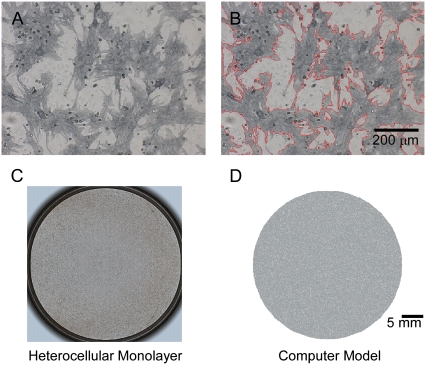
Confluent co-cultures were optically mapped and later immunostained to correlate the degree of myofibroblast infiltration with the electrophysiological parameters measured from fluorescent movies. Myofibroblast shape and area were automatically registered by color thresholding using software analysis in at least 10 random regions in each co-culture dish (Bioquant, Life Science Package, San Diego, CA). In the representative example shown in Fig. 1 A, gray areas are cells positive for sarcomeric α-actinin (myocytes). In Fig. 1 B, red contours automatically generated around non-myocytes (i.e., myofibroblasts; see results for characterization of non-myocytes) demonstrate the accuracy of our measurements.
FIGURE 1.
Quantification of areas occupied by myocytes and myofibroblasts in co-cultures. (A) Neonatal rat myocyte-myofibroblast co-culture after peroxidase stain. (Dark gray areas) cells positive for sarcomeric α-actinin (myocytes). (White areas) myofibroblasts. (B) Areas occupied by myofibroblasts were quantified using BioQuant software based on color contrast (26% of total in this example). (C) Low magnification of dish in A. (D) Computer model of dish in C.
Statistical analysis
Origin software (version 7.0, OriginLab, Northampton, MA) was used for unpaired student t-test and one-way ANOVA; linear regression was used for analyses of CV and reentry frequency. Values are expressed as mean ± SD. p < 0.05 was considered significant.
Numerical methods
For the myocyte transmembrane voltage, the following diffusion-reaction equation was solved, assuming isotropic medium:
 |
(1) |
where Vm [mV] is the transmembrane voltage, Cm [pF] is the membrane capacitance, Istim and Im [pA] are the external stimulation and membrane ionic currents, respectively, and D [mm2·ms−1] is the electrotonic diffusion coupling coefficient, which represents myocyte/myocyte gap junctional coupling. Since there is currently no available mathematical model for the ionic kinetics of neonatal rat ventricular myocytes, Im calculation was based on the mammalian ventricular myocyte model (20). However, we have found this model to be appropriate in our simulations since the global dynamical properties (CV, action potential duration, wavelength, and reentry frequency) were similar in the experimental dishes and simulations, as will be shown below. Discretization and linearization of the differential equation were performed using the finite volume method to inherently ensure current flow conservation in the heterocellular domain (21). The space was divided into a large number of small computational cells; on each, the integral form of Eq. 1,
 |
(2) |
was numerically estimated, where V denotes the cell volume ( is a scalar volume element) and S is the cell's surface (
 is a vector surface element). The right-hand side of Eq. 2 was obtained by employing Gauss' divergence theorem. Reducing Eq. 2 into a two-dimensional (2D) model, discretizing it, and assuming a regular Cartesian grid with a spatial resolution of
  yields:
 |
(3) |
 was set to allow cellular level analysis (100 μm), and the temporal resolution was set to avoid numerical divergence (10 μs,
  The diffusion coefficient, D, was adjusted to match steady state planar wave propagation velocity in experimental cultures encompassing only myocytes (D = 0.03 mm2·ms−1). Fibrotic grid cells were modeled as unexcitable elements, using the following passive differential equation for the transmembrane local voltage, Vf, similar to Eq. 3:
 |
(4) |
Here Cf [pF] is the average capacitance of the myofibroblast patch, which is assumed equal to myocyte capacitance, Vr = −15.9 mV is the resting membrane potential (15), Rf [GΩ] is the membrane resistance of the myofibroblast, and Df [mm2·ms−1] is an average diffusion coefficient of the fibrotic tissue. Df was taken as a fraction of D; i.e.,  represents electrical coupling within myofibroblasts. At the boundary between fibrotic and myocardial tissue, a harmonic average of diffusion coefficients was taken, to maintain current flow conservation, i.e.,
  Rf was defined as a function of Vf to represent the outward rectified I/V characteristic curve of a myofibroblast, so that Rf = 5GΩ for Vf ≥ −20mV, and Rf = 25GΩ otherwise (13,22,23). The finite volume method formulation that is performed on each individual cell coincides with the more common finite difference formulation in the case of a homogeneous myocardial or fibrotic tissue, as can be seen from Eqs. 3 and 4 after the division of both sides by
  However, the technique advantage is that it gives a natural solution to the description of the current flow at the boundaries between myocardial and fibrotic regions, which conforms to physical laws.
A disk-shaped 2D geometry, 3.5 cm in diameter, was constructed with Cartesian resolution of 100 μm per computational cell, which results in a total of 95,093 cells within the disk. For simulating heterocellular dishes, myofibroblast attributes were assigned randomly to a portion of the disk cells to represent various levels of myofibroblast/myocyte area ratios. Diffuse texture was employed, in which singular fibrotic deposits were of the order of one computational cell, to correspond with the experimental texture (e.g., compare monolayer dish and corresponding numerical model in Fig. 1 C and D, both of which have a myofibroblast/myocytes area ratio of 0.25).
Code was written in C using the message passing interface library and run on a 32-processor parallel computer (Microway, Plymouth, MA).
RESULTS
Non-myocyte characterization
We first verified that the non-myocyte cell population that was isolated during the 2-hr differential preplating consisted vastly of myofibroblasts. The phenotype of non-myocytes after 6 days in culture was assessed by immunofluorescence microscopy and Western immunoblots using antibodies directed against sarcomeric α-actinin (SA), α-smooth muscle actin (α-SMA), discoidin domain receptor 2 (DDR2) and von Willebrand factor (VWF) according to Table 1, where + indicates a positive reaction.
TABLE 1.
Identification of non-myocytes using specific antibodies
| Myocytes | Endothelial cells | Smooth muscle cells | Fibroblasts | Myofibroblasts | |
|---|---|---|---|---|---|
| SA | + | − | − | − | − |
| α-SMA | − | − | + | − | + |
| DDR2 | − | − | − | + | + |
| VWF | − | + | − | − | − |
+ indicates a positive reaction; − indicates no reaction.
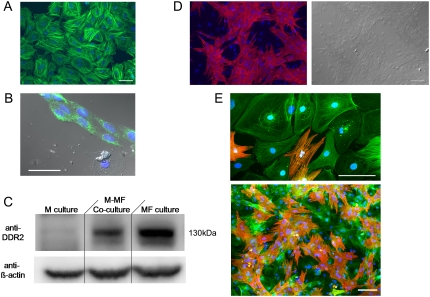
Data obtained from examining 10 myofibroblast-rich preparations immunostained for α-SMA showed that non-myocytes expressed α-SMA in a stress fiber related pattern as illustrated in Fig. 2 A. Out of thousands of cells examined only the nine cells in Fig. 2 B yielded positive reactions for VWF. Ideally immunofluorescence assays using a DDR2 antibody should have been used to confirm that the vast majority of α-SMA positive cells indeed corresponded to myofibroblasts. Unfortunately, none of the antibodies tested was suitable for immunocytochemistry in cultured cells. Hence we performed Western blot analyses in non-myocyte-rich as well as in myocyte-rich and mixed populations. As shown in Fig. 2 C, a 130 kDa immunoreactive band is present in the non-myocyte-rich and mixed populations but not in the myocyte-rich population. These experiments show that our non-myocyte population consists almost exclusively of myofibroblasts (Table 1). Additional micrographs of confluent co-cultured monolayers are given in Fig. 2, confirming the SA antibody specificity to myocytes (Fig. 2 D) and the composition of the heterocellular dishes (Fig. 2 E).
FIGURE 2.
Non-myocyte characterization. (A) Non-myocytes expressing smooth muscle actin (α-SMA) in culture. Scale bar = 50 μm. (B) Fluorescent image showing the expression of VWF (green) in 9 cells. Blue fluorescence corresponds to nuclear specific DAPI stain. Scale bar = 50 μm. (C) Western immunoblot showing DDR2 expression only in cultures containing myofibroblasts. M, myocytes; MF, myofibroblasts. (D) Fluorescent micrograph of confluent co-cultured monolayer confirming sarcomeric α-actinin antibody specificity to myocytes (left) with corresponding phase contrast image (right). (E) Fluorescent micrographs of a co-cultured preparation triple-stained for sarcomeric α-actinin (red), α-SMA (green), and DAPI nuclear probe (blue), demonstrating the specificity of the antibodies used and cellular composition of our dishes. Scale bar = 100 μm.
We have quantified also the purity of our myocyte-rich and myofibroblast-rich populations before co-culture. Immunocytochemistry methods determined that only 8% of the cells in 5 myocyte-rich preparations after 4 days in culture were SA negative and α-SMA positive. As for the the myofibroblast–rich populations, only 11 cells in 5 preparations examined when the preplate was trypsinized after 6 days in culture and re-plated were SA positive and α-SMA negative, which is consistent with the findings by Miragoli et al (12).
Activation patterns during reentry
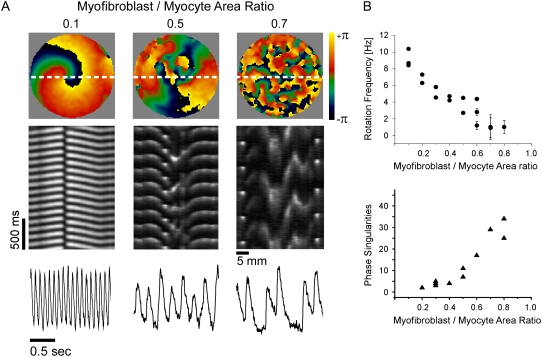
The number of myofibroblasts significantly modified the spatio-temporal characteristics of reentry in a monolayer. Fig. 3 A shows representative examples recorded in monolayers with varying myofibroblast/myocyte ratios. In the phase maps on the top row, each color represents a phase of the action potential; the convergence of all colors at any given location is a phase singularity (19). Clearly, the number of PSs and wavelets multiplied as the myofibroblast/myocyte ratio increased from 0.1 to 0.5 and 0.7. In the middle row, time-space plots (TSPs) (24) were constructed for activity recorded along the horizontal white lines in the phase maps. They demonstrate that increasing the myofibroblast/myocyte ratio increased complexity but decreased reentry frequency. The latter is reflected by the gradual increase in the time intervals between any two consecutive activations in the respective TSP. Yet, despite wave fragmentation, the signals were highly periodic for all cases (Fig. 3 A, bottom row). In addition, these traces demonstrate how the action potential durations are shorter at higher activation rates (i.e., in lower myofibroblast/myocyte area ratios).
FIGURE 3.
Optical mapping of monolayers. (A) Phase maps (top), TSPs (middle), and single pixel recordings (bottom) show increasing number of singularity points with increasing number of myofibroblasts in three experiments; myofibroblast/myocyte area ratios: 0.1, 0.5, and 0.7. (B) Rotation frequency (top, n=19) and number of PSs (bottom, n = 14) as functions of myofibroblast/myocyte area ratio.
In Fig. 3 B rotation frequency (top) and maximal number of PSs counted in five randomly selected snapshots of a 4-s-long phase movie (bottom) are plotted against myofibroblast/myocyte ratio. Each point corresponds to an individual experiment; more than one frequency domain was present at the higher levels of fibrosis, hence the large error bars for those preparations. The graphs demonstrate that while reentry frequency decreased, the number of PSs, and thus the complexity of propagation, increased as the myofibroblast/myocyte ratio increased.
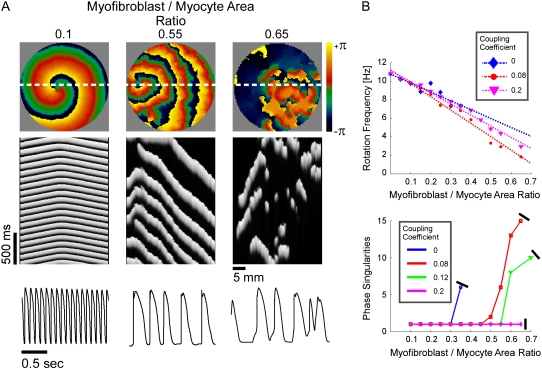
In Fig. 4, a set of computer simulations in which we employed myofibroblast/myocyte area ratios of 0.1, 0.55, and 0.65 further quantified the electrophysiological consequences of increased myofibroblast infiltration. A myofibroblast coupling coefficient,  of 0.08 was used, and reentry was initiated in all cases by S1-S2 cross-field stimulation (100 pA·pF−1, 4-ms duration). Fig. 4 A displays, from top to bottom, phase map snapshots, TSPs, and single pixel recordings. Overall, the numerical results accurately reproduced the experimental data: increasing the myofibroblast/myocyte ratio slowed the rotating frequency and increased the degree of fractionation (see also Supplementary Material, Movie S1, Movie S2, Movie S3, and Movie S4). For a constant proportion of myofibroblasts, an increase in
  yielded a smoother propagation, i.e., the heterocellular coupling acted as a spatial low pass filter (Movie S5). Also in agreement with experiments, propagation wavelength decreased as the proportion of myofibroblasts increased as shown by the reduction in the spatial extension of the excited state (horizontal width of white bands in the TSPs).
FIGURE 4.
Simulations of reentry. All panels organized as in Fig. 2. (A) Phase maps (top), TSPs (middle), and single pixel recordings (bottom) in three simulations with myofibroblast/myocyte area ratios of 0.1, 0.55, and 0.65 and myofibroblast coupling coefficient of 0.08. (B) Rotation frequency (top) and number of PSs (bottom) as functions of myofibroblast/myocyte area ratio and heterocellular coupling.
In Fig. 4 B, rotation frequency and the maximal number of PSs counted in five randomly selected snapshots of 4-s-long phase movies are plotted versus myofibroblast/myocyte area ratio. The superimposed plots correspond to coupling coefficients of 0 (complete isolation), 0.08, and 0.2 to simulate increasing levels of myofibroblast-to-myocyte communication. An additional graph corresponding to a coupling coefficient of 0.12 is given in the analysis of PSs. Consistently, the relationship between rotation frequency and myofibroblast/myocyte ratio was linear. However, the effect of electrical coupling was nonlinear and in fact non-monotonic. Regression analysis yielded change rates of −0.096 for 0-coupling, then reduced to −0.144 for 0.08, and increased back to −0.111 Hz·%−1 for 0.2 coupling.
It should be noted in Fig. 4 B that, with the exception of  for each level of myofibroblast coupling there was a different “take-off” myofibroblast/myocyte area value from which the number of PSs increased from 1, representing a single rotor, to a larger number. Further, the take-off value was higher for larger
  values (0.35, 0.5, and 0.6 for
  values of 0, 0.08, and 0.12, respectively). Moreover, for all levels of coupling, propagation was blocked above a certain myofibroblast/myocyte ratio because of conduction failure (Fig. 4 B, black lines). But in general, simulations exhibiting lower values of heterocellular coupling were blocked at lower myofibroblast/myocyte ratios. Finally, in the case of 0.2 coupling, propagation was blocked above a myofibroblast/myocyte area ratio of 0.65; no take-off was observed below that level. Overall, a similar dependency of PS number on myofibroblast/myocyte ratios was established. The number of PSs remained at 1 up to a take-off value above which it grew sharply.
Heterocellular coupling and CV
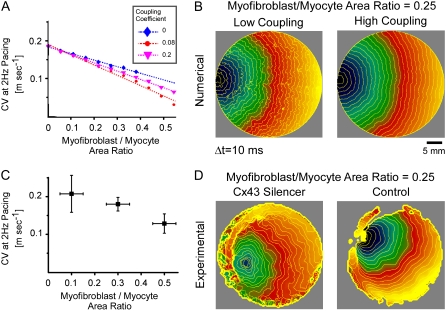
CV is an important dynamic property with respect to propagation and wavebreak formation. In Fig. 5 A, the relationship between CV and myofibroblast/myocytes area ratio was measured in computer simulations at a pacing frequency of 2 Hz, and a linear relationship was found. However, as with rotation frequency (Fig. 4 B), comparison among three levels of  demonstrated a non-monotonic dependence of CV on myocyte/myofibroblast coupling. Whereas the rate of change decreased from
  at 0-coupling to
  at 0.08 coupling, it increased back to
  m·sec−1·%−1 at 0.2 coupling. In Fig. 5 B, numerical simulation activation maps are shown for a myofibroblast/myocyte area ratio of 0.25 and at low and high heterocellular coupling. The maps demonstrate quite similar CV values, as indicated by the graphs in Fig. 5 A. However, wavefront texture was distinctly affected by the coupling level: propagation was highly heterogeneous at low coupling, with wavy isochrones suggestive of microstructural delays and transient wavebreaks. In contrast, high coupling resulted in relatively smooth wavefronts. CV was also measured in co-cultured monolayers paced at 2 Hz, as shown in Fig. 5 C. It decreased significantly (p < 0.05) as a function of the myofibroblast/myocyte area ratio for values of 0.1, 0.3, and 0.5. The activation maps shown in D provide experimental validation for the differences in wavefront texture that were shown numerically in B. Note that the condition of low heterocellular coupling was achieved with a specific Cx43 silencer that was targeted against myofibroblasts as further detailed in the next section.
FIGURE 5.
Conduction velocity at 2 Hz versus percentage of myofibroblasts. (A) Simulation results, with three levels of myofibroblast coupling coefficient. (B) Typical activation maps (myofibroblast/myocyte area ratio = 0.25, low and high myofibroblast coupling coefficients) showing fragmented wavefronts at low coupling. (C) Experimental results, n = 15; p < 0.05. (D) Typical activation maps (myofibroblast/myocyte area ratio = 0.25, with and without myofibroblast Cx43 silencer) reproduce numerical prediction.
Propagation patterns and coupling
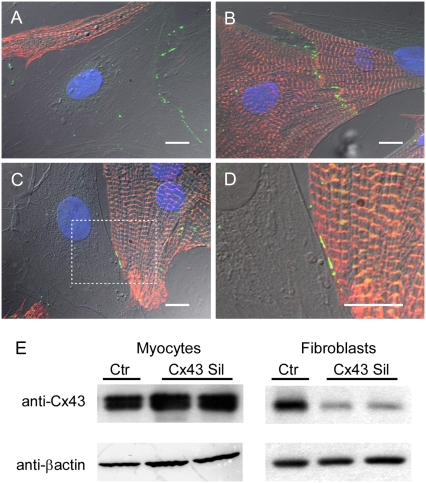
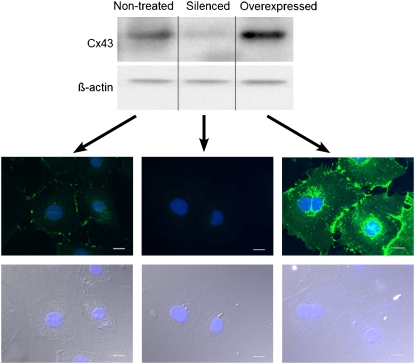
The absolute requirement for heterocellular coupling to explain our findings remains to be formally proven. In principle, the question could be answered using a pharmacological approach. To our knowledge, no specific pharmacological electrical uncoupler exists that could give full assurance that membrane ion channels other than gap junctions would not be affected. Therefore, we first investigated whether our co-culture monolayers expressed the major cardiac gap junction protein Cx43. In agreement with previous reports (11,12), Fig. 6 demonstrates that Cx43 (green) was present at junctions between neighboring myofibroblasts (A), between myocytes (B) and between myocytes and myofibroblasts (C; higher magnification in D). We then proceeded to determine whether or not it was possible to silence Cx43 in myofibroblasts by transfection of a custom-designed rat-specific Stealth RNAi construct directed against Cx43. The Western immunoblots in Fig. 6 E show the results for myocyte-rich (left) and myofibroblast-rich (right) populations transfected with either the Cx43 siRNA or the control siRNA. A significant reduction in the signal was observed only in samples from cultured fibroblasts transfected with the Cx43 silencer. In contrast, the signal was not reduced for the cultured myocytes. Quantification of Cx43 expression levels by normalization to β-actin loading controls showed that, compared with control myofibroblasts, expression was reduced by 90% (p < 10−8, n = 3) in silenced myofibroblasts and increased by 99% (p < 0.01, n = 3) in Cx43 overexpressing myofibroblasts compared with controls infected with Ad_GFP (data not shown). Further, representative data from Western immunoblots and immunofluorescence (Fig. 7 and additional micrograph in Data S1) demonstrate how Cx43 expression is attenuated in silenced myofibroblasts and amplified in myofibroblasts compared with nontreated myofibroblasts.
FIGURE 6.
Immunofluorescence samples showing Cx43-positive staining (green) between two myofibroblasts (A), between two myocytes (B), and between a myocyte and a myofibroblast (C and D; higher magnification of box in C). Myocyte-specific sarcomeric α-actinin in red and nuclei in blue. Scale bars, 10 μm. (E) Western blots from cardiomyocytes after transfection of Cx43 siRNA (Cx43 Sil) or a control siRNA (Ctr). Abundance of Cx43 in myocyte or fibroblast monocultures was assessed to determine preferential Cx43 silencing in fibroblasts. Duplicate immunoblot probed with anti-βactin antibody demonstrates equivalent loading of samples.
FIGURE 7.
Western blots from nontreated myofibroblasts as well as myofibroblasts 24 hr after treatment with siRNA silencer or Cx43 adenovirus. Representative exposure-matched immunofluorescence images for each myofibroblast treatment condition are shown, Cx43 is stained in green, scale bars are 20 μm.
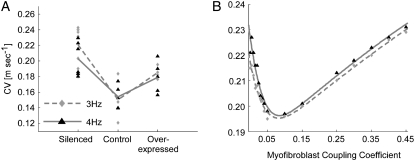
We then investigated the effect of myofibroblast Cx43 silencing and overexpression on CV during steady-state pacing in co-cultures with a fixed myofibroblast/myocyte area ratio of 0.25. In Fig. 8 A, measured CV values are shown for three myofibroblast coupling levels (i.e., silenced, control, and overexpressed) and pacing frequencies of 3 and 4 Hz (diamonds and triangles, respectively). Each symbol corresponds to one experiment, and the lines connect the mean CV values in each coupling condition and pacing frequency. There was no significant difference in the means between the 3- and 4- Hz data points within each condition (unpaired t-test, p = 0.20, 0.84, and 0.55 for the silenced, control, and overexpressed conditions). A clear biphasic dependency of CV on myofibroblast Cx43 expression level, and thus on heterocellular coupling level, was observed. An increase in coupling from silenced to control myofibroblasts resulted in significantly reduced CV values (p = 0.004, 0.002 for 3 and 4 Hz, respectively), whereas a further increase in coupling level from control to overexpressed myofibroblasts resulted in increased CV values.
FIGURE 8.
Effects of heterocellular electrical coupling during pacing in 2D monolayers and simulations. (A) Experimental CV versus myofibroblast coupling coefficient for pacing at 3 (diamonds) and 4 Hz (triangles). Three levels of myofibroblast coupling were achieved using Cx43 siRNA treated myofibroblasts (silenced), control myofibroblasts and Cx43 overexpressed myofibroblasts (overexpressed). (B) Numerical results for CV versus myofibroblast coupling coefficient for pacing at 3 and 4 Hz. All simulations and experiments were performed for a myofibroblast/myocyte area ratio of 0.25.
In Fig. 8 B, the relationship between CV and myofibroblast coupling was determined in parallel simulations using similar pacing rates and myofibroblast/myocyte ratio. The  value was increased gradually from 0 to 0.45, which demonstrated a clear non-monotonic dependence of CV on coupling; CV decreased as
  increased to ∼0.07, then it increased, resulting in a biphasic relationship. At high degrees of electrical coupling, CV accelerated to a level above the zero coupling value (∼0.22 m·s−1). Additionally, there was no significant difference in CV values when the model was paced at 4 Hz compared with 3 Hz. These numerical results are remarkably similar to the experimental results shown in Fig. 8 A, and suggest that for a given myofibroblast/myocyte area ratio, a similar value of CV can be observed for two different levels of heterocellular coupling.
DISCUSSION
We investigated the effects of myocyte-myofibroblast interactions on wave propagation dynamics and reentry in co-cultured monolayers and computer simulations. The major findings are as follows: 1), Frequency of reentry and CV diminish with larger myofibroblast/myocyte area ratios, whereas complexity of propagation increases, resulting in fractionation, wavebreaks, and increased number of wavelets. 2), The effects of myofibroblast-to-myocyte coupling on rotation frequency and CV are non-monotonic. Heterocellular interactions result in a biphasic relationship between CV and electrical coupling, whereby an initial decrease in velocity is followed by a monotonic increase as the coupling coefficient increases. Thus, the same value of CV may appear at two widely different coupling levels. 3), The degree of heterocellular coupling has an impact on the stability of reentry and on the complexity of wave propagation therein. Importantly, propagation is highly heterogeneous at a low level of coupling, with fragmentation and wavy isochrones suggestive of microstructural delays and transient wavebreaks. 4), Increased myofibroblast-to-myocyte coupling supports electrical activity at higher ratios of myofibroblast infiltrations, but on the other hand reduces the number of spatially distributed singularity points.
Myofibroblasts interaction within the cardiac tissue
Although occupying a small portion of the myocardial tissue volume, cardiac fibroblasts account for 50–70% of the cells of the normal adult mammalian heart, and even more in pathological conditions, where differentiation into the myofibroblast phenotype also occurs (10,25). This observation highlights the significance of investigating the electrophysiological properties of these “sentinel cells” (26), the impact of their interactions with myocytes, their effect on cardiac impulse propagation, and their possible arrhythmogenic role. It has been long recognized that fibroblasts interact with myocytes at several levels. Rook et al. (13) showed that neonatal rat cardiac fibroblasts can connect electrically with other fibroblasts and with myocytes with single channel conductance values of 21 pS and 32 pS, respectively. They also found evidence for Cx43 gap junctions between myocytes and fibroblasts. Gaudesius et al. (11) and Miragoli et al. (12) were first to demonstrate Cx43 and Cx45 expression both between myofibroblasts and at myofibroblast-to-myocyte junctions in cardiac strands.
Several in silico and in vitro models in recent years have specifically quantified the effects of heterocellular coupling between myofibroblasts and myocytes on the electrical activity and passive properties of myocardial tissue. MacCannell et al. (27) showed in a mathematical model that myofibroblasts cause a shortening of the adjacent myocytes' APD, which reduces the plateau height of the action potential. The resting potential of the myofibroblasts was significantly hyperpolarized to become close to that of the coupled ventricular myocyte. This conclusion is consistent with the findings of Rook et al. (13), which showed that, within a co-culture, the resting potential of myofibroblasts hyperpolarized approximately to that of connected myocytes. A different result was presented in the study by Miragoli et al. (12) in which the impulse conduction velocity and maximal upstroke gradient were assessed in cultured strands of myocytes coated with myofibroblasts from neonatal rat hearts. Increasing the density of myofibroblasts increased conduction velocity and upstroke gradient up to a certain threshold, followed by a decline of these two properties. The group found that this nonlinear effect is due to the gradual depolarization of the myocyte resting membrane potential from −78 mV to −50 mV as the density of myofibroblasts increases. This study has demonstrated the role of myofibroblasts as current sinks for electrical propagation. A previous study from the same group (11) showed a different possible effect of myofibroblast deposits within the myocardium—i.e., myofibroblast deposits as long range conductors. The investigators co-cultured neonatal rat ventricular myocytes and fibroblasts in a pattern of myocyte strands interrupted with fibroblasts over various distances. They concluded that successful, albeit delayed, conduction along such a disturbed myocyte strand is possible if the myofibroblast patch is shorter than 300 μm.
In our simulations, during reentry heterocellular coupling and myofibroblast density had minor effects on the resting membrane potential and the APD of myocytes, in accordance with the studies of MacCannell et al. (27) and Rook et al. (13) However, the effect on depolarization rate was substantial. For a myofibroblast/myocyte area ratio of 0.05, an increase of the heterocellular coupling coefficient from 0 (no coupling) to 0.2 resulted in a slight increase of 2.7% in APD90 and no difference in the depolarization rate. On the other hand, for an area ratio of 0.5, whereas increasing the coupling coefficient from 0 to 0.2 resulted in an even lesser increase of APD90 (2.5% change), the depolarization rate decreased by 70%. Our computer simulations therefore show that density and coupling of myofibroblasts in heterocellular co-cultures have a marginal effect on the action potential of myocytes in terms of resting membrane potential and APD but have a substantial influence on depolarization rate. This observation may explain, in part, the influence observed on conduction velocity (Figs. 5 and 8).
Effects of myofibroblasts on 2D propagation
In our experiments, CV was a function of total myofibroblast area, consistent with previous studies (11,12). In addition, we found that both frequency of reentry and complexity of wave propagation depended on the relative area occupied by myofibroblasts. In some aspects, these results resemble those reported in embryonic chick myocyte monolayers in which culture confluence was varied, resulting in changing ratios of myocytes and anatomical insulating obstacles that were empty of myocytes (28–30). However, an important difference is that here the non-myocyte passive gaps were electrically coupled to the myocytes. In that regard, our model is somewhat more closely related to a recent study in co-cultures of human mesenchymal stem cells and neonatal rat ventricular myocytes, which were also found to form heterocellular gap junctions (31).
Numerical simulations enabled us to factorize the relative contributions of myofibroblast quantity and electrical properties. These simulations successfully reproduced the experimental results with respect to the effect of the myofibroblast population on both propagation and reentry. The simulations predicted a non-monotonic, biphasic effect of myofibroblast/myocyte electrical coupling on CV (Figs. 3 B, 5 B, and 8 B), which was borne out experimentally by the use of Cx43 RNA silencer and Cx43 overexpression in the cultured myofibroblasts. Whereas precise control of the degree of coupling was unattainable, we demonstrated a lower CV in the control co-cultures than in the co-cultures in which Cx43 was either silenced or overexpressed.
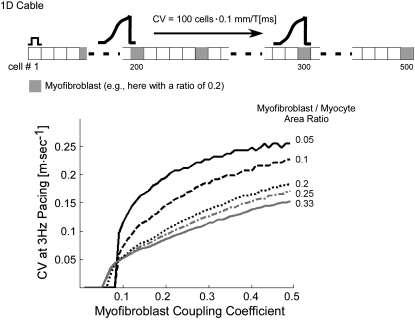
To gain insight into the mechanisms underlying the biphasic dependence of CV on heterocellular electrical coupling (Fig. 8), we performed simulations using a one-dimensional (1D) cable model (Fig. 9, inset) consisting of 500 100 μm cells. “Myofibroblasts” were interspaced between “myocytes” at constant intervals and at myofibroblast/myocyte ratios ranging between 0.05 and 0.33. For each ratio, the left-most cell in the cable was paced at 3 Hz and myofibroblast-to-myocyte coupling coefficient was changed between 0.01 and 0.5 while myocyte-to-myocyte coupling remained constant. CV was calculated for impulses moving across the central 100 cells (i.e., between cells numbered 200 and 300). The plots in Fig. 9 demonstrate that a similar pattern repeated for all myofibroblast/myocyte ratios: propagation was blocked (i.e., did not reach cell 300) up to a threshold level of coupling above which CV increased first abruptly and then more moderately. Both threshold and overall CV were low for high levels of myofibroblast infiltration, and CV increased as the coupling coefficient increased. Interestingly, the coupling threshold for propagation in 1D was similar to the threshold above which CV increased in the 2D model (∼0.07, compare with Fig. 8 B).
FIGURE 9.
1D cable simulations with uniform diffuse fibroblast distribution. (Inset) cable model consisting of 500 cells. Conduction velocity was calculated from the time of impulse propagation across the middle 100 cells and plotted as a function of myofibroblast coupling coefficients for various myofibroblast/myocyte ratios.
The above results lead to the following interpretation regarding the biphasic dependence of CV on myofibroblast-to-myocyte coupling (Fig. 8 B). At very low levels of coupling the wavefront entering the myofibroblasts is insufficient to transmit enough depolarizing current downstream to the neighboring myocytes. Thus, at these levels the myofibroblasts behave as current sinks that hamper successful propagation. In the 1D cable this condition resulted in propagation block (Fig. 9). However, in 2D, the wavefront finds alternative pathways and circumnavigates the myofibroblast. Therefore, conduction is maintained via these alternative pathways at the expense of overall CV and is characterized by heterogeneous wave propagation. As coupling increases toward the threshold level, myofibroblasts drain more and more charge from their neighboring myocytes, resulting in further CV decrease, which explains the left half of the curve in Fig. 8 B. Above threshold, however, the excitation wave provides enough charge through the myofibroblasts to excite downstream myocytes. At this point the myofibroblasts switch from being charge sinks to become short-range charge transmitters that facilitate downstream excitation with increasing levels of coupling. Hence, wavefronts become smoother, and velocity increases, which explains the right half of the curve in Fig. 8 B.
Clinical implications
Cardiac injuries such as myocardial infarction may lead to structural remodeling with fibroblast activation, differentiation into myofibroblast, and proliferation leading to increased production and accumulation of extracellular matrix (32). Although compact fibrosis may arise in an infarct scar, it usually exhibits a mixture of collagen, myofibroblasts, and myocardial fibers. Such a structure increases the complexity of electrical conduction within a labyrinth of surviving myocardial bundles (33). In addition to myocardial infarction, fibrosis develops in other pathologies: dilated cardiomyopathy is often associated with mild focal interstitial fibrosis; hypertrophic cardiomyopathy and arrhythmogenic right ventricular cardiomyopathy are genetic disorders characterized by widespread fibrosis and myocardial fibro-fatty replacement, respectively.
It is highly probable that under physiological conditions at least one fibroblast is in contact with every myocyte (10). Since myocytes do not proliferate, during fibrosis the ratio of (myo)fibroblasts/myocytes increases even further. This study provides insight into the consequences of such enhanced interactions. In addition to the well-recognized arrhythmogenic effect of loss of myocyte connectivity because of the excessive extracellular matrix, the coupling between myocytes and myofibroblasts plays a role in the mechanisms of arrhythmias. From this perspective, cardiac (myo)fibroblasts are a potential target for regulation.
Limitations
Abnormal proliferation and differentiation of fibroblasts result in the concomitant production and accumulation of collagenous matrix (fibrosis), which results in the formation of partial or total insulating barriers between cells. We did not consider this insulating effect in our study. Electromechanical feedback between myocytes and fibroblasts may result in mechanically induced potentials in the fibroblasts and possibly myofibroblasts (15,16). This effect has been attributed to activation of stretch-activated channels that are permeable to Na+, K+, and Ca2+, which results in hyperpolarization and depolarization of the fibroblast membrane potential during atrial relaxation and contraction, respectively. The importance of these channels may be high in vivo but negligible in our cell cultures. Thus we did not account for such effects in our numerical models. We assumed a similar membrane capacitance for myofibroblasts as for myocytes, which was based on observation that these cells exhibit similar dimensions in our co-cultures (Figs. 2 and 6). It is however known that fibroblasts are ∼20 times smaller than myocytes in vivo and in isolation (23), which imposes a potential limitation to our study. Still, we have consistently used the measure of myofibroblast/myocyte area ratio, and therefore one computational fibrotic cell may realistically represent a small cluster of a few myofibroblasts rather than one biological cell. Finally, we did not study any paracrine effects that fibroblasts/myofibroblasts may have on the phenotype of cultured cardiomyocytes as it is beyond the scope of this work. Recently, it was found that cardiomyocytes cultured in fibroblast-conditioned medium were hypertrophied and had diminished contractile capacity and distinct plasticity (34). However, of most importance, these cells were not affected with respect to the Cx43 expression (Fig. 1 B in Laframboise et al. (34)), and thus electrical coupling was not altered. Therefore altered electrical propagation in the heterocellular cultures was largely independent of paracrine factors.
SUPPLEMENTARY MATERIAL
To view all of the supplemental files associated with this article, visit www.biophysj.org.
Supplementary Material
Acknowledgments
This work was supported by the Michel Mirowski International Fellowship in Cardiac Pacing and Electrophysiology from the Heart Rhythm Society to V.M., National Heart Lung and Blood Institute Grants P01-HL039707, P01-HL087226 and R01-HL070074 to J.J.
Sharon Zlochiver and Viviana Muñoz contributed equally to this work.
Editor: David A. Eisner.
References
- 1.Manabe, I., T. Shindo, and R. Nagai. 2002. Gene expression in fibroblasts and fibrosis: involvement in cardiac hypertrophy. Circ. Res. 9112:1103–1113. [DOI] [PubMed] [Google Scholar]
- 2.Brown, R. D., S. K. Ambler, M. D. Mitchell, and C. S. Long. 2005. The cardiac fibroblast: therapeutic target in myocardial remodeling and failure. Annu. Rev. Pharmacol. Toxicol. 45:657–687. [DOI] [PubMed] [Google Scholar]
- 3.de Bakker, J. M., F. J. van Capelle, M. J. Janse, S. Tasseron, J. T. Vermeulen, N. de Jonge, and J. R. Lahpor. 1993. Slow conduction in the infarcted human heart. ‘Zigzag’ course of activation. Circulation. 88:915–926. [DOI] [PubMed] [Google Scholar]
- 4.Bian, W., and L. Tung. 2006. Structure-related initiation of reentry by rapid pacing in monolayers of cardiac cells. Circ. Res. 98:e29–e38. [DOI] [PubMed] [Google Scholar]
- 5.Spach, M. S., and J. P. Boineau. 1997. Microfibrosis produces electrical load variations due to loss of side-to-side cell connections: a major mechanism of structural heart disease arrhythmias. Pacing Clin. Electrophysiol. 20:397–413. [DOI] [PubMed] [Google Scholar]
- 6.de Bakker, J. M., M. Stein, and H. V. van Rijen. 2005. Three-dimensional anatomic structure as substrate for ventricular tachycardia/ventricular fibrillation. Heart Rhythm. 2:777–779. [DOI] [PubMed] [Google Scholar]
- 7.Valderrabano, M., Y. H. Kim, M. Yashima, T. J. Wu, H. S. Karagueuzian, and P. S. Chen. 2000. Obstacle-induced transition from ventricular fibrillation to tachycardia in isolated swine right ventricles: insights into the transition dynamics and implications for the critical mass. J. Am. Coll. Cardiol. 36:2000–2008. [DOI] [PubMed] [Google Scholar]
- 8.Camelliti, P., C. R. Green, I. LeGrice, and P. Kohl. 2004. Fibroblast network in rabbit sinoatrial node: structural and functional identification of homogeneous and heterogeneous cell coupling. Circ. Res. 94:828–835. [DOI] [PubMed] [Google Scholar]
- 9.Weber, K. T. 1995. The Dead Sea lives! Someone's rockin' my dreamboat. Cardiovasc. Res. 29:604–610. [PubMed] [Google Scholar]
- 10.Camelliti, P., T. K. Borg, and P. Kohl. 2005. Structural and functional characterisation of cardiac fibroblasts. Cardiovasc. Res. 65:40–51. [DOI] [PubMed] [Google Scholar]
- 11.Gaudesius, G., M. Miragoli, S. P. Thomas, and S. Rohr. 2003. Coupling of cardiac electrical activity over extended distances by fibroblasts of cardiac origin. Circ. Res. 93:421–428. [DOI] [PubMed] [Google Scholar]
- 12.Miragoli, M., G. Gaudesius, and S. Rohr. 2006. Electrotonic modulation of cardiac impulse conduction by myofibroblasts. Circ. Res. 98:801–810. [DOI] [PubMed] [Google Scholar]
- 13.Rook, M. B., A. C. van Ginneken, B. de Jonge, A. el Aoumari, D. Gros, and H. J. Jongsma. 1992. Differences in gap junction channels between cardiac myocytes, fibroblasts, and heterologous pairs. Am. J. Physiol. 263:C959–C977. [DOI] [PubMed] [Google Scholar]
- 14.Goshima, K. 1970. Formation of nexuses and electrotonic transmission between myocardial and FL cells in monolayer culture. Exp. Cell Res. 63:124–130. [DOI] [PubMed] [Google Scholar]
- 15.Kamkin, A., I. Kiseleva, K. D. Wagner, A. Lammerich, J. Bohm, P. B. Persson, and J. Gunther. 1999. Mechanically induced potentials in fibroblasts from human right atrium. Exp. Physiol. 84:347–356. [PubMed] [Google Scholar]
- 16.Kohl, P., A. G. Kamkin, I. S. Kiseleva, and D. Noble. 1994. Mechanosensitive fibroblasts in the sino-atrial node region of rat heart: interaction with cardiomyocytes and possible role. Exp. Physiol. 79:943–956. [DOI] [PubMed] [Google Scholar]
- 17.Kohl, P., P. Camelliti, F. L. Burton, and G. L. Smith. 2005. Electrical coupling of fibroblasts and myocytes: relevance for cardiac propagation. J. Electrocardiol. 38(4, Suppl)45–50. [DOI] [PubMed] [Google Scholar]
- 18.Morley, G. E., D. Vaidya, F. H. Samie, C. Lo, M. Delmar, and J. Jalife. 1999. Characterization of conduction in the ventricles of normal and heterozygous Cx43 knockout mice using optical mapping. J. Cardiovasc. Electrophysiol. 10:1361–1375. [DOI] [PubMed] [Google Scholar]
- 19.Gray, R. A., A. M. Pertsov, and J. Jalife. 1998. Spatial and temporal organization during cardiac fibrillation. Nature. 392:75–78. [DOI] [PubMed] [Google Scholar]
- 20.Viswanathan, P. C., R. M. Shaw, and Y. Rudy. 1999. Effects of IKr and IKs heterogeneity on action potential duration and its rate dependence: a simulation study. Circulation. 99:2466–2474. [DOI] [PubMed] [Google Scholar]
- 21.Abboud, S., Y. Eshel, S. Levy, and M. Rosenfeld. 1994. Numerical calculation of the potential distribution due to dipole sources in a spherical model of the head. Comput. Biomed. Res. 27:441–455. [DOI] [PubMed] [Google Scholar]
- 22.Shibukawa, Y., E. L. Chilton, K. A. MacCannell, R. B. Clark, and W. R. Giles. 2005. K+ currents activated by depolarization in cardiac fibroblasts. Biophys. J. 88:3924–3935. [DOI] [PMC free article] [PubMed] [Google Scholar]
- 23.Chilton, L., S. Ohya, D. Freed, E. George, V. Drobic, Y. Shibukawa, K. A. MacCannell, Y. Imaizumi, R. B. Clark, I. M. Dixon, and W. R. Giles. 2005. K+ currents regulate the resting membrane potential, proliferation, and contractile responses in ventricular fibroblasts and myofibroblasts. Am. J. Physiol. Heart Circ. Physiol. 288:H2931–H2939. [DOI] [PubMed] [Google Scholar]
- 24.Pertsov, A. M., J. M. Davidenko, R. Salomonsz, W. T. Baxter, and J. Jalife. 1993. Spiral waves of excitation underlie reentrant activity in isolated cardiac muscle. Circ. Res. 72:631–650. [DOI] [PubMed] [Google Scholar]
- 25.Baudino, T. A., W. Carver, W. Giles, and T. K. Borg. 2006. Cardiac fibroblasts: friend or foe? Am. J. Physiol. Heart Circ. Physiol. 291:H1015–H1026. [DOI] [PubMed] [Google Scholar]
- 26.Smith, R. S., T. J. Smith, T. M. Blieden, and R. P. Phipps. 1997. Fibroblasts as sentinel cells. Synthesis of chemokines and regulation of inflammation. Am. J. Pathol. 151:317–322. [PMC free article] [PubMed] [Google Scholar]
- 27.MacCannell, K. A., H. Bazzazi, L. Chilton, Y. Shibukawa, R. B. Clark, and W. R. Giles. 2007. A mathematical model of electrotonic interactions between ventricular myocytes and fibroblasts. Biophys. J. 92:4121–4132. [DOI] [PMC free article] [PubMed] [Google Scholar]
- 28.Bub, G., A. Shrier, and L. Glass. 2005. Global organization of dynamics in oscillatory heterogeneous excitable media. Phys. Rev. Lett. 94:028105. [DOI] [PubMed] [Google Scholar]
- 29.Bub, G., K. Tateno, A. Shrier, and L. Glass. 2003. Spontaneous initiation and termination of complex rhythms in cardiac cell culture. J. Cardiovasc. Electrophysiol. 14(10, Suppl)S229–S236. [DOI] [PubMed] [Google Scholar]
- 30.Steinberg, B. E., L. Glass, A. Shrier, and G. Bub. 1842. 2006. The role of heterogeneities and intercellular coupling in wave propagation in cardiac tissue. Philos. Transact. A Math Phys. Eng. Sci. 364:1299–1311. [DOI] [PubMed] [Google Scholar]
- 31.Chang, M. G., L. Tung, R. B. Sekar, C. Y. Chang, J. Cysyk, P. Dong, E. Marban, and M. R. Abraham. 2006. Proarrhythmic potential of mesenchymal stem cell transplantation revealed in an in vitro coculture model. Circulation. 113:1832–1841. [DOI] [PubMed] [Google Scholar]
- 32.Diez, J., B. Lopez, A. Gonzalez, and R. Querejeta. 2001. Clinical aspects of hypertensive myocardial fibrosis. Curr. Opin. Cardiol. 16:328–335. [DOI] [PubMed] [Google Scholar]
- 33.Kawara, T., R. Derksen, J. R. de Groot, R. Coronel, S. Tasseron, A. C. Linnenbank, R. N. Hauer, H. Kirkels, M. J. Janse, and J. M. de Bakker. 2001. Activation delay after premature stimulation in chronically diseased human myocardium relates to the architecture of interstitial fibrosis. Circulation. 104:3069–3075. [DOI] [PubMed] [Google Scholar]
- 34.Laframboise, W. A., D. Scalise, P. Stoodley, S. R. Graner, R. D. Guthrie, J. A. Magovern, and M. J. Becich. 2007. Cardiac fibroblasts influence cardiomyocyte phenotype in vitro. Am. J. Physiol. Cell Physiol. 292:C1799–C1808. [DOI] [PubMed] [Google Scholar]
Associated Data
This section collects any data citations, data availability statements, or supplementary materials included in this article.


