

Abstract
We describe a 9-year-old male referred for genetic evaluation for Prader-Willi syndrome (PWS). PWS is the most common genetically-defined cause of life-threatening obesity and results from a functional loss of paternally-expressed genes from the chromosome 15q11-q13 region. The patient presented with pervasive developmental disorder, delayed speech and rapid onset of obesity at age 4 years, all features similar to PWS. However, chromosome 15q11-q13 methylation testing and fragile X studies were normal. GTG-banding and fluorescence in situ hybridization with whole chromosome 3 paint probe and a chromosome 3p subtelomeric probe suggested a duplication of 3p25.3p26.2, a finding supported by comparative genomic hybridization. This region of chromosome 3p contains genes which contribute to obesity and behavioral problems, most notably, ghrelin (GHRL), an oxytocin receptor (OXTR), solute carrier family 6 members (GABA neurotransmitter transporters, SLC6A1 and SLC6A11) and peroxisome proliferator-activated receptor, gamma (PPARG). To characterize these obesity and behavior related genes in our subject, we performed quantitative RT-PCR and compared expression levels with similarly aged male subjects (four nonobese males, four obese males and four PWS males - two with 15q11-q13 deletions and two with maternal disomy 15). Our studies suggest increased expression of several genes in the 3p duplication region, including GHRL and PPARG, which may contribute to the phenotypic features in our 3p duplication subject.
Keywords: obesity, pervasive developmental disorder, comparative genomic hybridization, gene expression, ghrelin (GHRL), peroxisome proliferator-activated receptor, gamma (PPARG), oxytocin receptor (OXTR), RT-PCR, Prader-Willi syndrome (PWS)
INTRODUCTION
Prader-Willi syndrome (PWS) is characterized by infantile hypotonia, feeding difficulties, hypogonadism, small hands and feet, mental deficiency, behavioral problems, hyperphagia leading to obesity in early childhood, and a particular facial appearance [Cassidy, 1997; Butler and Thompson, 2000]. Recently, abnormal levels of neuroendocrine peptides have been reported in PWS involved in regulating eating behavior, such as ghrelin produced by the stomach and peptide YY produced by the intestine [Cummings et al., 2002; Haqq et al., 2003; Butler et al., 2004]. A deletion of the paternal 15q11-q13 region is found in about 70% of PWS subjects, maternal disomy 15 or UPD in approximately 25%, and a defect in imprinting in the remaining subjects [Butler and Thompson, 2000]. The chromosome 15q11-q13 region is known to contain imprinted sequences that are differentially expressed depending on the parent of origin. Imprinted gene expression is coordinately controlled in cis by an imprinting center (IC) which regulates the establishment of parental specific allelic differences in DNA methylation, chromatin structure, and expression [Brannan and Bartolomei, 1999; Nicholls and Knepper, 2001]. The 15q11-q13 region contains about 5 million base pairs of DNA, and recent evidence supports the existence of at least 30 presumed genes in the region [Bittel et al., 2003; Chai et al., 2003]. However, no single gene has as yet been conclusively shown to account for the PWS phenotype. Furthermore, it is unclear how changes in gene expression resulting from both loss of imprinted genes and reduced expression of non-imprinted genes lead to the clinical manifestations associated with PWS.
Although the chromosome 15q11-q13 region is involved with obesity and behavioral problems, there are many other involved genes outside of this chromosomal region. Some of these genes are located on chromosome 3p including: ghrelin (GHRL), an endogenous ligand for the growth hormone secretagogue receptor involved in regulating growth hormone and appetite; an oxytocin receptor (OXTR), involved in regulating the specificity of oxytocin action; gamma-aminobutyric acid (GABA) transporters, SLC6A1 and SLC6A11 - GABA is an important inhibitory neurotransmitter; and peroxisome proliferator-activated receptor, gamma (PPARG).
The PPARG gene, which produces two isoforms (PPARG 1 and PPARG2; Sewter et al., 2002), has received considerable attention because of its association with obesity [Doney et al., 2002; Cock et al., 2004; Hegele, 2004; Kintscher and Law, 2005; Kota et al., 2005]. For example, heterozygous Pparg-deficient mice showed overexpression and hypersecretion of leptin despite the smaller size of adipocytes and decreased fat mass. In addition, heterozygous Pparg-deficient mice were less susceptible to insulin resistance due to adipocyte hypertrophy suggesting reduced Pparg expression was protective [Kubota et al., 1999]. Multiple reports have documented that activated PPARG induces the expression of genes involved in lipid metabolism in both skeletal muscle and adipose tissue [Lowell, 1999; Tong et al., 2000; Chawla et al., 2001; Chawla et al., 2001; Rosen et al., 2002]. Furthermore, an inverse relationship between the PPARG1 isoform expression in adipose tissue and body mass index (BMI) has been shown but not for the PPARG2 isoform [Sewter et al., 2002].
Herein, we describe a 9-year-old Caucasian male with obesity and learning/behavioral problems presenting for genetic services to rule out Prader-Willi syndrome. DNA testing for PWS and fragile X syndrome was normal. However, chromosome analysis showed a rare observation of a chromosome 3p25.3p26.2 duplication which was confirmed by comparative genomic hybridization (CGH) studies. Because of the clinical overlap with PWS in our subject, we examined the gene expression pattern of selected genes from the chromosome 3p25.3p26.2 region known to be involved with obesity and behavior as well as genes on 15q11-q13 which contribute to PWS. We compared gene expression patterns using quantitative RT-PCR of RNA isolated from actively growing lymphoblastoid cell lines derived from our chromosome 3p duplication subject and similarly aged subjects (four nonobese males, four obese males and four PWS males (two with 15q11-q13 deletions and two with maternal disomy 15).
SUBJECTS and METHODS
Subjects
All subjects involved agreed to participate and signed an informed consent document approved by the local institutional review board.
Chromosome 3p duplication subject
Our patient was born at 42 weeks gestation by spontaneous vaginal delivery, weighing 3.52 kg (50th centile) and was 45.7 cm long (3rd centile). There was no exposure to drugs, alcohol, tobacco, medications or other substances during the pregnancy. The family history was noncontributory (i.e., no history of obesity, mental retardation, behavioral problems or miscarriages). Developmentally, he sat at 4 months, crawled at 6 months, walked and had his first words at about 12 months. He had myringotomy tubes placed at 3 years. Fragile X DNA testing and Prader-Willi syndrome methylation analysis were normal. Routine chromosome studies revealed an apparent duplication of chromosome 3p25.3p26.2. His hemogram, glucose and electrolytes were normal as well as thyroid function tests.
At 9 years of age he presented to the genetics clinic with obesity and a mild pervasive developmental disorder with anxiety and learning impairment. His body mass index (BMI) was 30.5 (+5 sd). His height was 133.8 cm (50th centile), weight was 53.7 kg (+5 sd) and head circumference was 52.4 cm (50th centile). His blood pressure was 128/72 and pulse was 105. He had a relatively small penis and a poorly rugated scrotum with descended prepubertal testicles (each 1 cm in length). He had tapering digits with normal sized hands and feet with a total hand length of 14.4 cm (25th centile) and middle finger length of 6.1 cm (25th centile). He had a round appearing face with full cheeks, an ear length of 6.2 cm (50th centile) and inner and outer canthal distances at the 50th centile (Figure 1). His dentition was normal without sticky saliva. His eye and ear exams were normal, as well as a normal oropharynx. A chest examination revealed normal auscultation without murmur. He had central obesity with normal muscle tone, strength and reflexes. There were no hernias, organomegaly or abdominal tenderness. There were no tremors or abnormal movements. He was alert, verbal and active during the examination. He swims one to two hours per day and had no history of food foraging. He attends the third grade which places him one year behind his peer group. He receives occupational, speech and behavioral therapy and is in a 90% inclusion group with special attention for reading and math. The onset of obesity occurred rapidly at 4 years of age when he gained 5 kg in 6 weeks. He gained additional weight despite dietary restriction by history of 1500 kcal per day.
Figure 1.

Frontal and facial views of the 9-year-old male with a duplication of chromosome 3p25.3p26.2.
Comparison subjects
RNA from lymphoblastoid cells derived from four nonobese males (average BMI = 21) ranging in age from 8 years to 20 years and four obese males (average BMI = 32) with normal chromosome and fragile X studies and normal methylation testing ranging in age from 5 to 18 years were used for comparison with our 3p duplication subject. In addition, RNA from four PWS males (average BMI = 27), two with 15q11-q13 deletions and two with maternal disomy, with an age range of 8 to 17 years, were also used for comparison. Methylation testing, chromosome studies and microsatellite analysis in the PWS males were obtained on DNA from peripheral blood samples and were consistent with the diagnosis. None of the comparison males had a history of diabetes.
METHODS
Metaphase cells were characterized by fluorescence in situ hybridization (FISH). FISH was performed with a whole chromosome 3 paint probe (WCP3; Cytocell, Cambridge, UK) to identify the origin of the additional chromatin on the abnormal chromosome 3. FISH was also performed with a p-arm subtelomeric sequence (D3S4459; Vysis, Downers Grove, IL) to determine the distal extent of the abnormality. FISH was performed according to the recommendations of the manufacturer. Comparative genomic hybridization (CGH) was performed commercially in duplicate by Spectral Genomics (Houston, TX) using genomic DNA isolated from blood from our subject with the chromosome 3p duplication and compared to a chromosomally normal male.
Quantitative RT-PCR was performed on five genes from the 3p25.3p26.2 region (GHRL, OXTR, SLC6A1, SLC6A11 and PPARG) using a QuantiTect SYBR Green one step RT-PCR kit (Qiagen, Valencia, CA) according to the manufacturer's directions. We used the primers specific to the two recognized isoforms (PPARG1 and PPARG2) as described by Sewter et al. [2002]. In addition, we amplified total PPARG using primers from the 3′ end of the message. Primers were chosen with the aid of MacVector sequence analysis software (Accelrys, San Diego, CA) as done previously [Talebizadeh et al., 2005]. Total RNA was isolated from cell lines using Trizol reagent (Invitrogen, Inc. Carlsbad, CA) and quantified by spectroscopy. An equal quantity of total RNA (500 ng) from each subject, together with primers specific to the gene being quantified were added to a reaction mix containing all components necessary for reverse transcription and PCR. The reaction was carried out in an ABI 7000 system (Applied Biosystems, Foster City, CA) beginning with a 30 minute step at 50 °C to allow for reverse transcription, followed by 15 minutes at 95 °C. The PCR followed for 45 cycles during which the intensity of the SYBR Green fluorescence was measured at the extension step of each PCR cycle. The point at which the intensity level crossed the PCR cycle threshold (CT, defined as the narrowest point between individual reactions in the logarithmic phase of the reaction) was used to compare individual reactions. At least 5 replicates were performed on each sample for each gene. A dissociation curve was generated for all reactions and reactions were run on agarose gels to verify the presence of a single band. Quantitative RT-PCR was also done using primers specific to GAPD, a control gene, on all RNA samples. All 12 samples were normalized individually to GAPD expression by dividing the mean GAPD gene expression (CT) value from each subject (4 nonobese, 4 obese and 4 PWS) to the mean GAPD gene expression (CT) value of the 3p duplication subject to produce a correction value. Each mean CT value for the other genes was divided by the correction value to produce the normalized value. The normalized CT values were averaged to produce the mean CT value for each gene in the Table. A t-test was performed to determine statistically significant differences in gene expression (mean CT values).
Table I.
Age, BMI and GHRL, PPARG, PPARG1, PPARG2, OXTR, SLC6A1, and SLC6A11 normalized gene expression (CT) values and gene expression fold change for our 3p duplication male and comparison males grouped according to subject category.
| Group | N | Age (yr) Mean (Range) |
BMI Mean (Range) |
GHRL Mean (CT) (Range) Fold change |
PPARG Mean (CT) (Range) Fold change |
PPARG1 Mean (CT) (Range) Fold change |
PPARG2 Mean (CT) (Range) Fold change |
OXTRA Mean (CT) Fold change |
SLC6A1A Mean (CT) Fold change |
SLC6A11A Mean (CT) Fold change |
|---|---|---|---|---|---|---|---|---|---|---|
| 3p dup | 1 | 9 | 31 | 23.2 | 20.8 | 23.3 | 24.8 | 18.7 | 21.6 | 20.5 |
| Nonobese | 4 | 14 (8-20) |
21 (16-24) |
24.4 (23.6-25.3) −2.3 |
24.4 (23.2-24.9) −12.1 |
26.6 (25.8-27.8) −9.9 |
30.7 (28.3-34.4) −60 |
NP | NP | NP |
| Obese | 4 | 12 (5-18) |
32 (20-44) |
24.9 (24.6-25.9) −3.3 |
25.6 (23.7-27.3) −27.9 |
30.2* (28.5-32.4) −119 |
33.9* (32.2-35.5) −549 |
19.4 −1.6 |
22.5 −1.9 |
24.5 −16 |
| PWS | 4 | 11 (8-17) |
27 (22-36) |
23.7 (23.1-25.1) −1.4 |
25.4 (22.4-27.9) −24.3 |
29.6* (25.6-32.3) −79 |
33.8* (32.3-35.7) −512 |
20.4 −3.3 |
23.3 −3.3 |
24.6 −17.2 |
The PWS and obese groups have significantly lower expression than the nonobese group (t-test, p < 0.05) consistent with higher PPARG isoform expression and lower BMIs reported in the literature [Sewter et al., 2002].
The CT was set at the narrowest portion of the logarithmic phase of amplification in the quantitative RT-PCR reaction.
GHRL fold change = 2 |3p dup CT – comparison CT| (e.g., 2|23.2 – 24.4| = 21.2 = −2.3 fold change)
Our 3p duplication subject showed higher expression of GHRL and PPARG isoforms compared with nonobese, obese and PWS subjects.
These comparisons are based on one obese and two PWS subjects and were not performed (NP) on nonobese comparison subjects.
Copy number of the PPARG gene was determined by quantitative PCR with primers specific to the first intron of PPARG. Equal quantities of genomic DNA from the 3p duplication male and a chromosomally normal male were added to a hot-start QRT-PCR mix including SYBR green (Invitrogen, Inc. Carlsbad, CA) and PCR performed in an ABI 7000 thermocycler according to the manufacturer's instructions. Five replicates of each sample were run.
Peripheral blood was collected (4 to 6 hours after eating) in a refrigerated vacutainer tube containing aprotinin, a specific preservative for gastrointestinal proteins, and plasma separated. Ghrelin and peptide YY (PYY) levels were obtained commercially (InterScience Institute, Englewood, CA) as previously reported [Butler et al., 2004]. Ghrelin is a neuropeptide produced by the stomach which stimulates eating and PYY produced by the intestine inhibits eating [Druce and Bloom, 2003; Small and Bloom, 2004].
RESULTS
We describe a 9-year-old male referred for genetic evaluation for obesity and PWS. Genetic analysis showed normal methylation of the PWS imprinting center and a normal chromosome 15 analyzed by FISH using the SNRPN probe and normal GTG banding of chromosome 15. However, GTG-banding revealed a rearrangement at the distal end of chromosome 3p (Figure 2a). The rearrangement appeared to be a duplication. FISH with whole chromosome paint probes (Figure 2b) confirmed that the additional chromatin was derived from chromosome 3 and a normal hybridization pattern with a subtelomeric probe for chromosome 3p (D3S4459) revealed that the duplication did not extend in this region.
Figure 2.
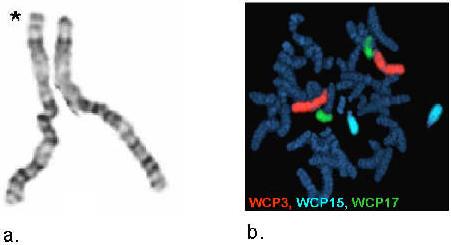
Figure 2a. GTG-banded chromosome 3s (* designates chromosome with 3p duplication).
Figure 2b. Whole chromosome painting for chromosomes 3, 15 and 17.
A duplication of distal chromosome 3p was supported by comparative genomic hybridization (Figure 3). The probes identified as duplicated were RP11-91K16, RP11-33E18, RP11-21J23, RP11-91K4, RP11-115G3, and RP11-105H19 which extends from nucleotide number 4.4Mb to 11.3Mb. The proximal breakpoint occurred between RP11-105H19 and RP11-57D6, which may extend the duplicated region to 13.2Mb including PPARG (NT position 12.30Mb to 12.45Mb). However, the precise location of the breakpoint was unknown; therefore, we performed quantitative RT-PCR using genomic DNA from our 3p duplication subject to determine if PPARG was duplicated. The mean CT (5 replicates) for our 3p subject using primers from within the first intron of PPARG was 0.7 cycles less than the mean CT for a chromosomally normal comparison male. By comparison, the mean CT for genomic primers within the GHRL gene was 0.6 cycles less than the comparison subject. These data support a total of three copies for each gene.
Figure 3.

Comparative genomic hybridization DNA microarray results of chromosome 3 from our 3p duplication subject. Arrow indicates region of duplication.
Quantitative RT-PCR showed an approximate 2 fold increase in GHRL gene expression in our 3p duplication subject relative to the mean values of our nonobese and obese comparison males (Table). Interestingly, GHRL expression in our 3p duplication subject was similar to that of our four PWS males and significantly higher than in our obese and nonobese comparison males (Table). Plasma ghrelin levels are known to be higher in PWS individuals than in unaffected subjects [Cummings et al., 2002; Haqq et al., 2003; Butler et al., 2004; Goldstone et al., 2004]. However, the plasma ghrelin and peptide YY levels in our 3p duplication subject obtained commercially were 250 pg/ml and 104 pg/ml, respectively, which are in the normal range for obese children (Haqq et al., 2003).
We also compared the expression of the OXTR gene in repeated measures using quantitative RT-PCR in our 3p duplication subject relative to an obese male and two of our PWS males. There was a 2 to 3 fold increase in OXTR expression detectable in our 3p duplication male relative to three other comparison subjects commensurate with a duplication of this gene. OXTR expression was not significantly different when compared with two PWS males and an obese male. Likewise, the expression of SLC6A1 and SLC6A11 genes was increased (2 fold and 16 fold, respectively) in our 3p duplication male relative to an obese male (Table).
PPARG is a transcription factor involved in multiple metabolic processes and expressed in a wide variety of tissues (see the GeneCards website for summary: http://bioinfo1.weizmann.ac.il/genecards/index.shtml ). We examined PPARG expression in available lymphoblastoid cells which may be subject to regulatory mechanisms distinct from other tissues (e.g., adipose) more appropriate for study but unavailable in our subjects. Total PPARG expression was found to be greater in lymphoblastoid cells from our 3p duplication subject than in any of the other males examined which probably reflects the gene duplication status (see Table). The level of gene expression in our 3p duplication subject was 12 fold greater than the mean of four nonobese males examined, 28 fold greater than the mean of the four obese males and 24 fold greater than the mean of the four PWS males.
DISCUSSION
Reports describing the clinical presentation of individuals with chromosome 3p trisomy reflect a range of characteristics often compounded by translocations involving other chromosomes [Charrow et al., 1981; van Essen et al., 1991; Conte et al., 1995]. Reports of individuals with duplications restricted to only chromosome 3p are much more rare [Gillerot et al., 1987; Kurtzman et al., 1987]. The common malformations seen in partial trisomy 3p include psychomotor and mental retardation, a short neck, hypertelorism and/or telecanthus, cleft lip/palate, microcephaly, short stature, a characteristic face with full cheeks, gastrointestinal malformations and congenital heart defects [Conte et al., 1995]. Nearly half of the reported cases died before 6 months of age. All reports of affected children surviving beyond one year of age had developmental delay and mental retardation [Charrow et al., 1981]. Our chromosome 3p duplication subject shares the behavioral problems and reduced cognitive ability similar to other reported cases of partial trisomy 3p; however, central obesity is not commonly reported. In addition, our 3p duplication subject had no heart defects and gene(s) involved in heart development may be unaffected by the 3p25.3p26.2 duplication. Thus, our subject with a rare interstitial 3p duplication had a milder phenotype than is commonly reported for others with partial trisomy 3p which may reflect the small size of the duplication or lack of involvement of other chromosomes.
Interestingly, there are several genes within the chromosome 3p25.3p26.2 region which may contribute to the clinical findings seen in our patient and similar to PWS. For example, PPARG and GHRL are known to be associated with obesity and the oxytocin receptor gene, OXTR, has been associated with autism [Muhle et al., 2004]. In addition, the GABA transporters, SLC6A1 and SLC6A11 are located in the duplicated region and are involved in central nervous system function.
The most obvious similarity of gene expression between our PWS subjects and our 3p duplication subject was an increase in GHRL relative to the control subjects. Although misregulation of GHRL results from different mechanisms in our PWS individuals and our 3p subject, it represents an interesting parallel between the gene expression data and phenotypic similarities. Our 3p duplication subject did not have an increase in plasma ghrelin level but further investigations are needed to assess the relationship (if any) between the increased GHRL mRNA in lymphoblastoid cells and plasma ghrelin concentration.
An inverse relationship between PPARG1 gene expression has been observed in adipose tissue and BMI [Sewter et al., 2002]. Although we saw a trend toward an inverse relationship between PPARG1 expression and BMI, it was not significant and may indicate a small sample size. However, the PPARG1 expression level in lymphoblastoid cells in our nonobese group was significantly greater than found in our obese group as similarly seen in reported studies on adipocytes (Sewter et al., 2002) suggesting a similar pattern of expression. Furthermore, we detected higher levels of PPARG1 compared to PPARG2 (Table) in our lymphoblastoid cells suggesting that total PPARG expression was primarily due to PPARG1.
We know that gene expression in relevant tissues (brain, adipose) in our subject is not perfectly represented by lymphoblastoid cells but the DNA copy number will be the same in all tissues. Regardless of the relationships between our comparison groups, it is clear that lymphoblastoid cells from our 3p duplication subject expressed more PPARG than any of the comparison males which may be a direct result of the chromosome duplication. Thus, several of the misregulated genes we examined are of interest because of their potential contribution to obesity and behavior which presents an opportunity to expand the number of genes examined through genome wide microarray expression to search for gene network interactions.
Figure 4.


Representative quantitative RT-PCR using primers specific for a. GHRL and b. PPARG. Total RNA was extracted from actively growing lymphoblast cells and equal quantities were used in a QuantiTect all-in-one RT-PCR using SYBR green fluorescence to quantify the amplicon. The CT was set at the narrowest portion of the logarithmic phase of PCR cycle amplification at which the signal intensity exceeds the detection threshold. Fold change is calculated as 2|3p – Comp|, (3p = CT of the 3p duplication subject and Comp = CT of the comparison subject). a. Representative quantitative RT-PCR for the GHRL gene. The CTs were 23.2, 23.7, 24.4 and 24.9 for the 3p duplication, PWS, nonobese and obese subjects, respectively. The difference in CT value used to determine gene fold expression change between the 3p duplication subject and the PWS, nonobese and obese subjects represent 1.4, 2.3 and 3.3 fold less expression respectively relative to the 3p duplication subject. b. Representative quantitative RT-PCR for the PPARG gene. The CTs were 20.8, 25.4, 24.4 and 25.6 for the 3p duplication, PWS, nonobese and obese subjects, respectively. The difference in CT value used to determine gene fold expression change between the 3p duplication subject and the PWS, nonobese and obese subjects represent a 24.3, 12.1 and 27.9 fold less gene expression respectively relative to the 3p duplication subject.
ACKNOWLEDGMENTS
Support was provided by grant RO1HD41672 from the National Institutes of Health; Children's Mercy Hospitals Physician Scientist Award (01.4871); and the Hall Family Foundation (01.3905) to M.G.B.
REFERENCES
- Bittel DC, Kibiryeva N, Talebizadeh Z, Butler MG. Microarray analysis of gene/transcript expression in Prader-Willi syndrome: deletion versus UPD. J Med Genet. 2003;40:568–574. doi: 10.1136/jmg.40.8.568. [DOI] [PMC free article] [PubMed] [Google Scholar]
- Brannan CI, Bartolomei MS. Mechanisms of genomic imprinting. Curr Opin Genet Dev. 1999;9:164–170. doi: 10.1016/S0959-437X(99)80025-2. [DOI] [PubMed] [Google Scholar]
- Butler MG, Bittel DC, Talebizadeh Z. Plasma peptide YY and ghrelin levels in infants and children with Prader-Willi syndrome. J Pediatr Endocrinol Metab. 2004;17:1177–1184. doi: 10.1515/jpem.2004.17.9.1177. [DOI] [PMC free article] [PubMed] [Google Scholar]
- Butler MG, Thompson T. Prader-Willi syndrome: Clinical and genetic findings. The Endocrinol. 2000;10:35–165. doi: 10.1097/00019616-200010041-00002. [DOI] [PMC free article] [PubMed] [Google Scholar]
- Cassidy SB. Prader-Willi syndrome. J Med Genet. 1997;34(11):917–923. doi: 10.1136/jmg.34.11.917. [DOI] [PMC free article] [PubMed] [Google Scholar]
- Chai JH, Locke DP, Greally JM, Knoll JH, Ohta T, Dunai J, Yavor A, Eichler EE, Nicholls RD. Identification of four highly conserved genes between breakpoint hotspots BP1 and BP2 of the Prader-Willi/Angelman syndromes deletion region that have undergone evolutionary transposition mediated by flanking duplicons. Am J Hum Genet. 2003;73:898–925. doi: 10.1086/378816. [DOI] [PMC free article] [PubMed] [Google Scholar]
- Charrow J, Cohen MM, Meeker D. Duplication 3p syndrome: report of a new case and review of the literature. Am J Med Genet. 1981;8:431–436. doi: 10.1002/ajmg.1320080408. [DOI] [PubMed] [Google Scholar]
- Chawla A, Barak Y, Nagy L, Liao D, Tontonoz P, Evans RM. PPAR-gamma dependent and independent effects on macrophage-gene expression in lipid metabolism and inflammation. Nat Med. 2001;7:48–52. doi: 10.1038/83336. [DOI] [PubMed] [Google Scholar]
- Chawla A, Boisvert WA, Lee CH, Laffitte BA, Barak Y, Joseph SB, Liao D, Nagy L, Edwards PA, Curtiss LK, Evans RM, Tontonoz P. A PPAR gamma-LXR-ABCA1 pathway in macrophages is involved in cholesterol efflux and atherogenesis. Mol Cell. 2001;7:161–171. doi: 10.1016/s1097-2765(01)00164-2. [DOI] [PubMed] [Google Scholar]
- Cock TA, Houten SM, Auwerx J. Peroxisome proliferator-activated receptor-gamma: too much of a good thing causes harm. EMBO Rep. 2004;5:142–147. doi: 10.1038/sj.embor.7400082. [DOI] [PMC free article] [PubMed] [Google Scholar]
- Conte RA, Pitter JH, Verma RS. Molecular characterization of trisomic segment 3p24.1-->3pter: a case with review of the literature. Clin Genet. 1995;48:49–53. doi: 10.1111/j.1399-0004.1995.tb04054.x. [DOI] [PubMed] [Google Scholar]
- Cummings DE, Clement K, Purnell JQ, Vaisse C, Foster KE, Frayo RS, Schwartz MW, Basdevant A, Weigle DS. Elevated plasma ghrelin levels in Prader Willi syndrome. Nat Med. 2002;8:643–644. doi: 10.1038/nm0702-643. [DOI] [PubMed] [Google Scholar]
- Doney A, Fischer B, Frew D, Cumming A, Flavell DM, World M, Montgomery HE, Boyle D, Morris A, Palmer CN. Haplotype analysis of the PPARgamma Pro12Ala and C1431T variants reveals opposing associations with body weight. BMC Genet. 2002;3:21. doi: 10.1186/1471-2156-3-21. [DOI] [PMC free article] [PubMed] [Google Scholar]
- Druce M, Bloom SR. Central regulators of food intake. Curr Opin Clin Nutr Metab Care. 2003;6:361–367. doi: 10.1097/01.mco.0000078996.96795.4a. [DOI] [PubMed] [Google Scholar]
- Gillerot Y, Hustin J, Koulischer L, Viteux V. Prenatal diagnosis of a dup(3p) with holoprosencephaly. Am J Med Genet. 1987;26:225–227. doi: 10.1002/ajmg.1320260134. [DOI] [PubMed] [Google Scholar]
- Goldstone AP, Thomas EL, Brynes AE, Castroman G, Edwards R, Ghatei MA, Frost G, Holland AJ, Grossman AB, Korbonits M, Bloom SR, Bell JD. Elevated fasting plasma ghrelin in prader-willi syndrome adults is not solely explained by their reduced visceral adiposity and insulin resistance. J Clin Endocrinol Metab. 2004;89:1718–1726. doi: 10.1210/jc.2003-031118. [DOI] [PubMed] [Google Scholar]
- Haqq AM, Farooqi IS, O'Rahilly S, Stadler DD, Rosenfeld RG, Pratt KL, LaFranchi SH, Purnell JQ. Serum ghrelin levels are inversely correlated with body mass index, age, and insulin concentrations in normal children and are markedly increased in Prader-Willi syndrome. J Clin Endocrinol Metab. 2003;88:174–178. doi: 10.1210/jc.2002-021052. [DOI] [PubMed] [Google Scholar]
- Hegele RA. Phenomics, lipodystrophy, and the metabolic syndrome. Trends Cardiovasc Med. 2004;14:133–137. doi: 10.1016/j.tcm.2004.02.001. [DOI] [PubMed] [Google Scholar]
- Kintscher U, Law RE. PPAR{gamma}-mediated insulin sensitization: the importance of fat versus muscle. Am J Physiol Endocrinol Metab. 2005;288:E287–91. doi: 10.1152/ajpendo.00440.2004. [DOI] [PubMed] [Google Scholar]
- Kota BP, Huang TH, Roufogalis BD. An overview on biological mechanisms of PPARs. Pharmacol Res. 2005;51:85–94. doi: 10.1016/j.phrs.2004.07.012. [DOI] [PubMed] [Google Scholar]
- Kubota N, Terauchi Y, Miki H, Tamemoto H, Yamauchi T, Komeda K, Satoh S, Nakano R, Ishii C, Sugiyama T, Eto K, Tsubamoto Y, Okuno A, Murakami K, Sekihara H, Hasegawa G, Naito M, Toyoshima Y, Tanaka S, Shiota K, Kitamura T, Fujita T, Ezaki O, Aizawa S, Kadowaki T, et al. PPAR gamma mediates high-fat diet-induced adipocyte hypertrophy and insulin resistance. Mol Cell. 1999;4:597–609. doi: 10.1016/s1097-2765(00)80210-5. [DOI] [PubMed] [Google Scholar]
- Kurtzman DN, Van Dyke DL, Rich CA, Weiss L. Duplication 3p21----3pter and cyclopia. Am J Med Genet. 1987;27:33–37. doi: 10.1002/ajmg.1320270105. [DOI] [PubMed] [Google Scholar]
- Lowell BB. PPARgamma: an essential regulator of adipogenesis and modulator of fat cell function. Cell. 1999;99:239–242. doi: 10.1016/s0092-8674(00)81654-2. [DOI] [PubMed] [Google Scholar]
- Muhle R, Trentacoste SV, Rapin I. The genetics of autism. Pediatrics. 2004;113(5):e472–486. doi: 10.1542/peds.113.5.e472. [DOI] [PubMed] [Google Scholar]
- Nicholls RD, Knepper JL. Genome organization, function, and imprinting in Prader-Willi and Angelman syndromes. Annu Rev Genomics Hum Genet. 2001;2:153–175. doi: 10.1146/annurev.genom.2.1.153. [DOI] [PubMed] [Google Scholar]
- Rosen ED, Hsu CH, Wang X, Sakai S, Freeman MW, Gonzalez FJ, Spiegelman BM. C/EBPalpha induces adipogenesis through PPARgamma: a unified pathway. Genes Dev. 2002;16:22–26. doi: 10.1101/gad.948702. [DOI] [PMC free article] [PubMed] [Google Scholar]
- Sewter C, Blows F, Considine R, Vidal-Puig A, O'Rahilly S. Differential effects of adiposity on peroxisomal proliferator-activated receptor gamma1 and gamma2 messenger ribonucleic acid expression in human adipocytes. J Clin Endocrinol Metab. 2002;87:4203–4207. doi: 10.1210/jc.2002-011511. [DOI] [PubMed] [Google Scholar]
- Small CJ, Bloom SR. Gut hormones and the control of appetite. Trends Endocrinol Metab. 2004;15:259–263. doi: 10.1016/j.tem.2004.06.002. [DOI] [PubMed] [Google Scholar]
- Talebizadeh Z, Kibiryeva N, Bittel DC, Butler MG. Ghrelin, peptide YY and their receptors: Gene expression in brain from subjects with and without Prader-Willi syndrome. Int J Mol Med. 2005 In press. [PMC free article] [PubMed] [Google Scholar]
- Tong Q, Dalgin G, Xu H, Ting CN, Leiden JM, Hotamisligil GS. Function of GATA transcription factors in preadipocyte-adipocyte transition. Science. 2000;290(5489):134–138. doi: 10.1126/science.290.5489.134. [DOI] [PubMed] [Google Scholar]
- van Essen AJ, Kok K, van den Berg A, de Jong B, Stellink F, Bos AF, Scheffer H, Buys CH. Partial 3q duplication syndrome and assignment of D3S5 to 3q25-3q28. Hum Genet. 1991;87(2):151–154. doi: 10.1007/BF00204171. [DOI] [PubMed] [Google Scholar]