Abstract
Relatively little is known regarding the role of mitochondrial metabolism in stem cell biology. Here we demonstrate that mouse embryonic stem cells sorted for low and high resting mitochondrial membrane potential (ΔΨmL and ΔΨmH) are indistinguishable morphologically and by the expression of pluripotency markers, whereas markedly differing in metabolic rates. Interestingly, ΔΨmL cells are highly efficient at in vitro mesodermal differentiation yet fail to efficiently form teratomas in vivo, whereas ΔΨmH cells behave in the opposite fashion. We further demonstrate that ΔΨm reflects the degree of overall mammalian target of rapamycin (mTOR) activation and that the mTOR inhibitor rapamycin reduces metabolic rate, augments differentiation, and inhibits tumor formation of the mouse embryonic stem cells with a high metabolic rate. Taken together, our results suggest a coupling between intrinsic metabolic parameters and stem cell fate that might form a basis for novel enrichment strategies and therapeutic options.
Stem cells persist throughout the entire life span of the organism, suggesting that these cells may possess unique abilities to deal with issues such as oxidative stress and DNA damage. Such supposition is supported by experimental evidence that murine embryonic stem cells (mES)4 cells appear resistant to exogenous oxidative stress (1). This resistance has been attributed to increased antioxidant protein defenses in mES cells when compared with more differentiated mouse cells (1). There is also evidence that stem cells may preferentially reside in low oxygen niches (2). The best studied example appears to be for hematopoietic stem cells where both theoretical and direct experimental evidence suggests that hematopoietic stem cells preferentially reside within the most hypoxic regions of the bone marrow (3, 4). It has long been known that lowering ambient oxygen concentrations can regulate mitochondrial metabolism and hence alter intracellular reactive oxygen species generation (5). In this context, it is believed that residing within low oxygen environments may help reduce the long term exposure of the stem cell to oxidative damage.
Consistent with a role for ambient oxygen in determining stem cell fate, a number of reports have previously demonstrated that low levels of oxygen might promote hematopoietic stem cell function (6–8). Similarly, it has been demonstrated that the differentiation of mES cells into hematopoietic progenitors was augmented under hypoxic conditions (9). Such observations are not, however, limited to hematopoietic differentiation as oxygen concentration appears to also affect the differentiation of neural stem cells (10, 11), as well as placental cytotrophoblast cells (12).
The precise molecular bases for these effects are unclear. Several studies have implicated that activation of hypoxia-inducible factor 1α (HIF-1α) or HIF-2α may play a significant role in the observed enhanced differentiation of stem cells under low oxygen conditions (2). Such observations are supported by studies demonstrating that mouse ES cells lacking aryl hydrocarbon receptor nuclear translocator (ARNT), the requisite cofactor for HIF, are impaired in their ability to differentiate along the hemangioblast and early mesoderm lineages (9). In addition, the HIF family of transcriptional activators appears to regulate a number of genes involved in stem cell function and self-renewal (2, 13–15).
Although HIF-dependent mechanisms are undoubtedly quite important, we thought it possible that lowering oxygen concentrations may indirectly or directly affect stem cell differentiation through alterations in mitochondrial metabolism. From our assessment of the literature, we found surprisingly little information regarding the role of mitochondrial metabolism in stem cell biology. In this study, we demonstrate that a significant relationship exists between mitochondrial activity and underlying stem cell function.
EXPERIMENTAL PROCEDURES
Cell Culture—Murine ROSA26 ES cells (mES cells) were generously provided by Dr. Philippe Soriano (Fred Hutchinson Cancer Research Center). In most experiments, we employed mES cells that were maintained in a feeder-free, serum-free culture environment as described previously (16). Subsequent experiments were performed using mES cells plated onto 1% gelatin-coated plates in N2B27 medium supplemented with 10 ng/ml leukemia inhibitory factor (LIF) (Sigma-Aldrich) and 10 ng/ml BMP-4 (R&D Systems). Cells were grown to a density of 25,000 cells/cm2 and passaged every 2 days. To induce differentiation, sorted or unsorted mES cells were plated onto 1% gelatin-coated plates at an initial density of 2,000 cells/cm2. After removal of the normal LIF-containing medium, the cells were differentiated in N2B27 medium containing 5 ng/ml BMP-4 and cultured at 37 °C in 5% CO2 and 5 or 20% O2. Where indicated, rapamycin (Sigma) was added at a final concentration of 20 nm coincident with the withdrawal of LIF and continued until Flk-1 assessment on day 4.
Immunoblotting and Isolation of Nuclear Fractions—Antibodies for immunoblotting were as follows: mTOR, raptor, phospho-p70 S6K1 (Thr-421/Ser-424), p70 S6K1, phospho-S6 (Ser-235/236), S6 (all from Cell Signaling Technology), rictor (Bethyl Laboratories), HIF-1α (Novus Biologicals), and SIRT1 (Upstate Biotechnology). Western blot analysis was performed by standard methods using enhanced chemiluminescence. Nuclear extracts were isolated with the NE-PER nuclear and cytoplasmic extraction kit (Pierce Biotechnology).
Mitochondrial Membrane Potential and Sorting—Membrane potential was assessed using the potentiometric dye tetramethyl rhodamine methyl ester (TMRM; Invitrogen) at a final concentration of 25 nm for 15 min. For sorting of cells with different mitochondrial membrane potential, mES cells were sorted into two pools corresponding to the cells with the lowest (5%) and highest (5%) TMRM fluorescence (17). Cell sorting was performed on a MoFlo flow cytometer (Dako-Cytomation).
Phenotypic Analysis of ES Cells—To compare stem cell morphology, differential interference contrast images were taken using a Zeiss-510 Confocal system (Carl Zeiss). For real-time PCR analysis of gene expression, RNA was isolated from cells exhibiting high or low mitochondrial membrane potential using the RNEasy kit (Qiagen). Gene expression was normalized to 18 S rRNA levels using the following set of primers: mOct4 F1, 5′-CCA ATC AGC TTG GGC TAG AG-3′; mOct4 R1, 5′-CCT GGG AAA GGT GTC CTG TA-3′; mNanog F1, 5′-CAC CCA CCC ATG CTA GTC TT-3′; MNanog R1, 5′-ACC CTC AAA CTC CTG GTC CT-3′; mBrachyury F1, 5′-TGT GGC TGC GCT TCA AGG AGC-3′; mBrachyury R1, 5′-GTA GAC GCA GCT GGG CGC CTG-3′;18SF1,5′-TTT CGG AAC TGA GGC CAT GA-3′; 18 S R1, 5′-GCA AAT GCT TTC GCT CTG GTC-3′.
Expression analysis of Flk-1 or SSEA-1 was performed using the FACSCanto cytometer (Becton Dickinson Immunocytometry Systems). Primary antibodies included mouse anti-SSEA-1 (Chemicon International) and rat anti-Flk-1 (eBioscience) and the corresponding isotype controls (eBioscience). The dilution of primary antibody was 1:100. Data for real-time-PCR expression level and Flk-1 differentiation represent the mean ± S.D. of three independent experiments each performed in triplicate.
Oxygen Consumption, Lactate, and ATP Measurements—Oxygen consumption was determined using the BD oxygen biosensor system (BD Biosciences) as described previously (17). Cells were resuspended in culture medium and subsequently transferred to a 96-well plate where equal numbers of cells (7 × 10⁵) were placed in each well. Levels of oxygen consumption were measured under baseline conditions and in the presence of FCCP (1 μm; Sigma-Aldrich) or oligomycin (0.2 μg/ml; Sigma-Aldrich). Fluorescence was recorded using a GENios multimode reader (Tecan) at 2-min intervals for 2 h at an excitation of 485 nm and emission of 630 nm. For semiquantitative data analysis, the maximum slope of fluorescence units/s was used and converted into arbitrary units. Lactate and ATP were measured using the lactate reagent (Trinity Biotech) and the ATP determination kit (Invitrogen), respectively, according to the manufacturer's recommendations.
Teratoma Assays and Blastocyst Injection—To assess tumorigenesis, 4-week-old male SCID-Beige mice were injected into the hind limb muscle with the indicated number of either sorted or unsorted ES cells. After 25 days, mice were sacrificed, and the teratomas were surgically removed and weighed. For injection of rapamycin (LC Laboratories), the drug was reconstituted in absolute ethanol at 10 mg/ml and diluted in 5% Tween 80 (Sigma) and 5% polyethylene glycol 400 (Hampton Research). Vehicle alone or rapamycin (4 mg/kg of body weight) was injected daily. The final volume of all intraperitoneal injections was 200 μl. For blastocyst injection experiments, 10–15 sorted mES cells were injected into 3.5-day-old mouse blastocysts. The ROSA26 mES cell line harbors the β-galactosidase reporter gene. Following harvesting of the embryos 7–10 days later, staining for β-galactosidase expression was performed by standard means.
RESULTS
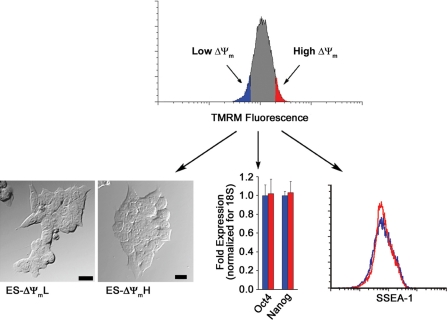
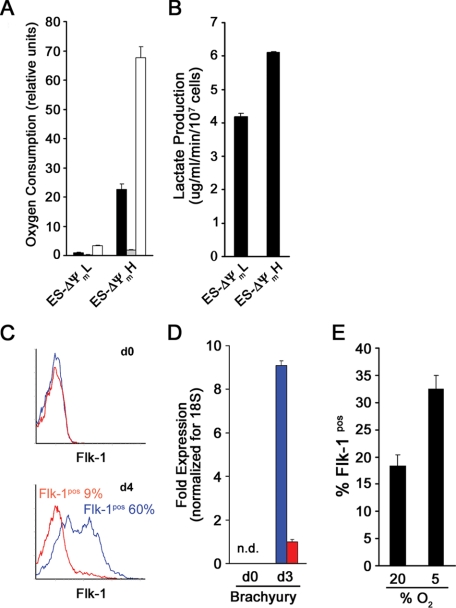
We have recently demonstrated that employing the mitochondrial membrane potential sensitive dye TMRM coupled with fluorescent activated cell sorting (FACS) allows for the purification within clonal cell lines of cell populations with intrinsically different levels of mitochondrial oxygen consumption (17). In an attempt to adopt this strategy to populations of stem cells, we loaded mES cells with TMRM and sorted cells for either high or low fluorescence (bottom and top 5%). As seen in Fig. 1, immediately after sorting, these two different ΔΨm populations were phenotypically indistinguishable. Real-time PCR analysis revealed that both populations expressed the ES cell markers Oct4 and Nanog to a similar degree. In addition, FACS analysis revealed that the mES cell surface marker SSEA-1 was identically expressed in these two cell populations. As would be expected based on resting membrane potential, levels of endogenous mitochondrial NADH differed between the two different ΔΨm populations. The latter results suggest that differences in TMRM fluorescence represent intrinsic differences in mitochondrial properties and are not merely a reflection of differences in the uptake or extrusion of the fluorophore. To more formally test this notion, we directly measured the metabolic parameters of ΔΨmL versus ΔΨmH cells. As seen in Fig. 2A, there was an approximate 20-fold difference in resting oxygen consumption between these two populations of cells. Measured oxygen consumption in both populations was essentially eliminated in the presence of oligomycin, demonstrating that the vast majority of oxygen consumption in both cell types derived from mitochondrial metabolism (Fig. 2A). Similar to resting oxygen consumption, maximal oxidative capacity (FCCP-induced maximal respiration) was also markedly different in the two cell populations. Although these initial 20-fold or greater metabolic differences were striking, with time in culture, these differences were reduced. Twenty-four hours after sorting, there was an approximate 3-fold difference in metabolism, whereas by 48 h, both membrane potential and oxygen consumption were similar between the two sorted populations (data not shown). Next we sought to characterize the glycolytic rate in the two stem cell populations. As seen in Fig. 2B, the ΔΨmH cells showed an ∼1.5-fold higher level of lactate production, indicating a higher glycolytic flux.
FIGURE 1.
Sorting of mES cells with low and high mitochondrial membrane potential. Mouse ES cells were loaded with the mitochondrial membrane potentiometric dye TMRM, and cells were subsequently sorted into populations with lowest 5% (ES-ΔΨmL; blue) or highest 5% (ES-ΔΨmH; red) mitochondrial membrane potential. After sorting, ES cells were analyzed morphologically (bar = 20 μm), as well as by the expression of characteristic stem cell markers such as Oct4 and Nanog (mean ± S.D.; n = 3) and the surface expression of SSEA-1. By these criteria, ΔΨmL and ΔΨmH cells appeared indistinguishable.
FIGURE 2.
Mitochondrial metabolism and mES cell mesodermal differentiation. A, oxygen consumption of ΔΨmL and ΔΨmH cells under resting conditions (black bar), in the presence of the mitochondrial inhibitor oligomycin (shaded bar), or in the presence of the mitochondrial uncoupler FCCP. The respiration rates shown are triplicate determinations (mean ± S.D.) of a single experiment and are representative of three similar experiments. B, lactate production as a marker of glycolytic rate of ΔΨmL and ΔΨmH cells determined after sorting (mean ± S.D.; n = 3). C, differentiation was induced by withdrawal of LIF. Flk-1 expression was assessed immediately after sorting (d0) and again on day 4 for either ΔΨmL (blue) or ΔΨmH (red) mES cells. D, real-time-PCR analysis for Brachyury expression on days 0 and 3 (mean ± S.D.; n = 3). E, unsorted cells were cultured under 20 or 5% oxygen conditions and induced to differentiate by LIF withdrawal. The percentage of cells expressing Flk-1 was assessed on day 4. Data are from a single experiment performed in triplicate and are representative of three similar experiments.
Interestingly, at all times, resting ATP levels per mg of protein were essentially indistinguishable (ATP: ΔΨmH/ΔΨmL = 1.02 ± 0.05; n = 3, p = not significant). Thus, like in most cells, energy production and consumption are presumably matched to maintain ATP levels within a relatively narrow range. Since the ΔΨmH cells have a considerably higher overall metabolic rate (e.g. both increased oxygen consumption and increased glycolytic rates), they undoubtedly exhibit a greater flux of ATP with both increased ATP generation as well as increased ATP consumption.
Previous studies have demonstrated that the withdrawal of LIF allows for BMP-4-induced differentiation of ES cells toward the mesodermal lineage (19). Such differentiation is usually assessed by the expression of markers such as Flk-1 and Brachyury (20, 21). To assess whether mitochondrial metabolism might correlate with differentiation potential, we cultured ΔΨmL and ΔΨmH cells in the presence of BMP-4 and the absence of LIF. Immediately after sorting, neither population expressed Flk-1, consistent with both populations being undifferentiated ES cells. Four days later, nearly 60% of ΔΨmL cells had differentiated, whereas this occurred in less then 10% of the ΔΨmH cells (Fig. 2C). In contrast, under these conditions, the level of differentiation in unsorted cells was usually between 20 and 30%. Similarly, by real-time PCR analysis, Brachyury expression was undetectable in both populations initially, but by day 3, we noted an approximate 10-fold difference between the ΔΨmL and ΔΨmH cells (Fig. 2D). Careful time course analysis revealed that the reduced differentiation observed in the ΔΨmH cells was not a result of altered timing as peak Flk-1 expression was observed on day 4 and the peak Brachyury expression was observed on day 3 in both populations.
To further confirm the relationship between mitochondrial metabolism and the potential for in vitro stem cell differentiation, we sought ways of experimentally manipulating cellular oxygen consumption. Unfortunately, little is known as to what sets resting mitochondrial membrane potential. Although we tried a number of mitochondrial pharmacological inhibitors, all produced significant energetic collapse followed by substantial loss in cell viability.5 In contrast, when we simply altered mitochondrial oxygen consumption by altering ambient oxygen concentration, we noted that mES cell differentiation was sensitive to these perturbations. As noted in Fig. 2E, mES cell differentiation along the mesodermal lineage was attenuated at 20% oxygen when compared with similar induction of differentiation at 5% oxygen concentrations. These results further underline the relationship found in our sorting experiments between mitochondrial metabolism and mesodermal differentiation of mES cells.
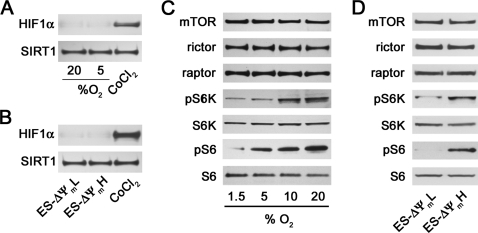
Although 5% ambient oxygen is lower than routine culture conditions, it is not generally believed to be sufficient to stimulate a hypoxic response. As expected, at this oxygen concentration, we saw little evidence for HIF-1α activation in our mES cells (Fig. 3A). Similarly, we saw no evidence of HIF-1α activation in our ΔΨmL sorted cells, suggesting that preferential activation of this pathway was unlikely playing a role in the high level of differentiation seen in this cell population (Fig. 3B). Recently, we and others have noted a connection between mTOR activity and mitochondrial metabolism (17, 22). We wondered whether the differences in differentiation potential seen between mES cells maintained at 20 or 5% oxygen or between ΔΨmL and ΔΨmH cells might reflect different levels of mTOR activity. As noted in Fig. 3C, whereas absolute levels of mTOR and its associated proteins rictor and raptor did not differ depending on oxygen concentration, mTOR activity as assessed by phospho-S6 kinase (Fig. 3C, pS6K) and phosphorylated ribosomal S6 (Fig. 3C, pS6) levels were increased as oxygen tension was increased from 1.5 to 20%. This is consistent with either an inhibition of mTOR activity at low oxygen concentrations or an increase in mTOR activity as oxygen concentrations rise. A similar difference in mTOR activity was seen in the two populations of cells sorted by mitochondrial membrane potential (Fig. 3D).
FIGURE 3.
Activity levels of mTOR correlate with mES cell metabolism and differentiation. A, expression of HIF-1α in nuclear extract of mES cells induced to differentiate at the indicated concentration of ambient oxygen. Cobalt chloride (CoCl2) was used as a positive activator of HIF-1α, and the nuclear protein Sirt1 was assessed as a control for protein loading. B, similar HIF-1α expression in mES cells sorted based on high or low mitochondrial membrane potential. C, analysis of the activity and absolute level of expression of mTOR and its associated proteins rictor and raptor in cells cultured under varying oxygen tensions. mTOR activity was assessed by analysis of the downstream target, phosphorylated S6 kinase (pS6K), and the phosphorylation target of S6 kinase (S6K), ribosomal S6 (S6). pS6, phosphorylated ribosomal S6. D, similar mTOR protein and activity analysis for mES cells sorted by mitochondrial membrane potential.
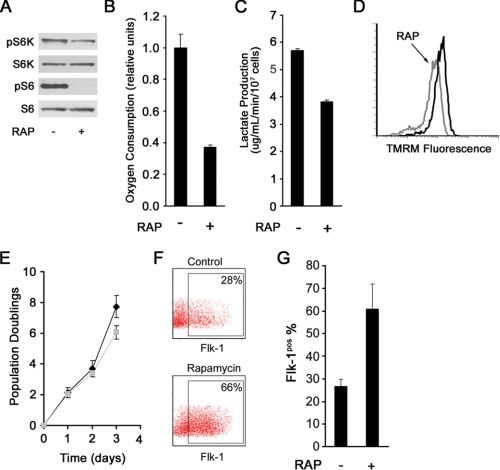
We next took advantage of the mTOR inhibitor rapamycin to ask whether we could manipulate mitochondrial function and correspondingly alter mES cell fate. As expected, treatment of mES cells with rapamycin inhibited mTOR activity (Fig. 4A). Moreover, rapamycin treatment resulted in a corresponding decrease in mitochondrial membrane potential (Fig. 4D), oxygen consumption (Fig. 4B), and lactate production (Fig. 4C), thus mimicking the metabolic phenotype of the ΔΨmL mES. Furthermore, rapamycin modestly decreased the proliferation rate in mES cells (Fig. 4E).
FIGURE 4.
Rapamycin (RAP) alters metabolism and stimulates mES cell differentiation. A, treatment with rapamycin inhibits mTOR activity. pS6K, phospho-S6 kinase; S6K, S6 kinase; pS6, phosphorylated ribosomal S6. B, rapamycin treatment reduces mES cell oxygen consumption (shown is one of two similar experiments performed in triplicate, mean ± S.D.). C, rapamycin exposure reduces lactate production (mean ± S.D.; n = 3). D, treatment with rapamycin reduces mitochondrial membrane potential. E, proliferation curves of mES cells in the presence (gray) and absence (black) of rapamycin. Shown are the results of one representative experiment performed in triplicate (mean ± S.D.). F, representative FACS histograms demonstrating marked augmentation of mesodermal differentiation as assessed by expression of Flk-1 on day 4 following LIF withdrawal in mES cells treated with rapamycin. G, quantification of three independent experiments demonstrating increased Flk-1 expression of rapamycin treated mES cells (mean ± S.D.; p < 0.01).
We next asked whether such treatment altered the capacity of mES cells to differentiate. As demonstrated in Fig. 4F, consistent with its effects on mitochondrial metabolism, treatment of mES cells with rapamycin augmented in vitro mesodermal differentiation. Under the conditions employed, rapamycin treatment boosted the percentage of ES cells exhibiting Flk-1 expression over 2-fold (Fig. 4G).
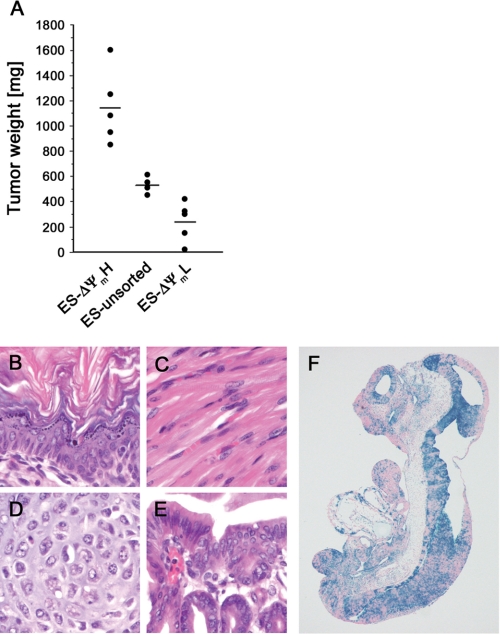
In the absence of differentiation, mES cells remain in a pluripotent state. Such cells when injected into immunocompromised hosts are believed to form teratomas. At present, this property of ES cells is a major limitation to their clinical utility (23). We wondered whether in contrast to our observations regarding differentiation, a reciprocal relationship existed between membrane potential and teratoma formation. As described previously, we therefore sorted mES cells based on their intrinsic mitochondrial membrane potential and then injected equal numbers of ΔΨmL and ΔΨmH cells into SCID mice recipients. As a control, we also injected the same number of mES cells from the bulk population of unsorted cells. These bulk mES cells exhibited a normal distribution of both membrane potentials and oxygen consumption. As seen in Fig. 5A, assessment of these tumors 25 days after injection demonstrated that teratoma formation was remarkably related to the previously described initial metabolic parameters. Histologic analysis of the tumors formed after injection of ΔΨmH cells revealed that these cells were capable to differentiate into tissues of all three germ layers, ectoderm, mesoderm, and endoderm (Fig. 5, B–E). To further establish that ΔΨmH cells are pluripotent, we used these cells in a blastocyst injection. As seen in Fig. 5F, ΔΨmH cells appear to be capable of contributing to all three germ layers of the developing embryo (Fig. 5F).
FIGURE 5.
Teratoma formation reflects intrinsic metabolic capacity. A, cells were sorted based on mitochondrial activity, and equal numbers (3 × 10⁶) of high, low, or unsorted mES cells were injected into SCID mice. Twenty-five days later, tumors were excised, and the sizes of tumors were measured. B–E, hematoxylin and eosin stains of teratomas formed from ΔΨmH cells demonstrating the presence of tissue components originating from all three germ layers including epidermal tissue of ectodermal origin. C and D, skeletal muscle tissue (C) and cartilage (D) of mesodermal origin. E, gastrointestinal tract-like epithelium of endodermal origin. F, stained and sectioned mouse embryo following blastocyst injection of β-galactosidase containing ROSA26 ΔΨmH. The ΔΨmH-derived cells (blue) appear to contribute widely to all three germ layers.
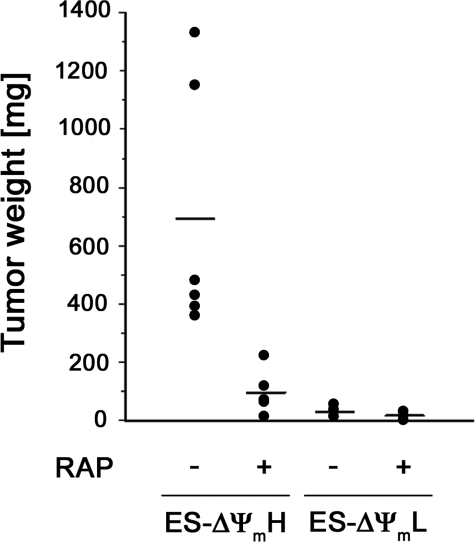
We next took advantage of our observations that mitochondrial activity is reflective of underlying mTOR activity to hypothesize that teratoma formation should be sensitive to rapamycin treatment. To test this, we injected SCID mice with equal amounts of ΔΨmL and ΔΨmH cells and then randomized these animals to treatment with daily injections of vehicle or rapamycin (Fig. 6). Although the total number of mES cells injected in these experiments was reduced when compared with the experiments described in Fig. 5, once again, the ΔΨmH cells formed significantly larger tumors than the ΔΨmL cells. Interestingly, the tumors formed by the ΔΨmH cells were also markedly inhibited by the administration of rapamycin (Fig. 6).
FIGURE 6.
Rapamycin (RAP) preferentially inhibits growth of teratomas after injection of ΔΨmH cells. SCID mice were injected with 1 × 10⁶ ΔΨmL or ΔΨmH cells, and then injected animals were randomized for daily injections of rapamycin (4 mg/kg) or vehicle. Tumors were excised and measured 25 days later.
DISCUSSION
In conclusion, we demonstrate a heretofore unknown relationship between stem cell fate and intrinsic mitochondrial activity. For the case of mES cells, we observed that cells exhibiting spontaneously low mitochondrial membrane potential have a correspondingly low rate of mitochondrial oxygen consumption. These metabolically more quiescent ES cells posses a significant enhancement in their capacity for mesodermal differentiation with a reduced ability to form teratomas. The opposite appears to be the case for mES cells with high resting mitochondrial membrane potential.
Previous studies have implicated activation of the HIF family of transcription factors as the basis for stimulated differentiation of mES cells and hematopoietic stem cell under low oxygen conditions (2). In general, these experiments have been done at oxygen tensions of 3% or lower (6, 8, 9). Nonetheless, our data suggest that even at 5% oxygen, mES cell differentiation into Flk-1-positive mesoderm is enhanced, whereas we did not observe activation of HIF-1α under these conditions. These observations are consistent with our sorting experiments and suggest that lower rates of mitochondrial metabolism favor mES cells becoming more sensitive to the normal in vitro stimulus for differentiation along the mesodermal lineage.
We and others have previously described the regulation of mitochondrial oxidative capacity and function by the mTOR signaling pathway (17, 22). In line with these earlier studies, we found a positive correlation between mitochondrial metabolism and levels of mTOR activity in mES cells. Moreover, the metabolic phenotype strongly correlated with the differentiation capacity. This phenotype appeared to be sustained by mTOR-dependent pathways as treatment of cells with the mTOR inhibitor rapamycin inhibits mitochondrial respiration and mimicked the phenotype seen in the ΔΨmL cells. These observations for the first time show that manipulating mTOR signaling and mitochondrial function affects ES cell differentiation and point to a central role of the mTOR-mitochondria axis in ES cell biology.
It is currently unclear why in mES cells, as well as in our previous analysis of Jurkat cells (17), presumed clonal populations of cells maintain such large differences in intrinsic metabolic rates. Nor is it entirely clear how these differences are established and maintained. The recent description of an interaction between mTOR and PGC-1α (22) suggests that differences in mitochondrial biogenesis might be a potential explanation. Nonetheless, there are a number of significant gaps in our identification and understanding of what are the relevant nuclear and cytoplasmic control mechanisms that can and do exert regulation over mitochondrial function.
Earlier studies in mTOR knock-out mice showed that mTOR signaling is necessary for blastocyst and mES cell proliferation in vitro (24, 25). These previous observations are consistent with our observations that mTOR activity correlates with in vivo teratoma growth. It is, however, interesting to note that in our experiments, teratoma size was correlated with mitochondrial function. To our knowledge, no previous studies have assessed the in vivo tumorigenicity of clonal cell populations that differ based on their mitochondrial function. Nonetheless, our data suggest that cells with initially high mitochondrial activity form significantly larger tumors than genetically identical cells possessing lower mitochondrial metabolism. Although such relationships may only apply to mES cells, our preliminary evidence suggests that a similar relationship appears to hold true in a variety of human tumor cell lines.5
Our observations regarding mitochondrial metabolism and tumor growth are somewhat surprising since the growth of rapidly proliferating tumor cells have been closely linked to high rates of aerobic glycolysis through the well known Warburg effect (18). The relative growth advantage of high mitochondrial metabolism or high glycolytic flux may depend on the size of the tumor and the available nutrient supply. Indeed, aerobic glycolysis might be particularly important in larger tumors where an adaptive switch to a more glycolytic phenotype presumably allows for growth even in the setting of tissue hypoxia and scarceness of nutrients. On a more practical note, the exquisite sensitivity of ES-derived tumors to rapamycin may be of some practical benefit if these cells, or derivatives of these cells, are entertained for therapeutic purposes.
It is tempting to speculate that since mitochondrial metabolism and the subsequent generation of reactive oxygen species is often associated with DNA damage and aging (5), the coupling between metabolism and stem cell fate may provide considerable advantages to the organism. In particular, the requirement that stem cells persist throughout the entire lifespan of the organism requires extraordinary measures to preserve genomic integrity. Preferential differentiation of cells with low metabolism might provide a way to limit genomic instability in stem cell progeny. These observations also suggest the possibility that differential mitochondrial activity may provide a unique therapeutic opportunity to both potentially enhance the clinical utility of ES cells, as well as preferentially targeting the cancer stem cell.
Supplementary Material
Acknowledgments
We are grateful to Daniela Malide and Christian A. Combs for confocal microscopy assistance.
This work was authored, in whole or in part, by National Institutes of Health staff. The costs of publication of this article were defrayed in part by the payment of page charges. This article must therefore be hereby marked “advertisement” in accordance with 18 U.S.C. Section 1734 solely to indicate this fact.
Footnotes
The abbreviations used are: mES, murine embryonic stem cells; HIF, hypoxia-inducible factor; LIF, leukemia inhibitory factor; TMRM, tetramethyl rhodamine methyl ester; mTOR, mammalian target of rapamycin; FCCP, carbonyl cyanide p-trifluoromethoxyphenylhydrazone; FACS, fluorescent activated cell sorting; SCID, severe combined immune deficiency.
S. M. Schieke, and T. Finkel, unpublished observations.
References
- 1.Saretzki, G., Armstrong, L., Leake, A., Lako, M., and von Zglinicki, T. (2004) Stem Cells 22 962-971 [DOI] [PubMed] [Google Scholar]
- 2.Keith, B., and Simon, M. C. (2007) Cell 129 465-472 [DOI] [PMC free article] [PubMed] [Google Scholar]
- 3.Chow, D. C., Wenning, L. A., Miller, W. M., and Papoutsakis, E. T. (2001) Biophys. J. 81 685-696 [DOI] [PMC free article] [PubMed] [Google Scholar]
- 4.Parmar, K., Mauch, P., Vergilio, J. A., Sackstein, R., and Down, J. D. (2007) Proc. Natl. Acad. Sci. U. S. A. 104 5431-5436 [DOI] [PMC free article] [PubMed] [Google Scholar]
- 5.Balaban, R. S., Nemoto, S., and Finkel, T. (2005) Cell 120 483-495 [DOI] [PubMed] [Google Scholar]
- 6.Cipolleschi, M. G., Dello Sbarba, P., and Olivotto, M. (1993) Blood 82 2031-2037 [PubMed] [Google Scholar]
- 7.Danet, G. H., Pan, Y., Luongo, J. L., Bonnet, D. A., and Simon, M. C. (2003) J. Clin. Investig. 112 126-135 [DOI] [PMC free article] [PubMed] [Google Scholar]
- 8.Ivanovic, Z., Dello Sbarba, P., Trimoreau, F., Faucher, J. L., and Praloran, V. (2000) Transfusion (Malden) 40 1482-1488 [DOI] [PubMed] [Google Scholar]
- 9.Ramirez-Bergeron, D. L., Runge, A., Dahl, K. D., Fehling, H. J., Keller, G., and Simon, M. C. (2004) Development (Camb.) 131 4623-4634 [DOI] [PubMed] [Google Scholar]
- 10.Morrison, S. J., Csete, M., Groves, A. K., Melega, W., Wold, B., and Anderson, D. J. (2000) J. Neurosci. 20 7370-7376 [DOI] [PMC free article] [PubMed] [Google Scholar]
- 11.Studer, L., Csete, M., Lee, S. H., Kabbani, N., Walikonis, J., Wold, B., and McKay, R. (2000) J. Neurosci. 20 7377-7383 [DOI] [PMC free article] [PubMed] [Google Scholar]
- 12.Genbacev, O., Zhou, Y., Ludlow, J. W., and Fisher, S. J. (1997) Science 277 1669-1672 [DOI] [PubMed] [Google Scholar]
- 13.Covello, K. L., Kehler, J., Yu, H., Gordan, J. D., Arsham, A. M., Hu, C. J., Labosky, P. A., Simon, M. C., and Keith, B. (2006) Genes Dev. 20 557-570 [DOI] [PMC free article] [PubMed] [Google Scholar]
- 14.Kaidi, A., Williams, A. C., and Paraskeva, C. (2007) Nat Cell Biol. 9 210-217 [DOI] [PubMed] [Google Scholar]
- 15.Gustafsson, M. V., Zheng, X., Pereira, T., Gradin, K., Jin, S., Lundkvist, J., Ruas, J. L., Poellinger, L., Lendahl, U., and Bondesson, M. (2005) Dev. Cell 9 617-628 [DOI] [PubMed] [Google Scholar]
- 16.Ying, Q. L., Nichols, J., Chambers, I., and Smith, A. (2003) Cell 115 281-292 [DOI] [PubMed] [Google Scholar]
- 17.Schieke, S. M., Phillips, D., McCoy, J. P., Jr., Aponte, A. M., Shen, R. F., Balaban, R. S., and Finkel, T. (2006) J. Biol. Chem. 281 27643-27652 [DOI] [PubMed] [Google Scholar]
- 18.Kim, J. W., and Dang, C. V. (2006) Cancer Res. 66 8927-8930 [DOI] [PubMed] [Google Scholar]
- 19.Johansson, B. M., and Wiles, M. V. (1995) Mol. Cell. Biol. 15 141-151 [DOI] [PMC free article] [PubMed] [Google Scholar]
- 20.Yamaguchi, T. P., Dumont, D. J., Conlon, R. A., Breitman, M. L., and Rossant, J. (1993) Development (Camb.) 118 489-498 [DOI] [PubMed] [Google Scholar]
- 21.Wilkinson, D. G., Bhatt, S., and Herrmann, B. G. (1990) Nature 343 657-659 [DOI] [PubMed] [Google Scholar]
- 22.Cunningham, J. T., Rodgers, J. T., Arlow, D. H., Vazquez, F., Mootha, V. K., and Puigserver, P. (2007) Nature 450 736-740 [DOI] [PubMed] [Google Scholar]
- 23.Deb, K. D., and Sarda, K. (2008) J. Transl. Med. 6 7. [DOI] [PMC free article] [PubMed] [Google Scholar]
- 24.Murakami, M., Ichisaka, T., Maeda, M., Oshiro, N., Hara, K., Edenhofer, F., Kiyama, H., Yonezawa, K., and Yamanaka, S. (2004) Mol. Cell. Biol. 24 6710-6718 [DOI] [PMC free article] [PubMed] [Google Scholar]
- 25.Takahashi, K., Murakami, M., and Yamanaka, S. (2005) Biochem. Soc. Trans. 33 1522-1525 [DOI] [PubMed] [Google Scholar]
Associated Data
This section collects any data citations, data availability statements, or supplementary materials included in this article.


