

Abstract
To elucidate the mechanism of bifurcated oxidation of quinol in the cytochrome bc1 complex, Rhodobacter sphaeroides mutants, H198N and H111N, lacking heme bL and heme bH, respectively, were constructed and characterized. Purified mutant complexes have the same subunit composition as that of the wild-type complex, but have only 9-11% of the electron transfer activity, which is sensitive to stigmatellin or myxothiazol. The Em values for hemes bL and bH in the H111N and H198N complexes are -95 and -35 mV, respectively. The pseudo first-order reduction rate constants for hemes bL and bH in H111N and H198N, by ubiquiniol, are 16.3 and 12.4 s-1, respectively. These indicate that the Qp site in the H111N mutant complex is similar to that in the wild-type complex. Pre-steady state reduction rates of heme c1 by these two mutant complexes decrease to a similar extent of their activity, suggesting that the decrease in electron transfer activity is due to impairment of movement of the head domain of reduced iron-sulfur protein, caused by disruption of electron transfer from heme bL to heme bH. Both mutant complexes produce as much superoxide as does antimycin A-treated wild-type complex. Ascorbate eliminates all superoxide generating activity in the intact or antimycin inhibited wild-type or mutant complexes.
The cytochrome bc1 complex, also known as complex III or ubiquinol-cytochrome c oxidoreductase, is an essential segment of the electron transfer chain in mitochondria and photosynthetic bacteria (1). The complex catalyzes electron transfer from quinol to cytochrome c (c2 in some bacteria) with concomitant translocation of protons across the inner membrane of mitochondria or cytoplasmic membrane of bacteria. Intensive biochemical and biophysical studies on this complex (2-4) have led to the formulation of the “protonmotive Q-cycle” mechanism for electron and proton transfer in this complex (5-7). The key step of the Q-cycle mechanism is the bifurcated oxidation of quinol at the quinol oxidation site (QP). In the Q-cycle mechanism, it was postulated that the first electron of quinol is transferred to the “high potential chain,” consisting of iron-sulfur protein (ISP)2 and cytochrome c1. Then the second electron of quinol, via a transient semiquinone, is passed through the “low potential chain” consisting of cytochromes bL and bH, to reduce ubiquinone or ubisemiquinone bound at the quinol reduction site (QN). One drawback of this sequential scheme is the lack of a “functional” semiquinone at the QP site (8-10), even though some radicals have been reported under abnormal conditions (11, 12). Recently, pre-steady state kinetic analysis of the reduction of cytochrome bL and ISP in a same sample using fast quenching coupled with EPR (13) indicates that both iron-sulfur cluster (ISC) and heme bL are reduced by quinol at the same rate, suggesting a concerted scheme for the bifurcated oxidation of quinol at the QP site (13, 14).
Although the concerted mechanism explains why the proposed semiquinone at the QP site is not detected (13), the proponents of sequential mechanism argue that similar reduction rates observed in heme bL and ISC is due to the low (60 μs) time resolution of the instrument used. They attribute the missing semiquinone to its low stability and the fast electron transfer to heme bL (15). One way to confirm the existence of semiquinone at the QP site is using a mutant complex lacking heme bL. If the sequential mechanism exists, one should expect to see some Qp site semiquinone in this mutant complex, due to the lack of its electron acceptor, heme bL.
The first cytochrome bc1 complex crystallographic structure from bovine heart mitochondria was reported in 1997 (16). Since then, more x-ray crystallographic structures of bc1 complexes from different species have become available (17-20). Based on the poor electron density of ISP and the larger than expected distance between ISC and heme c1 in the first crystallographic structure, a need for head domain movement and flexibility of the neck region of ISP were proposed (16-18) and confirmed experimentally (21-27). The head domain of ISP is considered to have two docking positions: b-position and c1-position (17). Reduction of ISP by quinol takes place when the head domain of ISP is located at the b-position. It then moves to the c1-position to reduce cytochrome c1. Although few investigators question the requirement for movement of the ISP head domain during bc1 catalysis (17, 21-27), there is no consensus for what the driving force for this movement is (8, 13, 28-31).
One proposed mechanism suggests that movement of reduced ISP head domain from the b-to c1-position is regulated by protein conformational changes induced by electron transfer from heme bL to heme bH (13, 31). Recent results (32, 33) of analyses of the binding affinity and inhibitory efficacies of Pm and Pf inhibitors, at different redox states of the cytochrome bc1 complex, are consistent with this proposal. One way to further substantiate this proposal is to determine the electron transfer activity and pre-steady state reduction rates of hemes c1, bL, and bH, by quinol, in the presence and absence of inhibitors, in mutant complexes lacking heme bL or heme bH and compared with those obtained from the wild-type complex. If this proposal is correct, one would expect to see a decrease in electron transfer activity and the rate of heme c1 reduction in bH and bL knock-out mutant complexes.
Formation of superoxide anion is a well established side reaction during the oxidation of quinol by cytochrome bc1 complex. Addition of antimycin to the intact bc1 complex increases superoxide production (34-36). The electron leakage (or superoxide production) site can be at the semiquinone (37) of the Qp site or reduced heme bL (34, 38), depending on the mechanism by which bifurcation of ubiquinol proceeds. If bifurcation of quinol at the Qp site proceeds by the sequential mechanism, semiquinone formed at the QP site and reduced heme bL would both be the electron leakage sites during bc1 catalysis. Thus, one would expect to see at least some increase in superoxide production in the mutant complex lacking heme bL, due to the possible increase of semiquinone. If bifurcation of ubiquinol at the Qp site proceeds by the concerted mechanism, reduced heme bL would be the only electron leakage site, because there will be no semiquinone at the QP site during bc1 catalysis.
The mechanism for superoxide production by the bc1 complex is unclear. Comparing superoxide production by wild-type and mutant complexes lacking either heme bL or heme bH, under various conditions, should provide insight into the superoxide production mechanism.
Herein we report detailed procedures for generating Rhodobacter sphaeroides mutants expressing cytochrome bc1 complex lacking either heme bL (H198N) or heme bH (H111N), purifying cytochrome bc1 complexes from intra-cytoplasmic membranes (ICM) of both mutants, and characterizing the purified mutant complexes in subunit composition, electron transfer activity, absorption spectral properties, redox protential, presteady state reduction kinetics of hemes (bL, bH, and c1), and superoxide production of purified complexes.
EXPERIMENTAL PROCEDURES
Materials—Cytochrome c (horse heart, type III), stigmatellin, myxothiazol, antimycin A, and xanthine oxidase were purchased from Sigma. n-Dodecyl-β-d-maltopyranoside (DM) and n-octyl-β-d-glucopyranoside were from Anatrace. Proteinase K was purchased from Invitrogen. Nickel-nitrilotriacetic acid gel and a Qiaprep spin Miniprep kit were from Qiagen. 2-Methyl-6-(4-methoxyphenyl)-3,7-dihydroimidazol[1,2-α]pyrazin-3-one, hydrochloride (MCLA) was from Molecular Probes, Inc. 2,3-Dimethoxy-5-methyl-6-(10-bromodecyl)-1,4-benzoquinol (Q0C10BrH2) was prepared as reported previously (39). All other chemicals were of the highest purity commercially available.
Generation of R. sphaeroides Cytochrome bc1 Mutants—Mutations were constructed by the QuikChange site-directed mutagenesis kit from Stratagene using a supercoiled doublestranded pGEM7Zf(+)-fbcB as template. Forward and reverse primers were used for PCR amplification (Table 1). The pGEM7Zf(+)-fbcB plasmid (40) was constructed by ligating the NsiI-XbaI fragment from pRKDfbcFBC6HQ into NsiI and XbaI sites of the pGEM7Zf(+) plasmid. The NsiI-XbaI fragment from the pGEM7Zf(+)-fbcBm plasmid was ligated into the NsiI and XbaI sites of the pRKD418-fbcFBKmC6HQ plasmid to generate the pRKD418-fbcFBmC6HQ plasmid. A plate-mating procedure (41) was used to mobilize the pRKD418-fbcFBmC6HQ plasmid in Escherichia coli S17 cells into R. sphaeroides BC17 cells. The presence of engineered mutations was confirmed by DNA sequencing of the NsiI-XbaI fragment as previously reported (41). DNA primers were purchased from Invitrogen. DNA sequencing was performed by the Recombinant DNA/Protein Core Facility at Oklahoma State University.
TABLE 1.
Oligonucleotides used for site-directed mutagenesis
The underlined bases correspond to the genetic codes for the amino acid(s) to be mutated.
| Sequence | |
|---|---|
| H198N(F)a | CGGTTCTTCTCGCTGAACTACCTGCTGCCCTTCG |
| H198N(R) | CGAAGGGCAGCAGGTAGTTCAGCGAGAAGAACCG |
| H111N(F) | CGCGGTCTATCTGAACATCTTCCGCGGCCTC |
| H111N(R) | GAGGCCGCGGAAGATGTTCAGATAGACCGCG |
F and R in parentheses denote forward and reverse primers, respectively.
Enzyme Preparations and Activity Assays—Chromatophores, intracytoplasmic membrane, and the His6-tagged cytochrome bc1 complexes were prepared as previously reported (21). To assay cytochrome bc1 complex activity, chromatophores or purified cytochrome bc1 complexes were diluted with 50 mm Tris-Cl, pH 8.0, containing 200 mm NaCl and 0.01% DM to a final concentration of cytochrome c1 of 1 μm. Appropriate amounts of the diluted samples were added to 1 ml of assay mixture containing 100 mm Na+/K+ phosphate buffer, pH 7.4, 300 μm EDTA, 100 μm cytochrome c, and 25 μm Q0C10BrH2. Activities were determined by measuring the reduction of cytochrome c (the increase of absorbance at 550 nm) in a Shimadzu UV 2401 PC spectrophotometer at 23 °C, using a millimolar extinction coefficient of 18.5 for calculation. The non-enzymatic oxidation of Q0C10BrH2, determined under the same conditions in the absence of enzyme, was subtracted from the assay.
Determination of Heme Content in bc1 Complexes—To
determine the concentrations of hemes c1 and b in
wild-type and mutant complexes of H111N and H198N, purified cytochrome
bc1 samples were diluted to a concentration of 5
μm cytochrome c1 in 1.0 ml of aqueous
solution containing 200 mm NaOH and 40% pyridine. An appropriate
amount of K3Fe(CN)6 was added to assure
bc1 complexes were fully oxidized. Spectra of oxidized
bc1 samples were recorded in a Shimadzu UV-2401 PC
spectrophotometer at 23 °C. Solid sodium dithionite (a few grains) was
then added, and several successive spectra of the reduced pyridine hemochromes
were recorded (every 20 s) until there were no significant differences between
two consecutive spectra. Table
2 lists the extinction coefficients
(42) of pyridine hemochromes
used to calculate the concentration of hemes b and
c1. To calculate the concentration of hemes b and
c1 in a bc1 sample, the equation pair
below was employed. In these equations ε stands for the extinction
coefficient. The subscript numbers of ε indicate the corresponding
wavelengths. C stands for
concentration.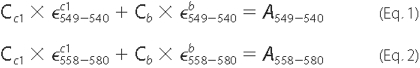
TABLE 2.
Difference of millimolar extinction coefficients of reduced pyridine hemochromogen of hemes b and c1 at the selected wavelengths
| Hemochromogen |  |
 |
|---|---|---|
| Heme c1 | 21.13 | 4.28 |
| Heme b | 9.98 | 32.86 |
Potentiometric Titrations of the Cytochrome b of Mutant Cytochrome bc1 Complexes—Redox titrations of cytochromes b in wild-type and mutant bc1 complexes were essentially according to the published method (43, 44). 3-ml aliquots of the bc1 complex (2 μm cytochrome b) in 0.1 m Na+/K+ phosphate buffer, pH 7.0, containing 25 μm 1,4-benzoquinone (Em, 293 mV), 2,3,5,6-tetramethyl-p-phenylenediamine (Em, 260 mV), 1,2-naphthoquinone (Em, 143 mV), phenazine methosulfate (Em, 80 mV), phenazine ethosulfate (Em, 55 mV), 1,4-naphthoquinone (Em, 36 mV), duroquinone (Em, 5 mV), pyocyanine (Em, -34 mV), indigo carmine (Em, -125 mV), and anthraquinone-2-sulfonic acid (Em, -225 mV) were used. Reductive titrations were carried out by addition of sodium dithionite solution to the ferricyanide-oxidized samples and oxidative titrations by addition of ferricyanide solution to the dithionite-reduced samples. At indicated Eh values during the redox titration, absorption spectra from 600 to 500 nm were taken. The optical absorbance at 560 nm, minus that at 580 nm, was used for determination of cytochrome b reduction. Midpoint potentials of cytochrome bL and bH were calculated by fitting the redox titration data, using the Nernst equation for a one-electron carrier (n = 1), by Kaleidagraph (44).
Fast Kinetics Study—To determine electron transfer rates between the quinol and heme b or heme c1, the cytochrome bc1 complex was mixed with ubiquinol (Q0C10BrH2) in equal volume at room temperature in an Applied Photophysics stopped-flow reaction analyzer SX.18MV (Leatherhead, United Kingdom). The concentration of bc1 complex was 12 μm (based on cytochrome c1) in 50 mm Tris-Cl, pH 8.0, at 4 °C, containing 200 mm NaCl and 0.01% DM. For use in the stopped-flow, Q0C10BrH2 in ethanol was diluted to 240 μm in the same buffer. Reductions of cytochrome b and cytochrome c1 in wild-type were monitored by the increase of absorption difference of A560-580 and A551-539, respectively, with a photodiode array scan between 600 and 500 nm. Reductions of cytochrome bL in H111N and bH in H198N were determined from the increase in A565-580 and A560-580. When an inhibitor was used, the cytochrome bc1 complex was treated with 5-fold molar excess of inhibitor over heme c1, for 5 min at 4 °C, prior to the experiment. Because the concentration of ubiquinol used was 20 times higher than that of the cytochrome bc1 complex, the reactions between bc1 and quinol were treated as pseudo first-order reactions. Time traces of the reaction were fitted with a first-order rate equation to obtain the pseudo first rate constants k1 by Kaleidagraph.
Detection of Q Radical at the QP Site with EPR—300 μl of 150 μm purified cytochrome bc1 complexes were treated with 10-fold excess of ubiquinol to fully reduce cytochrome c1 in 10 s and frozen in liquid nitrogen. EPR spectra were recorded at -170 °C with the following instrument settings: microwave frequency, 9.4 GHz; microwave power, 2.2 milliwatts; modulation amplitudes, 6.3 G; modulation frequency, 100 kHz; time constant, 655.4 ms; sweep time, 167.8 s; conversion time, 163.8 ms.
Determination of Superoxide Production—Superoxide anion
generation was determined by measuring the chemiluminescence of the
MCLA- adduct
(45), in an Applied
Photophysics stopped-flow reaction analyzer SX.18MV (Leatherhead, United
Kingdom), by leaving the excitation light off and registering light emission
(46,
47). Reactions were carried
out at 23 °C by mixing 1:1 solutions A and B. Solution A contained 100
mm Na+/K+ phosphate buffer, pH 7.4, 1
mm EDTA, 1 mm KCN, 1 mm NaN3, 0.1%
bovine serum albumin, 0.01% DM, and 5.0 μm wild-type or mutant
bc1 complex. Solution B was the same as A with the
bc1 complex being replaced with 125 μm
Q0C10BrH2 and 4 μm MCLA. Once
the reaction starts, the produced chemiluminescence in voltage was
consecutively monitored for 2 s.
adduct
(45), in an Applied
Photophysics stopped-flow reaction analyzer SX.18MV (Leatherhead, United
Kingdom), by leaving the excitation light off and registering light emission
(46,
47). Reactions were carried
out at 23 °C by mixing 1:1 solutions A and B. Solution A contained 100
mm Na+/K+ phosphate buffer, pH 7.4, 1
mm EDTA, 1 mm KCN, 1 mm NaN3, 0.1%
bovine serum albumin, 0.01% DM, and 5.0 μm wild-type or mutant
bc1 complex. Solution B was the same as A with the
bc1 complex being replaced with 125 μm
Q0C10BrH2 and 4 μm MCLA. Once
the reaction starts, the produced chemiluminescence in voltage was
consecutively monitored for 2 s.
RESULTS AND DISCUSSION
Characterization of Mutants Lacking Either Heme bL (H198N) or Heme bH (H111N)—In the cytochrome b subunit of cytochrome bc1 complex from the R. sphaeroides, His97 and His198 are the ligands of heme bL, whereas His111 and His212 are the ligands of heme bH. Two mutants, H198N and H111N, in which histidine 198 and histidine 111 of cytochrome b were, respectively, substituted with Asn were constructed and selected for the present study. The H198N mutant knocks out heme bL, whereas the H111N mutant knocks out heme bH. Because the cytochrome bc1 complex is absolutely required for photosynthetic growth of this bacterium, and hemes bL and bH constitute the low potential electron transfer chain in the proposed Q-cycle mechanism, it is important to see whether or not these two mutants can support photosynthetic growth. Cultures of wild-type and mutants were placed in a light tank after 4 h of dark grow. Photosynthetic growth was followed by the increase of cell intensity. None of the mutants show any evidence of growth in 6-8 days. To grow cells for the preparation of mutated bc1 complexes, H198N and H111N were grown semi-aerobically. These two mutants can grow semiaerobically at a rate comparable with that of the wild-type cells. ICM were prepared from semiaerobically grown cells and used for preparation of corresponding mutant complexes.
ICMs prepared from mutants H198N and H111N contain subunits cytochrome b, cytochrome c1, ISP, and subunit IV in the same concentrations as those detected in the wild-type ICM, determined by Western blot using antibodies against these four individual proteins. This result indicates that lacking heme bL in the H198N mutant and lacking heme bH in the H111N mutant does not impair the complex assembly into the ICM membrane. This finding is contradictory to the previous report (48) that ICMs from mutants lacking heme bH (H111N, H111D, and H212D) have subunits of cytochromes b and c1, whereas no such subunits were detected in ICMs from mutants lacking heme bL (H97N, H97D, H198N, and H198Y). While constructing mutants lacking heme bL or heme bH we observed that some heme bL knocked out mutants, such as H97F and H97N, are unstable, purification attempts were not successful. The structural stability of H198N and H111N mutant complexes in their ICMs enables us to purify and characterize these two mutant complexes with methods similar to those used for the wild-type complex.
Fig. 1 compares SDS-PAGE patterns of purified wild-type and mutant cytochrome bc1 complexes. The purification procedure involves DM solubilization followed by nickel-affinity gel column chromatography (21). The yields and subunit compositions of purified mutant complexes are comparable with those of the wild-type.
FIGURE 1.

SDS-PAGE of purified cytochrome bc1 complexes from wild-type and mutants H198N and H111N. Lanes 1-4 are for polypeptide standard, wild-type, mutant H198N, and mutant H111N, respectively. Aliquots of purified bc1 complexes were incubated with 1% SDS and 0.4% β-mercaptoethanol at 37 °C for 20 min. Digested samples containing about 200 pmol of cytochrome c1 were subjected to electrophoresis. The molecular masses of standard polypeptides are: 10, 15, 20, 25, 30, 40, 50 and 60 kDa.
Fig. 2 shows absorption spectra of purified wild-type (A) and mutant complexes of H198N (B) and H111N (C). The presence of cytochromes bH and bL in the wild-type complex is revealed by a difference spectrum of dithionite-partially reduced minus ascorbate reduced and a difference spectrum of dithionite-fully reduced minus dithionite-partially reduced, respectively (49). If a catalytic amount of succinate-Q reductase is added to a purified wild-type complex, bH is observed from a difference spectrum of succinate-reduced minus ascorbate-reduced and bL from a difference spectrum of dithionite-reduced minus succinate-reduced (50). Ascorbate reduces cytochrome c1; succinate reduces cytochromes c1 and bH; dithionite reduces cytochromes c1, bH, and bL. Cytochrome bH has an α absorption peak at 560 nm, whereas cytochrome bL has a double-α peak with absorption at 565 nm and a shoulder at 558 nm (see Fig. 2A). The α absorption peak of cytochrome b in the H198N mutant complex (Fig. 2B), which is obtained from a difference spectrum of dithionite-reduced minus ascorbate-reduced, is at 560 nm, indicating that only cytochrome bH is present in this mutant complex. The α peak of cytochrome b in the H111N mutant complex is at 565 nm with a shoulder at 558 nm (Fig. 2C), indicating that only cytochrome bL is present in this mutant complex.
FIGURE 2.

Absorption spectra of wild-type and mutant bc1 complexes. A-C are for the wild-type (WT), mutants H198N and H111N complexes, respectively. The cytochrome c1 concentration of complexes used was 1 μm for A, 1.5 μm for B and C. The gray spectrum stands for ascorbate-reduced sample; and black solid spectrum for the dithionite-fully reduced sample. The black dotted and black dot-dash spectra in B and C, respectively, are difference spectra of the dithionite-fully reduced minus ascorbate reduced samples. Black dotted and black dot-dash spectra in A are the difference spectra of the dithionite-partially reduced (∼-50 mV) minus ascorbate reduced and of the dithionite-fully reduced minus the dithionite-partially reduced, respectively.
To detect the presence of trace amounts of other cytochrome b in a given mutant, the complex was titrated with dithionite solution to reduce cytochromes b gradually (data not shown). In the mutant H198N complex, the last reduced heme b showed a heme bH absorption spectrum, the same as that of the very first reduced one, suggesting that the H198N mutant complex contains only heme bH. If there is some heme bL in this mutant complex, the difference spectrum of the last dithionite reduced minus the second to last dithionite reduced should differ from that of the first dithionite reduced minus ascorbate reduced, because heme bL is expected to be reduced last due to its low redox potential. In the H111N mutant complex, the difference spectrum of the first dithionite reduced minus ascorbate reduced is the same as the difference spectrum obtained from the last dithionite reduced minus the second to the last dithionite reduced. These two difference absorption spectra are identical to those of heme bL in the wild-type complex, suggesting that the H111N mutant complex contains only heme bL.
In general, for bc1 complexes, hemes b, including heme bL and bH, are calculated from the difference extinction coefficient of 28.5/mm·cm between 560 and 580 nm in the difference spectrum of dithionite reduced minus ascorbate reduced samples. The heme c1 is calculated from a difference spectrum of ascorbate reduced minus ferricyanide-oxidized complex using a difference extinction coefficient of 17.5/mm·cm between 551 and 539 nm. Because the extinction coefficient of individual heme bL and heme bH is not firmly established, we used the alkaline pyridine hemochromogen spectrum to determine the concentrations of hemes b and c1 in mutant complexes of H198N and H111N. The equations used for calculation are listed under “Experimental Procedures.” In the wild-type bc1 complex the b/c1 molar ratio is about 1.65. In mutant complexes of H198N and H111N, b/c1 molar ratios are close to 1.0 (see Table 3). Based on the heme b contents determined by pyridine hemochrome and the difference absorption spectra of dithionite reduced minus ascorbate reduced mutant complexes, the difference extinction coefficients for hemes bL and bH were calculated to be 12.0/mm·cm between 565 and 580 nm and 24.5/mm·cm between 560 and 580 nm, respectively. The lower than expected b/c1 ratio in the wild-type complex is probably due to the presence of excess cytochrome c1 in the complex, as the His tag is located at the C terminus of cytochrome c1 protein. The presence of excess cytochrome c1 in the wild-type complex was confirmed by protein crystallization (51, 52). In the crystalline bc1 complex, the b/c1 molar ratio is 2. The excess cytochrome c1 is found in the mother liquid after crystallization.
TABLE 3.
Characterization of mutant H198N and H111N bc1 complexes
| Wild-type | H198N | H111N | |
|---|---|---|---|
| Photosynthetic growth | Yes | No | No |
| Cytochrome b/cytochrome c1 ratio | 1.65 | 1.0 | 0.98 |
| Specific activitya | 3.5 | 0.4 | 0.32 |
| Antimycin sensitivity | Yes | 36.4%b | No |
| Stigmatellin sensitivity | Yes | Yes | Yes |
| Myxothiazol sensitivity | Yes | Yes | Yes |
The unit of specific activity is μmol of cytochrome c reduced/min/nmol of cytochrome c1.
The 36.4% means the loss of 36.4% of its bc1 activity upon antimycin treatment.
Effect of Mutations on the Electron Transfer Activity and the Redox Potential of b Hemes—Specific activities of purified mutant complexes were determined and compared with the wild-type complex. Mutant complexes of H198N and H111N have low bc1 activities, about 9-11% of that in the wild-type complex (Table 3). The bc1 activity detected in these two mutant complexes is inhibited by stigmatellin and myxothiazol, indicating ubiquinol can bind and be oxidized at the QP site in both complexes. As expected, the H111N mutant complex is completely resistant to antimycin. However, it is somewhat surprising that H198N is partially sensitive to antimycin.
To see if these substitutions have any effect on the Em of heme bL or heme bH, Em values of heme bL and bH in mutants H111N and H198N were determined, respectively. As shown in Fig. 3, heme bH in the H198N mutant complex has an Em of -35 mV, significantly lower than the Em of heme bH in the wild-type complex (50 mV). The Em of heme bL in the H111N mutant complex is -95 mV, comparable with that in the wild-type complex (-93 mV). However, this value is lower than that reported by others (48) using ICM of the same mutant. Thus the substitution in mutant H198N has some effect on the Em of heme bH, whereas the substitution in mutant H111N has little effect on the Em of heme bL. These results seem contradictory to the columbic interaction between hemes bL and bH reported in the literature (15, 48).
FIGURE 3.

Redox potential titration of heme b in wild-type (A), H198N (B), and H111N (C) mutant cytochrome bc1 complexes. Oxidative and reductive titrations were performed using potassium ferricyanide and sodium dithionite, respectively, as described under “Experimental Procedures.”
Effect of Mutations on the Rate of Heme c1 Reduction by Quinol—The loss of heme bL and heme bH in the mutant complexes of H198N and H111N, respectively, provides us an opportunity to study the effect of the low potential chain on c1 reduction and movement of the ISP head domain. The fast-kinetics study is carried out on the stop-flow instrument of Applied Photophysics Ltd. Fig. 4 shows the time traces of heme c1 reduction, for 1.2 s, in wild-type and mutant complexes of H198N and H111N. Heme c1 reduction rates in the two mutant complexes are much lower than that in the wild-type complex. Assuming heme c1 reduction is a pseudo first-order reaction, the k1 values are determined to be 11.6, 1.7, and 1.4 s-1 for the wild-type and mutant complexes of H198N and H111N, respectively. The heme c1 reduction rates in the H198N and H111N mutant complexes are only about 15-12% of that in the wild-type complex. Despite of low reduction rates of heme c1 in the two mutant complexes, maximum levels of heme c1 reduction are the same as that of the wild-type complex. 50% of the total heme c1 is reduced by ubiquinol as reported (53). Because the QP sites in the H198N and H111 mutant complexes are similar to that in the wild-type complex, as both mutant complexes are sensitive to stigmatellin and myxothiazol (the QP site inhibitor), the decrease in rate of heme c1 reduction is not due to the initial bifurcated oxidation of quinol. Likely, this decrease results from impairment of movement of the head domain of reduced ISP, from the b-position to c1-position, caused by disruption of electron transfer from heme bL to heme bH in these mutant complexes.
FIGURE 4.

Time trace of heme c1 reduction by Q0C10BrH2 in wild-type (WT) and mutant complexes. Experiments were performed with the Applied Photophysics stopped-flow reaction analyzer SX 18MV. Reactions and measurements were performed as described under “Experimental Procedures.” The final concentrations of complexes and Q0C10BrH2 were 6 and 120 μm, respectively. Solid lines represent fitted curves.
Fig. 5 shows the effect of antimycin A and stigmatellin on the reduction rates of heme c1 in the wild-type and mutant complexes. Antimycin A is a QN site inhibitor and stigmatellin is a QP site inhibitor. In the wild-type complex antimycin A decreases heme c1 reduction pseudo first-order rate constant from 11.6 to 4.7 s-1 (Fig. 5A). This is consistent with the previous report (14) that antimycin A has a significant effect on the reduction rate of heme c1 in cytochrome bc1 complexes. In the H198N mutant complex, the rate constant decreases from 1.7 to 1.1 s-1. In the H111N mutant complex, the rate constant decreases from 1.4 to 1.0 s-1. Because both mutant complexes, in which no intact low potential chain is available, also show a decreased rate of heme c1 reduction in the presence of antimycin A, similar to that observed in the wild-type complex, this inhibitor effect cannot be due to blocking of electron transfer in the low potential chain. It is probably due to the long range effect of antimycin on the Qp site binding to the QN site. In other words, the effect of antimycin A on the heme c1 reduction rate is not through the low potential redox component but through the cytochrome b protein subunit.
FIGURE 5.

Time trace of cytochrome c1 reduction by Q0C10BrH2 in the wild-type (A) and mutants H198N (B) and H111N (C) complexes in the presence of inhibitors. Experimental conditions were the same as that in Fig. 4 except for the presence of inhibitors. Solid lines represent fitted curves.
Addition of stigmatellin to the wild-type and mutant complexes abolishes heme c1 reduction. These results further confirm that the QP site in these two mutant complexes is functional.
Effect of Mutations on the Rates of Heme bL and Heme bH Reductions by Quinol—Fig. 6 shows hemes b reduction by quinol, in the presence and absence of antimycin and stigmatellin, in wild-type and mutant bc1 complexes. In the H198N mutant complex (Fig. 6B), a small portion of heme bH is reduced by quinol, in the absence of inhibitors, and the reduction is biphasic. The rate constants for the fast and slow reduction phases are 12.4 and 0.86 s-1, respectively. Fast phase reduction is abolished when antimycin is present. As expected, the presence of stigmatellin has little effect because heme bH is reduced by quinol through the QN site, not the QP site.
FIGURE 6.

Time trace of cytochrome b reduction by Q0C10BrH2 in wild-type (A) and H198N (B) and H111N (C) mutant complexes. Reactions and measurements were performed as described under “Experimental Procedures.” The reaction was monitored by photodiode array scanning for 1.26 s. Reductions of cytochromes bL and bH, were determined from the increase in A565-580 and A560-580. Cytochrome b (including bL and bH) was determined from the increase in A560-580.
In the H111N mutant complex (Fig. 6C), a small portion of heme bL is rapidly reduced by quinol, in the absence of inhibitors, with a reduction rate constant of about 16.3 s-1, followed by a slow reoxidation. It is likely that the reoxidation of heme bL will lead to superoxide formation. The slower decay rate of superoxide formed in the H111N complex as compared with that formed in the H198N complex, as will be described in Fig. 8, B and C, supports this speculation. Addition of stigmatellin abolishes this reduction. Addition of antimycin affects the rate and extent of heme bL reduction: the rate constant decreases from 16.3 to 11.1 s-1 and the extent of bL reduction decreases by 30%. In the wild-type complex antimycin also affects both the rate and extent of heme b reduction by quinol (see Fig. 6A): it decreases the rate but increases the extent (14, 54-58). It should be noted that heme b reduction observed in the wild-type complex, in the absence of inhibitor, is mostly heme bH. The input of electron for reduction could come from the Qp site via heme bL, and less likely, directly from quinol at the QN site, because the reduction rate of heme bL (k1 = 16.3 s-1) is larger than that of heme bH (k1 = 12.4 s-1) (Fig. 6, B and C). These results seem contradictory to a report indicating that the rate of heme bH reduction is larger than that of heme bL in the yeast cytochrome bc1 complex (59). The observation that the reduction rate of heme bL in the H111N mutant complex is similar to, albeit higher than, that of the wild-type complex (see Fig. 6A) indicates that the QP site in this mutant complex is functional. This finding further supports the idea that antimycin has a long range effect on the Qp site to decrease the rates of heme c1 and heme bL reduction.
FIGURE 8.

Superoxide production of wild-type and mutant H198N and H111N cytochrome bc1 complexes. Superoxide production was measured as described under “Experimental Procedures.” Red tracings represent complexes without any treatment. Blue and black tracings are for complexes with antimycin, and ascorbate treatment, respectively.
Attempt to Detect Q Radical at the QP Site with Mutant H198N—Because H198N has no heme bL, and thus no electron acceptor for semiquinone, more semiquinone radical would have increased if the sequential mechanism for bifurcated quinol oxidation is functioning. Fig. 7 shows EPR spectra from wild-type and mutant bc1 complexes. In the absence of antimycin a strong signal at g = 2.00 is observed in the quinol-reduced cytochrome bc1 complexes from wild-type (Fig. 7A, curve 1) and mutant H198N (Fig. 7B, curve 1). This signal decreases significantly when antimycin is added (Fig. 7, A and B, curve 2). Apparently the portion of signal that disappears (Fig. 7, A and B, curve 4) is the signal of semiquinone radical at the QN site. However, the signal portion that is insensitive to antimycin is not the long missing semiquinone at the QP site, because it is also present in fully oxidized complexes of wild-type and mutant H198N (Fig. 7, A and B, curve 3). It should be noted that this free radical, of unknown origin, is much more concentrated in the H198N complex than in the wild-type complex. Its origin is currently under investigation.
FIGURE 7.

EPR spectra of ISP and free radical (semiquinone) under different conditions. Purified wild-type (WT) (A), H198N (B), and H111N (C) bc1 complexes were treated with 10-fold excess of Q0C10BrH2 solution, to fully reduce cytochrome c1, and frozen in liquid nitrogen. EPR spectra were recorded at -170 °C with the following instrument settings: microwave frequency, 9.4 GHz; microwave power, 2.2 milliwatts; modulation amplitudes, 6.3 G; modulation frequency, 100 kHz; time constant, 655.4 ms; sweep time, 167.8 s; conversion time, 163.8 ms. Curve 1 is the spectrum for cytochrome bc1 complexes reduced by Q0C10BrH2; curve 2 for those reduced by Q0C10BrH2 in the presence of antimycin; curve 3 for ferricyanide-oxidized cytochrome bc1 complexes; curve 4 for the spectrum derived from curve 1 minus curve 2. The absence of signals of reduced ISP defines the fully oxidized state of the complex. For mutant H111N, the signal intensities were reduced to one-third to fit in the figure.
The EPR spectra for mutant H111N bc1 complex (Fig. 7C) were also determined. Oxidized H111N has an unusual EPR spectrum that is not due to contamination. This spectrum appears to be a characteristic of mutants lacking heme bH, because another heme bH-deficient mutant, H212N, has a similar EPR spectrum (data not shown). The concentrations of ISP in all three complexes were about the same, as indicated by the g = 1.89 signal. The g = 1.89 signal in Fig. 7C looks smaller because the intensity of the spectrum was reduced to one-third of the original to compare the signals in the g = 2.00 region, of the three complexes.
Superoxide Production in Mutant bc1 Complexes during Catalysis—Because there is no heme bL in the H198N and no heme bH in the H111N, it should be easier for oxygen to get electrons, from either semiquinone or the reduced heme bL, in these mutant complexes than in the wild-type. Fig. 8 shows superoxide production by mutant and wild-type complexes under different conditions. In the absence of antimycin (red tracings), production of superoxide anion by mutant complexes of H198N (Fig. 8B) and H111N (Fig. 8C) is much greater than by the wild-type (Fig. 8A). At the point of strongest chemiluminescence output, superoxide production by H198N and H111N is about 5 times that of the wild-type complex. Antimycin significantly increases superoxide production but slightly decreases its production rate in the wild-type complex (blue tracing in Fig. 8A). Antimycin has little effect on the superoxide production in mutants H198N and H111N (blue tracings in Fig. 8, B and C). This lack of effect of antimycin on superoxide production by H198N and H111N indicates that superoxide is produced at the QP site, not at the QN site. Thus during bc1 catalysis, oxygen can only get electrons from reduced heme bL or from semiquione at the QP site.
In bc1 complexes with fully reduced ISP and cytochrome
c1, no chemiluminescence
( ) is observed upon the
addition of quinol (black tracings in
Fig. 8), indicating that
superoxide production is dependent on ISP reduction by quinol. Therefore,
quinol at the QP site transfers its first electron to ISC; the
second electron, either transferred to heme bL or retained
as semiquinone, reacts with oxygen to produce superoxide. Because there is no
detectable semiquinone radical at the QP site, molecular oxygen may
share quinol electrons with ISP when heme bL is not
available. Normally reduced heme bL may leak its electron
to oxygen. This leakage increases when the low potential electron transfer
chain is blocked by antimycin. Because reduction of ISC is the first reaction
in both superoxide generation and cytochrome c reduction catalyzed by
bc1 complex, the similar activation energy
(60) for these reactions seems
reasonable, if the reduction of ISC is rate-limiting.
) is observed upon the
addition of quinol (black tracings in
Fig. 8), indicating that
superoxide production is dependent on ISP reduction by quinol. Therefore,
quinol at the QP site transfers its first electron to ISC; the
second electron, either transferred to heme bL or retained
as semiquinone, reacts with oxygen to produce superoxide. Because there is no
detectable semiquinone radical at the QP site, molecular oxygen may
share quinol electrons with ISP when heme bL is not
available. Normally reduced heme bL may leak its electron
to oxygen. This leakage increases when the low potential electron transfer
chain is blocked by antimycin. Because reduction of ISC is the first reaction
in both superoxide generation and cytochrome c reduction catalyzed by
bc1 complex, the similar activation energy
(60) for these reactions seems
reasonable, if the reduction of ISC is rate-limiting.
Acknowledgments
We thank Dr. Roger Koeppe for critical review of this manuscript.
This work was supported in part by National Institutes of Health Grant GM30721 (to C. A. Y.). This work was also supported by Oklahoma Agricultural Experiment Station Projects 1819 and 2372 from the Oklahoma State University. The costs of publication of this article were defrayed in part by the payment of page charges. This article must therefore be hereby marked “advertisement” in accordance with 18 U.S.C. Section 1734 solely to indicate this fact.
Footnotes
The abbreviations used are: ISP, iron-sulfur protein; Q0C10BrH2, 2,3-dimethoxy-5-methyl-6-(10-bromodecyl)-1,4-benzoquinol; DM, n-dodecyl-β-d-maltopyranoside; MCLA, 2-methyl-6-(4-methoxyphenyl)-3,7-dihydroimidazol[1,2-α]pyrazin-3-one, hydrochloride; EPR, electron paramagnetic resonance; ISC, iron-sulfur cluster; ICM, intra-cytoplasmic membrane; Pm, QP site inhibitors that enhance the mobility of head domain of iron-sulfur protein; Pf, QP site inhibitors that fix the head domain of iron-sulfur protein at b-position.
References
- 1.Trumpower, B. L., and Gennis, R. B. (1994) Annu. Rev. Biochem. 63 675-716 [DOI] [PubMed] [Google Scholar]
- 2.Erecinska, M., Chance, B., Wilson, D. F., and Dutton, P. L. (1972) Proc. Natl. Acad. Sci. U. S. A. 69 50-54 [DOI] [PMC free article] [PubMed] [Google Scholar]
- 3.Wikstrom, M. K. F., and Berden, J. A. (1972) Biochim. Biophys. Acta 283 403-420 [DOI] [PubMed] [Google Scholar]
- 4.Alexandre, A., and Lehninger, A. L. (1979) J. Biol. Chem. 254 11555-11560 [PubMed] [Google Scholar]
- 5.Mitchell, P. (1976) J. Theor. Biol. 62 327-367 [DOI] [PubMed] [Google Scholar]
- 6.Brandt, U., and Trumpower, B. (1994) Crit. Rev. Biochem. Mol. Biol. 29 165-197 [DOI] [PubMed] [Google Scholar]
- 7.Crofts, A. R. (2004) Annu. Rev. Physiol. 66 689-733 [DOI] [PubMed] [Google Scholar]
- 8.Link, T. A. (1997) FEBS Lett. 412 257. [DOI] [PubMed] [Google Scholar]
- 9.Junemann, S., Heathcote, P., and Rich, P. R. (1998) J. Biol. Chem. 273 21603-21607 [DOI] [PubMed] [Google Scholar]
- 10.Zhang, H., Osyczka, A., Dutton, P. L., and Moser, C. C. (2007) Biochim. Biophys. Acta 1767 883-887 [DOI] [PMC free article] [PubMed] [Google Scholar]
- 11.De Vries, S., Albracht, S. P., Berden, J. A., and Slater, E. C. (1981) J. Biol. Chem. 256 11996-11998 [PubMed] [Google Scholar]
- 12.Cape, J. L., Bowman, M. K., and Kramer, D. M. (2007) Proc. Natl. Acad. Sci. U. S. A. 104 7887-7892 [DOI] [PMC free article] [PubMed] [Google Scholar]
- 13.Zhu, J., Egawa, T., Yeh, S.-R., Yu, L., and Yu, C.-A. (2007) Proc. Natl. Acad. Sci. U. S. A. 104 4864-4869 [DOI] [PMC free article] [PubMed] [Google Scholar]
- 14.Snyder, C. H., Gutierrez-Cirlos, E. B., and Trumpower, B. L. (2000) J. Biol. Chem. 275 13535-13541 [DOI] [PubMed] [Google Scholar]
- 15.Crofts, A. R., Holland, J. T., Victoria, D., Kolling, D. R. J., Dikanov, S. A., Gilbreth, R., Lhee, S., Kuras, R., and Kuras, M. G. (2008) Biochim. Biophys. Acta 1777 1001-1019 [DOI] [PMC free article] [PubMed] [Google Scholar]
- 16.Xia, D., Yu, C.-A., Kim, H., Xia, J.-Z., Kachurin, A. M., Zhang, L., Yu, L., and Deisenhofer, J. (1997) Science 277 60-66 [DOI] [PubMed] [Google Scholar]
- 17.Zhang, Z., Huang, L., Shulmeister, V. M., Chi, Y.-I., Kim, K. K., Hung, L.-W., Crofts, A. R., Berry, E. A., and Kim, S.-H. (1998) Nature 392 677-684 [DOI] [PubMed] [Google Scholar]
- 18.Iwata, S., Lee, J. W., Okada, K., Lee, J. K., Iwata, M., Rasmussen, B., Link, T. A., Ramaswamy, S., and Jap, B. K. (1998) Science 281 64-71 [DOI] [PubMed] [Google Scholar]
- 19.Hunte, C. (2001) FEBS Lett. 504 126-132 [DOI] [PubMed] [Google Scholar]
- 20.Lange, C., and Hunte, C. (2002) Proc. Natl. Acad. Sci. U. S. A. 99 2800-2805 [DOI] [PMC free article] [PubMed] [Google Scholar]
- 21.Tian, H., Yu, L., Mather, M. W., and Yu, C.-A. (1998) J. Biol. Chem. 273 27953-27959 [DOI] [PubMed] [Google Scholar]
- 22.Kim, H., Xia, D., Yu, C.-A., Xia, J.-Z., Kachurin, A. M., Zhang, L., Yu, L., and Deisenhofer, J. (1998) Proc. Natl. Acad. Sci. U. S. A. 95 8026-8033 [DOI] [PMC free article] [PubMed] [Google Scholar]
- 23.Tian, H., White, S., Yu, L., and Yu, C.-A. (1999) J. Biol. Chem. 274 7146-7152 [DOI] [PubMed] [Google Scholar]
- 24.Xiao, K., Yu, L., and Yu, C.-A. (2000) J. Biol. Chem. 275 38597-38604 [DOI] [PubMed] [Google Scholar]
- 25.Darrouzet, E., Valkova-Valchanova, M., and Daldal, F. (2000) Biochemistry 39 15475-15483 [DOI] [PubMed] [Google Scholar]
- 26.Darrouzet, E., Valkova-Valchanova, M., Moser, C. C., Dutton, P. L., and Daldal, F. (2000) Proc. Natl. Acad. Sci. U. S. A. 97 4567-4572 [DOI] [PMC free article] [PubMed] [Google Scholar]
- 27.Darrouzet, E., and Daldal, F. (2002) J. Biol. Chem. 277 3471-3476 [DOI] [PubMed] [Google Scholar]
- 28.Brandt, U., and von Jagow, G. (1991) Eur. J. Biochem. 195 163-170 [DOI] [PubMed] [Google Scholar]
- 29.Crofts, A. R., Hong, S., Zhang, Z., and Berry, E. A. (1999) Biochemistry 38 15827-15839 [DOI] [PubMed] [Google Scholar]
- 30.Xia, D., Esser, L., Yu, L., and Yu, C.-A. (2007) Photosynth. Res. 92 17-34 [DOI] [PubMed] [Google Scholar]
- 31.Brandt, U., Haase, U., Schagger, H., and von Jagow, G. (1991) J. Biol. Chem. 266 19958-19964 [PubMed] [Google Scholar]
- 32.Cen, X., Yu, L., and Yu, C.-A. (2008) FEBS Lett. 582 523-526 [DOI] [PubMed] [Google Scholar]
- 33.Yu, C.-A., Cen, X., Ma, H.-W., Yin, Y., Yu, L., Esser, L., and Xia, D. (2008) Biochim. Biophys. Acta 1777 1038-1043 [DOI] [PubMed] [Google Scholar]
- 34.Muller, F., Crofts, A. R., and Kramer, D. M. (2002) Biochemistry 41 7866-7874 [DOI] [PubMed] [Google Scholar]
- 35.Zhang, L., Yu, L., and Yu, C.-A. (1998) J. Biol. Chem. 273 33972-33976 [DOI] [PubMed] [Google Scholar]
- 36.Sun, J., and Trumpower, B. L. (2003) Arch. Biochem. Biophys. 419 198-206 [DOI] [PubMed] [Google Scholar]
- 37.Turrens, J. F., Alexandre, A., and Lehninger, A. L. (1985) Arch. Biochem. Biophys. 237 408-414 [DOI] [PubMed] [Google Scholar]
- 38.Nohl, H., and Jordan, W. (1986) Biochem. Biophys. Res. Commun. 138 533-539 [DOI] [PubMed] [Google Scholar]
- 39.Yu, C. A., and Yu, L. (1982) Biochemistry 21 4096-4101 [DOI] [PubMed] [Google Scholar]
- 40.Xiao, K., Liu, X., Yu, C.-A., and Yu, L. (2004) Biochemistry 43 1488-1495 [DOI] [PubMed] [Google Scholar]
- 41.Mather, M. W., Yu, L., and Yu, C.-A. (1995) J. Biol. Chem. 270 28668-28675 [DOI] [PubMed] [Google Scholar]
- 42.Berry, E. A., and Trumpower, B. L. (1987) Anal. Biochem. 161 1-15 [DOI] [PubMed] [Google Scholar]
- 43.Dutton, P. L. (1978) Methods Enzymol. 54 411-435 [DOI] [PubMed] [Google Scholar]
- 44.Liu, X., Yu, C.-A., and Yu, L. (2004) J. Biol. Chem. 279 47363-47371 [DOI] [PubMed] [Google Scholar]
- 45.Nakano, M. (1990) Methods Enzymol. 186 585-591 [DOI] [PubMed] [Google Scholar]
- 46.Denicola, A., Souza, J., Gatti, R. M., Augusto, O., and Radi, R. (1995) Free Radic. Biol. Med. 19 11-19 [DOI] [PubMed] [Google Scholar]
- 47.Gong, X., Yu, L., Xia, D., and Yu, C.-A. (2005) J. Biol. Chem. 280 9251-9257 [DOI] [PubMed] [Google Scholar]
- 48.Yun, C. H., Crofts, A. R., and Gennis, R. B. (1991) Biochemistry 30 6747-6754 [DOI] [PubMed] [Google Scholar]
- 49.Yu, L., Mei, Q. C., and Yu, C. A. (1984) J. Biol. Chem. 259 5752-5760 [PubMed] [Google Scholar]
- 50.Yu, C.-A., and Yu, L. (1980) Biochim. Biophys. Acta 591 409-420 [DOI] [PubMed] [Google Scholar]
- 51.Elberry, M., Xiao, K., Esser, L., Xia, D., Yu, L., and Yu, C.-A. (2006) Biochim. Biophys. Acta 1757 835-840 [DOI] [PubMed] [Google Scholar]
- 52.Esser, L., Elberry, M., Zhou, F., Yu, C.-A., Yu, L., and Xia, D. (2008) J. Biol. Chem. 283 2846-2857 [DOI] [PubMed] [Google Scholar]
- 53.Covian, R., Gutierrez-Cirlos, E. B., and Trumpower, B. L. (2004) J. Biol. Chem. 279 15040-15049 [DOI] [PubMed] [Google Scholar]
- 54.King, T. E., Yu, C. A., Yu, L., and Chiang, Y. L. (1975) in Electron Transfer Chains and Oxidative Phosphorylation (Van Dam, K., and Van Gelder, B. F., eds) pp. 105-118, North-Holland Publishing Co., Amsterdam, Oxford, American Elsevier Publishing Co., Inc., New York
- 55.De Vries, S., Albracht, S. P. J., Berden, J. A., and Slater, E. C. (1982) Biochim. Biophys. Acta 681 41-53 [DOI] [PubMed] [Google Scholar]
- 56.De Vries, S., Albracht, S. P. J., Berden, J. A., Marres, C. A. M., and Slater, E. C. (1983) Biochim. Biophys. Acta 723 91-103 [DOI] [PubMed] [Google Scholar]
- 57.Snyder, C. H., and Trumpower, B. L. (1999) J. Biol. Chem. 274 31209-31216 [DOI] [PubMed] [Google Scholar]
- 58.Crofts, A. R., Shinkarev, V. P., Kolling, D. R. J., and Hong, S. (2003) J. Biol. Chem. 278 36191-36201 [DOI] [PubMed] [Google Scholar]
- 59.Rotsaert, F. A. J., Ding, M. G., and Trumpower, B. L. (2008) Biochim. Biophys. Acta 1777 211-219 [DOI] [PMC free article] [PubMed] [Google Scholar]
- 60.Forquer, I., Covian, R., Bowman, M. K., Trumpower, B. L., and Kramer, D. M. (2006) J. Biol. Chem. 281 38459-38465 [DOI] [PubMed] [Google Scholar]