

Abstract
A simple, chip-based implementation of a double-beam interferometer that can separate biomolecules based on size and that can compensate for changes in matrix composition is introduced. The interferometric biosensor uses a double-layer of porous Si comprised of a top layer with large pores and a bottom layer with smaller pores. The structure is shown to provide an on-chip reference channel analogous to a double-beam spectrometer, but where the reference and sample compartments are stacked one on top of the other. The reflectivity spectrum of this structure displays a complicated interference spectrum whose individual components can be resolved by fitting of the reflectivity data to a simple interference model or by fast Fourier transform (FFT). Shifts of the FFT peaks indicate biomolecule penetration into the different layers. The small molecule sucrose penetrates into both porous Si layers, whereas the large protein bovine serum albumin (BSA) only enters the large pores. BSA can be detected even in a large (100-fold by mass) excess of sucrose from the FFT spectrum. Detection can be accomplished either by computing the weighted difference in the frequencies of two peaks or by computing the ratio of the intensities of two peaks in the FFT spectrum.
Keywords: Label-free biosensor, photonic crystal, porous silicon
1.INTRODUCTION
Porous Si is an attractive material for label-free chemical and biomolecule sensing due to its high surface area,1 convenient surface chemistry,2 and optical signal transduction capability.3-9 Chemical or biomolecule detection can be based on changes in the spectral interference pattern that results from the reflection of white light at the interfaces above (air or solution) and below (crystalline Si) the porous Si layer. The spectral positions of the Fabry-Pérot fringes shift as a function of the refractive index of the material filling the pores.10 Biomolecule penetration into the pores of porous Si layers, driven either by nonspecific adsorption11-13 or by specific binding (to an antibody, for instance)4,7 is observed as a shift of the Fabry-Pérot fringes to longer wavelengths. This corresponds to an increase in refractive index of the film as protein displaces aqueous solution in the pores.
In order to design an optical interferometric biosensor from porous Si, the pore size must be adjusted by appropriate choice of electrochemical etching conditions. The pores have to be large enough to allow the biomolecule of interest to enter but small enough to avoid light scattering effects. These requirements can be met with the well-established methods for porous Si fabrication involving anodic dissolution of single crystalline Si in HF-containing solutions. Depending on several parameters such as Si wafer dopant type and resistivity, current density, and electrolyte composition, a wie range of pore sizes and morphologies can be obtained.14,15 In addition, the pore diameters can be systematically varied in either horizontal or vertical directions (relative to the wafer surface), leading to pore gradient11-13 and multilayer16-18 structures.
Unlike the single-layered Fabry-Pérot films, biosensors based on porous Si multilayers have utilized optical transduction methods other than wavelength shifts of the interference pattern. For example, Martin-Palma et al. detected binding of polyclonal mouse antibodies to an amine-modified porous Si multilayer by observing a reduction of the intensity of reflected light.19 Additionally, Chan et al. formed porous Si multilayer structures such as Bragg mirrors and microcavity resonators and used modulation of the photoluminescence spectra from these structures to distinguish between Gram(-) and Gram(+) bacteria.9 The advantage of using a more elaborate optical structure is that the sensitivity of the measurement can be improved and the equipment needed to monitor binding events can be simplified. Incorporating more sophisticated functions such as correction for drifts due to thermal fluctuation, changes in sample composition, or degradation of the sensor matrix should also be possible with careful design of the optical structure.
A porous Si film containing a controlled distribution of pore sizes provides an example of a structure that performs a reasonably sophisticated function—in the present case discrimination of biomolecules by size. Porous Si films with a distribution of pore diameters in the x-y plane (parallel to the surface of the wafer) have been demonstrated as size-exclusion matrices to perform an on-chip determination of macromolecule dimensions.11 These films are generated by electrochemically etching Si in aqueous ethanolic HF using an asymmetric electrode configuration. Biomolecules penetrate the film and are detected only in regions where the pores are large enough. The disadvantage of this approach is that determination of protein size requires optical sampling over a relatively large area of the porous Si film.
This work describes a porous Si biosensor in which size discrimination occurs in the z direction (perpendicular to the plane of the wafer surface). The biosensor is composed of a porous Si layer with big pores on top of a layer with smaller pores (Fig. 1). Light reflected from these porous Si double-layers contains three superimposed interference patterns (Fig. 1), which can be resolved by fast Fourier transform (FFT) of the reflectivity spectrum. The three peaks in the FFT provide an indication of the relative partitioning of the large and small molecules in the two layers of this size-selective membrane. The concept is demonstrated using bovine serum albumin (BSA) and sucrose as the large and small probe molecules, respectively. Penetration of BSA exclusively into the top (large pore) layer and of sucrose into both layers is detected by the optical method, allowing the detection of the larger BSA in the presence of a 100-fold (by mass) excess of sucrose. The work here demonstrates a simple and powerful means to discriminate and detect molecules based on size and to correct for drift in composition and other matrix effects with a designed nanostructure.
Figure 1.

Schematic of the porous Si double-layer biosensor consisting of a top layer with large pores and a bottom layer with smaller pores. The three different interfering light beams are shown. Interference of beams a and b occurs from reflections at the interfaces bordering layer 1, interference of beams b and c originates from layer 2, and interference of beams a and c originates from layer 3. Analyte-containing solution is introduced at the top of the structure.
2. RESULTS AND DISCUSSION
2.1. Fabrication and Stabilization of p-Type Porous Si Double-Layers
Porous Si double-layers with a layer of larger pores on top of a layer with smaller pores can be prepared using an electrochemical etch consisting of a short period of high applied current followed by a longer period at low current. In the present study, the current density profile consisted of 11 s at 500 mA/cm2 followed by 55 s at 167 mA/cm2. This waveform was applied to a highly doped (10-3 Ω-cm) p-type (100)-oriented single crystal Si wafer in ethanolic HF solution. For comparison, the individual single-layer structures were also prepared. “Single-layer 1” was prepared using the first part of the double-layer waveform (11 s at 500 mA/cm2), and “single-layer 2” was prepared using the second part of the double-layer waveform (55 s at 167 mA/cm2). The resulting freshly etched porous Si samples are hydride-terminated and slowly degrade in air or water by oxidative or hydrolytic corrosion. In order to prevent corrosion in the aqueous solutions used in this study, siloxy- terminated porous Si surfaces were prepared by thermal oxidation.20,21 Oxidation increases the hydrophilicity of porous Si, allowing water to effectively infiltrate the pores.
2.2. Determination of Porosity and Thickness of Porous Si Layers
The porosities and thicknesses of the individual porous Si layers were independently determined by gravimetry, SEM (thickness only) and by optical measurements. The average values obtained from at least three measurements are summarized in Table 1. Gravimetric measurements were performed by weighing the sample before etch, after etch, and after chemical dissolution of the porous layer, as previously described.22 Cross-sectional scanning electron microscopy (SEM) reveals that the conditions used to prepare “single-layer 1” (11 s at 500 mA/cm2) produce a ∼2600 nm-thick porous Si film with cylindrical pores possessing diameters of ∼50 to 100 nm (Fig. 2A). The conditions used to prepare “single-layer 2” (55 s at 167 mA/cm2) produce a film of ∼5400 nm in thickness (Fig. 2B). The pores in this layer are smaller, with diameters that are too small to be reliably resolved in the SEM images (< 20 nm). These results are in accordance with earlier work, in which an approximately exponential dependence of the pore diameter on the current density was found for highly-doped p-type samples.4 The porous Si double-layer, produced by applying the “single-layer 1” etching conditions followed immediately by the “single-layer 2” conditions, possesses a combination of the two single layers one on top of the other. The SEM image (Fig. 2C) displays the macro/mesoporous structure, with layer thicknesses of ∼2900 nm and ∼5600 nm for layers 1 and 2, respectively.
Table 1.
Porosity and Thickness of Thermally Oxidized Porous Si Layers[a]
| Gravimetry | Spectral Measurement[b] | SEM | |||
|---|---|---|---|---|---|
| Porous Si Layer |
porosity (%) | thickness (nm) | porosity (%) | thickness (nm) | thickness (nm) |
| single-layer 1 | 81 ± 1 | 2540 ± 40 | 85 ± 4 | 2890 ± 150 | 2570 ± 410 |
| single-layer 2 | 64 ± 5 | 4440 ± 260 | 66 ± 4 | 5380 ± 160 | 5460 ± 210 |
| double-layer: | |||||
| layer 1 (top) | 88 ± 4 | 3010 ± 190 | 2940 ± 180 | ||
| layer 2 (bottom) | 63 ± 2 | 5310 ± 140 | 5640 ± 120 | ||
| combination | 71 ± 1[c] | 7170 ± 450[c] | 72 ± 2 | 8300 ± 300 | 8680 ± 120 |
Porosities and thicknesses of porous Si single- and double-layers as determined by gravimetry, by spectral measurement, and by SEM. “Single-layer 1” was etched at 500 mA/cm2 for 11 s, “single-layer 2” at 167 mA/cm2 for 55 s, and “double-layer” at 500 mA/cm2 for 11 s followed by 167 mA/cm2 for 55 s. All samples have been thermally oxidized in air at 600 °C.
For the spectral measurement, calculation of porosity and thickness of “single-layer 1,” “single-layer 2,” and the top (“layer 1”) and bottom (“layer 2”) layers of “doublelayer” is based on application of the Bruggeman approximation to the values of optical thickness (2nL) obtained from FFT of the reflectivity spectra of samples immersed in various liquids, as described in the text. Porosity and thickness of “layer 1” in the porous silicon double layers is calculated using a value of EOT determined from the difference in EOT between “combination” (layer 3 in Fig. 1) and “layer 2.”
Gravimetric measurements do not distinguish between the two layers of the porous Si double-layers, and provide an average value of porosity and thickness of both layers.
Figure 2.
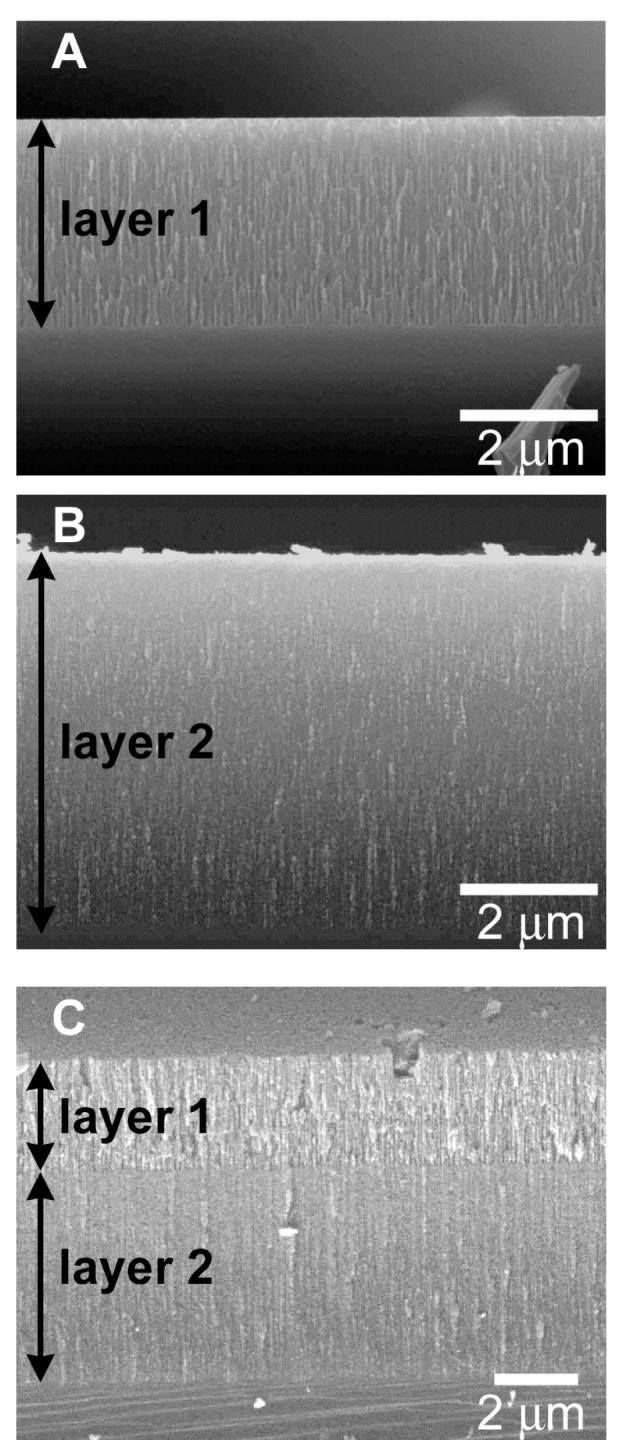
Cross-sectional scanning electron microscope (secondary electron) images of thermally oxidized porous Si single and double layers used in this study. (A) porous Si single-layer etched for 11 s at 500 mA/cm2, (B) porous Si single-layer etched for 55 s at 167 mA/cm2 and (C) porous Si double-layer etched for 11 s at 500 mA/cm2 and then for 55 s at 167 mA/cm2 to fabricate a large pore layer on top of a small pore layer. The electrolyte composition and the dopant concentration in the Si wafer are the same for all samples. Average values of layer thicknesses and porosities are given in Table 1
Thickness and porosity of the layers were also determined by optical measurements. The Bruggeman theory,23 one of a number of effective medium approximations,24,25 has been shown to predict the porosity of porous Si in reasonable agreement with gravimetric determinations.24,26 In order to obtain thickness and porosity values, the porous Si white-light reflection spectrum is measured with the film held in air and in the series of solvents ethanol, acetone, and hexane, having refractive indices 1.360, 1.357, and 1.375, respectively. The difference between the spectra can be attributed to the changes in optical thickness as the medium in the pores changes, with the assumption that all the void spaces in the film are filled equally (i.e., no remaining air bubbles). The value of the product 2nL, where n and L are the refractive index and the thickness of the film, respectively, are obtained from the reflectivity spectra as outlined in Sec. 2.3, below. For the Bruggeman calculation, only the product nL is used. Data obtained from a given sample in air and in the three liquids are then fit to the two-component Bruggeman approximation,27 yielding an over-determined solution for both the porosity and the thickness of the sample. The value of refractive index for oxidized porous Si that provided the most self-consistent results in the Bruggeman fit was 2.1. The calculated porosities of the porous Si single-layers (Table 1) agree with the results obtained by gravimetry. However, the film thickness values obtained from the Bruggeman calculations and the SEM measurements deviate somewhat from the gravimetric results. The gravimetric measurements do not account for the increase in mass and in volume that occurs when the porous Si film is oxidized;28 rather, gravimetry measures the amount of Si lost in etching. Thus in the case of oxidized porous Si films, gravimetry provides an under-estimation of film thickness. The SEM and opticalmeasurements are more accurate measures of film thickness for the oxidized films used in this study.
2.3. Interpretation of Interferometric Reflectance Spectra
Figure 3 displays reflectivity spectra of thermally oxidized porous Si single- and double-layers. The spectra, obtained using a spectrometer and a white light (tungsten) illumination source in a 90° backscatter configuration, display a series of interference fringes. These fringe patterns result from Fabry-Pérot interference of light reflected from the various interfaces present in the structures.10 The fringe maxima are described by the Fabry-Pérot relationship given in eq. 1
| (1) |
where m is an integer, L is the thickness of the porous Si layer, n is the average refractive index, and λ is the wavelength of incident light. The factor of 2 derives from the 90° backscatter configuration of the illumination source and detector. The term 2nL is thus the optical path, referred to as the effective optical thickness (EOT) in this work. The pore dimensions in these structures are too small to effectively scatter light, and each porous layer is treated as a single medium with a single refractive index value.
Figure 3.

Relative reflectance spectra of thermally oxidized porous Si single- and double-layers. “single-layer 1” is the spectrum of a single layer represented by Fig. 2A, etched for 11 s at 500 mA/cm2, “single-layer 2” corresponds to the single layer shown in Fig. 2B, etched for 55 s at 167 mA/cm2, and “double-layer” corresponds to the double-layer sample shown in Fig. 2C, etched for 11 s at 500 mA/cm2, followed by 55 s at 167 mA/cm2. “Fit” shows a least-squares fit of the double-layer spectrum to a two-layer interference model (eq. 2) as described in the text. The peaks from the fit matching the interference model (eq. 2) as described in the text. The peaks from the fit matching the spectral peaks are indicated with the vertical dashed lines. All spectra were obtained from a spot ∼1 mm in diameter on the porous Si film. Spectra of samples were measured in air and are not corrected for instrumental spectral response.
As expected from the relationship of eq. 1, the series of Fabry-Pérot fringes observed in the “single-layer 1” and the “single-layer 2” samples are spaced evenly in frequency (Fig. 3). A plot of m vs 1/λmax, where λ max is the wavelength of each peak maximum and m is an integer numbering each successive peak (increasing from long wavelength to short) yields a straight line, whose slope is equal to the quantity 2nL (Table 2, “Fit to interference equations”). The double-layer film displays a more complex fringe pattern that cannot be fit to eq. 1. The spectrum arises from interference in all three layers represented in Fig. 1, and can be fit to a double layer interference model adapted from the treatment of McLeod.29 Ignoring multiple reflections, the reflectance R of light from a double layer is given by:
| (2) |
where δi represents the phase relationship of layer i:
| (3) |
Here ni represents the refractive index of layer i with thickness Li. The terms ρa,ρb and ρc in eq. 2 represent the index contrast at each of the interfaces a, b, or c (see Fig. 1):
| (4) |
Where nair, n1, n2, and nSi represent the refractive index of air (or of the solution), layer 1, layer 2, and bulk Si, respectively. The quantities n1 and n2 represent the total refractive index of the layer and everything it contains (silicon, SiO2, solution, air, biomolecule, etc.). A least-squares fit of the reflectivity spectrum of the double layer to eq. 2 is shown in Fig. 3. The spectra shown in Fig. 3 are not corrected for the spectral response of the lamp or spectrometer, and the values ρa, ρb, and ρc cannot be accurately evaluated from such data. Thus the absolute intensity of the spectrum is not fit by the model. However, the phase relationship δi can be reliably extracted, yielding values of 2nL for layer 1 and for layer 2 of 6200 nm and 13,800 nm, respectively (Table 2, “Fit to interference equations”). These values somewhat under-estimate the single-layer values determined from eq. 1 discussed above. Although the models used to fit the data are quite simplified, they provide a consistent picture of the optical properties of these structures.
Table 2.
Comparison of methods used to evaluate EOT (2nL) from the reflectivity spectrum: Fabry-Pérot interference calculation vs FFT.[a]
| Porous Si Layer | Fit to Interference Equations (nm)[b] |
FFT (nm) |
|---|---|---|
| single-layer 1 | 7220 | 6950 |
| single-layer 2 | 14,400 | 14,400 |
| double-layer: | ||
| layer 1 (top) | 6200 | 6250 |
| layer 2 (bottom) | 13,800 | 13,900 |
| combination | 19,800 | 20,100 |
2.4. Fast Fourier Transform (FFT) of Reflectance Spectra
Although a model incorporating the frequency dispersion of refractive index, the effect of multiple reflections, and the instrumental response function would provide a more rigorous description of the optical properties of the porous Si films, a faster and more convenient method of extracting the optical parameters is based on a fast Fourier transform (FFT) of the spectrum. The FFT can provide more reliable data for complicated optical structures, in particular when the optical constants are changing due to analyte admission into the pores. For the sensing application it will be seen that the relative change in these optical constants is the important parameter.
The Fourier transforms of the optical interference spectra of Fig. 3 are presented in Fig. 4. The value of 2nL can be obtained directly as the position of the peak in the FFT.26 Thus the “single-layer 1” film in air displays a spectral interference pattern (Fig. 3) whose FFT yields a peak at 6950 nm (Fig. 4 and Table 2). As mentioned above, the position of this peak in the FFT is equal to the value 2nL from eq. 1. Similarly, the “single-layer 2” film displays a spectral interference pattern whose FFT yields a peak at 14,400 nm. If more than one layer exists in the film, the FFT yields values of 2nL for the separate layers as distinct peaks. Thus the interference spectrum for the double-layer (Fig. 3, “double-layer”) has an FFT that displays 3 peaks (Fig. 4, “double-layer”) at 6250, 13,900, and 20,100 nm, corresponding to the values of 2nL for layers 1, 2, and 3, respectively, as depicted in Fig. 1. Note that the sum of the values of 2nL for layer 1 and 2 is predicted by eq. 2 to be equal to the value of 2nL for layer 3, and there is agreement within the error of the measurement (20,150 nm vs 20,100 nm, respectively). As with the least-squares fits of the spectra to eqs. 1 and 2, the FFT analysis yields a 2nL value for each individual layer of the double-layer that is smaller than the value obtained from the corresponding single-layer, consistent with the SEM measurements (Table 1).
Figure 4.

Fourier transforms of thermally oxidized p-type porous Si single- and double-layers in air and immersed in ethanol. “Single-layer 1” is the large pore layer, “Single-layer 2” is the small pore layer, and “double-layer” is the combination of both layers, prepared as in Fig. 3. The corresponding reflectivity spectra for the “in air” samples are shown in Fig. 3. The complex interference pattern for the double-layer is decomposed into its three components (layer 1, layer 2, and layer 1 + layer 2) by the Fourier transform. Peaks in the “in ethanol” spectra all display lower intensity relative to the corresponding “in air” spectra due to the decrease in refractive index contrast that occurs when the pores fill with liquid. All spectra were obtained from a spot ∼ 1 mm in diameter, and are offset along the y-axis for clarity.
The information contained in both the intensity and in the position of the peaks in the Fourier transform can be related to the optical constants presented in the double-layer interference model of eq. 2. As discussed above, the position of a peak in the FFT is equal to the EOT, or 2nL of a porous Si layer. It is related to the phase relationship of eq. 3 by:
| (5) |
Eq. 2 represents a sum of 3 cosine terms corresponding to the 3 optical layers represented in Fig. 1. The frequency of each of the cosine terms is thus related to the EOT of one of the layers. The amplitude of each cosine term is related to the amplitude of light reflected at the interfaces, and therefore related to the index contrast at each pair of interfaces that defines the relevant layer, as given by eq. 4. The amplitude of a peak in the FFT spectrum is proportional to this index contrast:
| (6) |
where A1, A2 and A3 are the amplitudes of the FFT peaks corresponding to layer 1, 2, and 3 of Fig. 1, respectively, ρa, ρb, and ρc are as defined above for eq. 4, and k is a proportionality constant. The relationship of FFT peak amplitude to index contrast is only strictly valid if the spectrum from which the FFT derives is an absolute reflectivity spectrum (corrected for instrument response). In that case, k=2. In the present paper, uncorrected intensity-wavelength spectra are used. The FFT contains the necessary information to determine the optical constants of the films relevant for sensing; in particular the refractive index of the film. The position of a given peak is a function of the refractive index of the layer, and the amplitude responds to the refractive index contrast of the layer, relative to its neighboring layers. The relationships of eqs 5 and 6 provide the key to extracting a reference channel from the double-layer interferometers described in this work.
2.5. Changes in the Optical Parameters Due to Infiltration of Ethanol
Infiltration of a liquid into the porous structures leads to predictable changes in both the position and in the intensity of the peaks in the FFT spectrum. The intensity changes correspond to changes in the relative reflectivity of the various interfaces in the structure. As seen in Fig. 4, peaks in the FFT of spectra from the “in ethanol” samples all display lower intensity relative to the corresponding “in air” peaks. This is attributed to the decrease in refractive index contrast that occurs when the pores fill with liquid, as predicted by the relationships of eqs 4 and 6. Additionally, the peak corresponding to layer 1 of the double-layer, already weak in the “in air” spectrum, disappears completely in the “in ethanol” spectrum, indicating an almost complete disappearance of index contrast in that layer relative to the surrounding layers. The reduction in index contrast when a single-layer or double-layer film is immersed in liquid is also observed in the reflectivity spectrum, manifested as a decrease in fidelity of the Fabry-Pérot fringes.
The decrease in intensity of the FFT peaks that occurs when the sample is immersed in liquid is most noticeable for samples that have been extensively oxidized, where the refractive index of the solid component of the porous film is closer to pure SiO2 (n = 1.5) than to Si (n = 3.8). Ozone-oxidation is milder, producing less SiO2 in the film.7 For a given porosity, ozone-oxidized films have a larger refractive index than thermally oxidized films, and the peak corresponding to layer 1 is more discernable in the FFT when such samples are immersed in liquids. However, the ozone-oxidized films were found to be insufficiently stable in the aqueous solutions and so were not used in the present study.
Shifts in the position of the peaks in the FFT spectrum indicate a change in average refractive index (EOT or 2nL) of the film. Infiltration of ethanol into the pores leads to an increase in the value of EOT for either the single- or the double-layer films. The “single-layer 1” film displays a spectrum with a peak in the Fourier transform at 6950 nm in air, increasing to 9080 nm in ethanol. Similarly, the FFT peak from the “single-layer 2” film shifts from 14,400 nm to 17,000 nm when the film is placed in the liquid.
The peaks in the FFT spectrum of the double-layer also shift upon infiltration of ethanol, in line with the single-layer results. As mentioned above, the peak corresponding to layer 1 of the double-layer structure often becomes too weak to observe upon immersion in ethanol due to the loss in index contrast, but the peaks corresponding to layer 2 and to the combination of both layer 1 and layer 2 (“layer 3” in Fig. 1) are observable (Fig. 4). Since the combination represents a sum of layers 1 and 2 (eq. 2), the position of the peak corresponding to layer 1 can be calculated as the quantity (EOT3-EOT2). Using this relationship, the 2nL value for layer 1 shifts by 1780 nm, from 6250 nm in air to 8030 nm in ethanol, and for layer 2 the shift is 2600 nm, from 13,900 nm to 16,500 nm.
2.6. Sensing of Bovine Serum Albumin and Sucrose in Double Layers
The penetration of biomolecules into a porous Si Fabry-Pérot layer leads to an increase in EOT resulting from partial replacement of aqueous buffer by molecules with a larger index of refraction. The magnitude of the increase in EOT for a given dose of analyte is dependent on three factors: (a) the size of the analyte; (b) the degree to which the analyte increases the refractive index of the buffer solution; and (c) the affinity of the porous Si surface for the analyte. Bovine serum albumin (BSA) and sucrose were used to test the ability of the porous Si double-layer to discriminate biomolecules of different sizes (factor a). BSA is a heart-shaped protein with dimensions roughly of the order of 3 × 8 × 8 nm (at pH 4) and a molecular weight of 68 kDa.30 Sucrose is a small molecule with dimensions less than 2 × 2 × 2 nm, and a molecular weight of 342 g/mol. Because of the difference in pore dimensions between the two layers of the double-layer, both molecules are expected to be admitted into layer 1 and only sucrose is expected to enter into layer 2.
The second important factor in determining the change in EOT is the specific refractive index of the analyte (factor b). On an equal mass basis, most biomolecule solutions have similar refractive indices. In the case of the solutions used in the present study, the measured refractive index (Abbe refractometer, Bausch & Lomb, inc.) of a 1 mg/mL solution of BSA in pH 4 buffer is 1.3365, indistinguishable from that of pure buffer due to the relatively low concentration of protein. The measured refractive index of a 1 mg/mL solution of sucrose in pH 4 buffer is also 1.3365. Considering the error in the refractometer measurements of ± 0.00005 and applying the Bruggeman model to a film with the porosity and thickness of layer 1 used in the present study, the interference relationship of eq. 2 predicts a difference of less than ± 0.5 nm in the value of EOT for these two solutions. A buffer solution containing 50 times more sucrose (50 mg/mL, n = 1.3435) is predicted to display an increase in EOT of 38 nm relative to pure buffer, well above the system detection limits. At the concentration used in the present paper, BSA should be undetectable unless it has an affinity for the surface that concentrates it in the oxidized porous Si film. This is the third factor that can contribute to an increase in EOT (factor c). As described below, the increase in EOT observed with BSA is much larger than expected due to significant non-specific surface adsorption. In contrast, the increase observed with sucrose can be ascribed solely to its effect on the bulk refractive index of the solution in the pores.
Non-specific adsorption of proteins to silica surfaces is an extremely complex process that depends on pH, temperature, ionic strength, and solvent properties.31,32 The affinity of BSA for silica is well-established,33 and for the silica surfaces used in the present study the BSA interaction is particularly strong. In previous work, attachment of poly(ethylene glycol)34 or large biomolecules7 to the inner pore surfaces has been used to minimize non-specific adsorption to porous Si. In this work the surfactant Triton X-100 was added to the solutions in order to enhance diffusion of BSA out of the pores of thermally oxidized porous Si.4 It was found that the initial introduction of BSA to the oxidized porous Si film always resulted in a small amount of very strongly bound BSA that was not removed with subsequent rinsing steps, even in the presence of surfactant or by changing pH. Sucrose did not display any such enhanced binding, and subsequent doses of either sucrose or BSA could be removed from the film. Presumably the oxidized porous Si surface contains a subset of reactive sites that bind strongly to BSA. In order to saturate these reactive sites, all samples used in the biomolecule sensing experiments were pre-treated with a BSA solution and then rinsed with pH 7 buffer followed by pH 4 buffer prior to the introduction of analyte. After this “pre-treatment” which led to a new baseline, both sucrose and BSA were found to readily diffuse into and out of the pores and to provide reproducible sensing curves during the flow cell experiments.
Even after the pre-treatment described above, BSA displayed enhanced affinity (relative to sucrose) for the porous Si surface. However, this excess BSA could be removed by changing the pH of the solution. Aqueous buffer solutions of the test molecules were introduced to the porous Si films using a transparent flow-cell such that real-time reflectivity spectra could be obtained. The flow-cell was flushed with either pure pH 4 buffer or pure pH 7 buffer followed by pure pH 4 buffer in between samples. The purpose of the pH 7 rinse is to more efficiently remove the BSA molecule from the oxidized porous Si surface by changing the net charge on the molecule. The isoelectric point of BSA is 4.8, so at pH 4 it has a net positive charge while oxidized porous Si is negative, leading to strong non-specific binding.11,33 At pH 7 both BSA and oxidized porous Si are negatively charged, and electrostatic forces aid in expulsion of the protein from the pores.11
2.6.1 Shifts in FFT Peak Positions (EOT) on Exposure to BSA and Sucrose
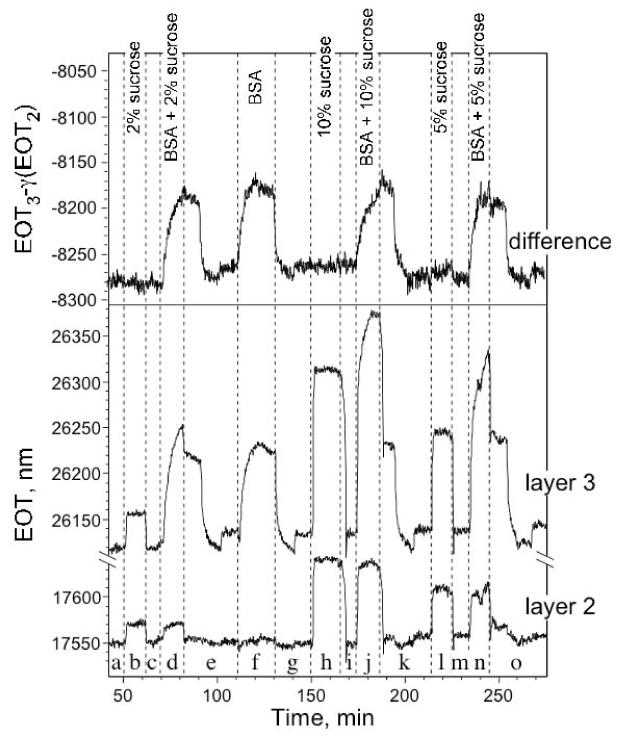
The response of the layers can be probed using the FFT methods outlined above. As described in sec. 2.3, the interference spectrum of a double-layer film displays a complicated pattern of maxima and minima that corresponds to a combination of the Fabry-Pérot interference spectra from the three layers defined in Fig. 1. The FFT decomposes the spectrum, and can distinguish between the filling of the big pores and the small pores. Figure 5 shows the shift of the two FFT peaks corresponding to layer 2 (the layer with small pores) and layer 3 (the combination of layer 1 and layer 2, see Fig. 1) versus time during a flow cell experiment. For the experiment described by Fig. 5, the sample was successively exposed to a buffer solution containing BSA with excess sucrose, sucrose alone, BSA alone, and then again BSA with sucrose.
Figure 5.

Effect of introduction of sucrose and bovine serum albumin (BSA), separately and in combination, on the effective optical thickness (EOT, or 2nL) of layers 2 and 3 of a thermally-oxidized double-layer sensor. EOT for a given layer is measured as the position of the corresponding peak in the FFT spectrum. Layer 2 contains the smaller pores, and does not respond to the larger BSA molecule. Layer 3 represents the combination of layer 1 and 2 (see Fig. 1) and so responds to both BSA and sucrose. The weighted (γ = 1.58) difference of the EOT values from the two films, shown as the top trace, eliminates the effect of sucrose, allowing selective detection of BSA. (a) pH 4 buffer (potassium biphthalate), (b) 1 mg/mL BSA and 50 mg/mL sucrose in pH 4 buffer, (c) pH 4 buffer, followed by pH 7 buffer, (d) pH 4 buffer, (e) 50 mg/mL sucrose in pH 4 buffer, (f) pH 4 buffer, (g) 1 mg/mL BSA in pH 4 buffer, (h) pH 4 buffer, followed by pH 7 buffer, (i) pH 4 buffer, (j) 1 mg/mL BSA and 50 mg/mL sucrose in pH 4 buffer, (k) pH 4 buffer, followed by pH 7 buffer, (l) pH 4 buffer. All data were acquired under a constant peristaltic flow of 0.5 mL/min in a flow cell. Sample had been pre-treated by exposure to BSA at pH 4 followed by a rinse with pure buffer at pH 7.
When the double-layer sample is exposed to a buffer solution containing 50 mg/mL of sucrose, the FFT peaks corresponding to layers 2 and 3 shift to larger values, corresponding to an increase in EOT as the solution infiltrates the pores (Fig. 5, region e). The position of the peak assigned to layer 2 increases by ∼50 nm, while the peak assigned to layer 3 shifts higher by ∼85 nm. The double-layer interference model of eq. 2 predicts that the 50 mg/mL sucrose solution should increase the EOT of layer 2 by 52 ± 2 nm and of layer 3 by 90 ± 2 nm (using the measured value of the refractive index of the solution, the thickness and porosity values given in Table 1, and applying the Bruggeman effective medium approximation). Thus the observed shifts agree with the mathematical model; sucrose solution is admitted into both regions of the film.
In contrast to sucrose, BSA only enters the layer with larger pores. When the double-layer sample is exposed to a buffer solution containing 1 mg/mL of BSA, the position of the peak assigned to layer 2 increases by <10 nm and the peak assigned to layer 3 (the combination of layers 1 and 2) increases by ∼100 nm (Fig. 5, region g). As mentioned above, the double-layer interference model of eq. 2 predicts that the 1 mg/mL BSA solution (n = 1.3365) should increase EOT of layer 1 (and thus layer 3) by less than 0.5 nm. The greater response that layer 3 displays towards BSA is ascribed to a non-specific binding interaction of the protein in layer 1 as discussed above.32 The data indicate that the concentration of BSA adsorbed to the surface of layer 1 is about 50-fold larger than the bulk solution concentration, and that BSA does not enter layer 2 to any significant extent.
Data obtained with buffer solutions containing both BSA and sucrose (Fig. 5, regions b and j) confirm the above conclusions that the small molecule sucrose can penetrate both layers 1 and 2 while the large protein BSA only enters layer 1. When the sample is exposed to solutions containing 1 mg/mL BSA and 50 mg/mL sucrose (Fig. 5, regions b and j), the EOT value of layer 2 increases by approximately the same amount (∼60 nm) as when only sucrose is added (∼50 nm; Fig. 5, region e). The EOT value of layer 3 increases by ∼170 nm, close to the sum of the BSA-only (∼100 nm; Fig. 5, region g) and sucrose-only (∼85 nm; Fig. 5, region g) values. These data show that the response to this combination of analytes is additive.
2.6.2 Detection of Biomolecules in Double-Layers by Differential EOT Measurement
The main difference in composition between layer 1 and layer 2 is that layer 1 contains the protein BSA and layer 2, because of its smaller pores, does not. In addition, because they have different porosities, the relative amount of SiO2 and solution are different in each layer. If this latter difference can be accounted for, then a means to measure the incorporation of protein in the film results. Incorporation of protein can be measured as the difference in index between layer 1 (n1) and layer 2 (n2). Since the total refractive index of a layer is related to its EOT by eq. 5, the difference can be expressed as:
| (7) |
Here the term γ is a weighting factor that accounts for the differences in porosity and thickness between the two layers. It assumes that the index of a layer is proportional to its fractional composition, which is not strictly valid if the Bruggeman effective medium approximation applies. However, for small changes in n as encountered in the present biosensing application it is approximately correct. If γ = 2 and L1 = L2, the left side of eq. 7 reduces to (n1-n2)L, as expected. The quantity γ indicates how the relative responses of the two layers scale with each other, and can be determined empirically from the sucrose data by application of eq. 8:
| (8) |
Where EOTi(sucrose) is the EOT measured for layer i infused with buffer containing sucrose, and EOTi(buffer) is the EOT measured for layer i infused with buffer only. For the data in Fig. 5, a value of 1.58 was determined for γ. A plot of the quantity (EOT3 — γEOT2) then detects BSA only, essentially nulling the response to sucrose (Fig. 5).
2.6.3 Dependence of Differential EOT Measurement on Concentration of Matrix Interferents
The effect of a changing sample matrix on the differential EOT measurement is shown in Fig. 6. In this experiment, a constant amount of BSA (1 mg/mL) is tested in the presence of sucrose concentrations varying from 0 to 100 mg/mL. The effective optical thickness (EOT, or 2nL) of layers 2 and 3 and the weighted difference of the two values are plotted as in Fig. 5. As with the sample of Fig. 5, the pores in layer 2 are too small to admit BSA, and this layer only responds to sucrose. Layer 3, consisting of both the large pore (layer 1) film and the small pore (layer 2) film, responds to both BSA and to sucrose. The weighted difference of the EOT values from the two films, shown as the top trace in Fig. 6, completely eliminates the response from sucrose at all concentrations, allowing selective detection of BSA. For this sample the value of γ was determined to be 1.96 (by application of eq. 8).
Figure 6.
Dependence of the EOT values of a thermally-oxidized double layer sensor towards BSA (1 mg/mL) in the presence of changing concentrations of sucrose. The weighted (γ = 1.96) difference of the EOT values from the two films, shown as the top trace, eliminates the effect of sucrose at all concentrations, allowing selective detection of BSA. The effective optical thickness (EOT, or 2nL) of layers 2 and 3 and the weighted difference of the two values are plotted as in Fig. 5. Layer 2 contains the smaller pores, and does not respond to the larger BSA molecule. Layer 3 represents layer 1 and 2 (see Fig. 1) and so responds to both BSA and to sucrose. (a) pH 4 buffer, (b) 20 mg/mL sucrose in pH 4 buffer, (c) pH 4 buffer, (d) 1 mg/mL BSA and 20 mg/mL sucrose in pH 4 buffer, (e) pH 4 buffer, followed by pH 7 buffer, then by pH 4 buffer, (f) 1 mg/mL BSA in pH 4 buffer, (g) pH 4 buffer, followed by pH 7 buffer, then by pH 4 buffer, (h) 100 mg/mL sucrose in pH 4 buffer, (i) pH 4 buffer (j) 1 mg/mL BSA and 100 mg/mL sucrose in pH 4 buffer, (k) pH 4 buffer, followed by pH 7 buffer, then pH 4 buffer, (l) 50 mg/mL sucrose in pH 4 buffer, (m) pH 4 buffer, (n) 1 mg/mL BSA and 50 mg/mL sucrose in pH 4 buffer, (o) pH 4 buffer, followed by pH 7 buffer, then pH 4 buffer. All data were acquired under a constant peristaltic flow of 0.5 mL/min in a flow cell. Sample had been pre-treated by exposure to BSA at pH 4 followed by a rinse with pure buffer at pH 7.
2.6.4 Detection of Biomolecules in Double-Layers by Measuring Shifts in FFT Peak Intensity
The amplitude of a peak Ai in the FFT spectrum is related to the reflectivity of the two interfaces bordering layer i by eq. 6. The reflectivity at a given interface is related to the index contrast by eq. 4. When protein infuses into either layer 1 or layer 2, it exerts an effect on the magnitude of Ai for both layers, since they share a common interface. Incorporation of protein can be measured as the ratio of peak amplitudes A1 to A2. This ratio is related to the index contrast at two of the three interfaces present in the double-layer (eq. 4 and 6) by eq. 9:
| (9) |
Here there is no weighting factor to account for differences in porosity and thickness between the two layers as was introduced in eq. 7. In the present case the data deriving from layer 1 is used instead of layer 3. In some instances the amplitude A1in the FFT spectrum can be too small to measure reliably, especially when using fully oxidized porous Si (where the index contrast of layer 1 is small relative to its neighboring layers). In such cases it is also possible to isolate the response to BSA by plotting the ratio A3/A2.
The amplitude of the FFT peaks corresponding to layer 1 and layer 2 of the double-layer (A1 and A2), and the ratio of A1 to A2 are presented in Fig. 7. The raw data sets from Fig. 6 were used. As can be seen, the plots of A1 and A2 vs time are very noisy. The noise in the measurement relates to fluctuations in lamp intensity, bubbles in the flow cell, cell temperature, and other undetermined experimental variables during the course of the measurement. By contrast the measurement of EOT (FFT peak position) is much less sensitive to such variations. The errors apparent in the plots of A1and A2 are correlated, and they are effectively eliminated in the ratio of A1 to A2, as shown in Fig. 7. The quantity A2 represents the product of the index contrast at both the bulk Si/layer 2 interface and the layer 1/layer 2 interface. It does not change significantly with either a large dose of sucrose or with BSA. The quantity A1 represents the product of the index contrast at both the layer 1/layer 2 interface and the bulk solution/layer 2 interface, and it tracks the admission of protein into layer 1. Although A2 appears to contain no information, it tracks lamp fluctuations, bubbles, and other sources of experimental error that also appear in A1. In particular, note point k in the traces of Fig. 7, the stage at which the largest dose of sucrose/BSA is removed; the relative reflectivity of the interfaces changes dramatically, but the ratio A1/A2 successfully nulls the effect.
Figure 7.
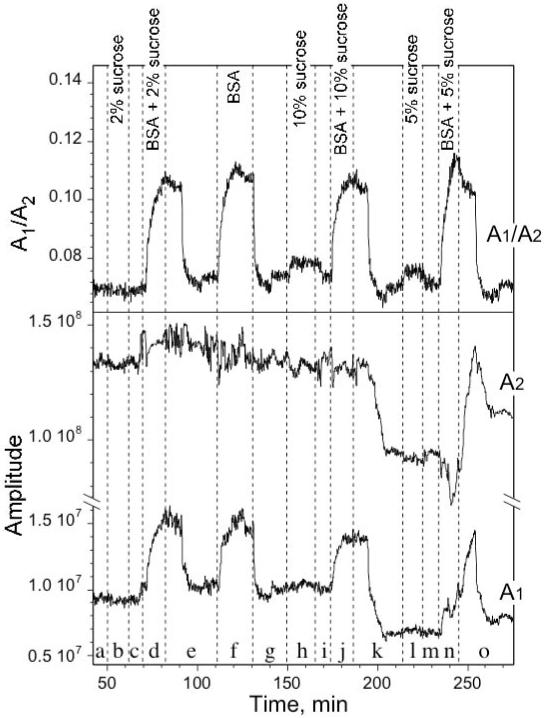
Dependence of the amplitude of the FFT peaks from the double layer sensor towards BSA (1 mg/mL) in the presence of changing concentrations of sucrose, as in Fig. 6. A1 and A2 represent the integrated areas of the FFT peaks corresponding to layer 1 and layer 2 (A1 and A2 of eq. 6) respectively. The ratio of A1 to A2 is shown in the top trace. The ratio eliminates the effect of sucrose at all concentrations, allowing selective detection of BSA. Note that the absolute scales for A1 and A2 differ. The labels (a)through (o) are the same as in Fig. 6.
3. CONCLUSIONS
This paper demonstrated a new means to construct an optical interferometer that incorporates a reference arm into the structure as a double-stack of porous layers, in a volume of less than 0.2 mm3. This structure leads to optical fringes that provide information on processes occurring in each of the porous layers. It was shown how the important optical constants can be extracted by fast Fourier transform (FFT) of the reflectivity spectrum. The positions and amplitudes of the FFT peaks depend on the thicknesses and refractive indices of the layers. If one of these layers is appropriately designed, it can act as a blank (or reference) for the other layer. In the example we have used to demonstrate this concept, the pores in one of the layers have been made sufficiently small as to exclude large biomolecules, while smaller molecules (buffers and sugars) can penetrate both layers. When the structure is exposed to bovine serum albumin (BSA) at pH 4, the molecule can only access the outer (large pore) layer, and it adsorbs to the surfaces of those larger pores. This leads to changes in the refractive index of this layer only. When a mixture of BSA and smaller molecules is used, the smaller molecules again penetrate both layers, while the BSA only accesses the larger pore layer. The ratio of the amplitudes of the FFT peaks changes significantly when a molecule is present that can only enter the larger pores, allowing selective detection of this analyte. If the FFT peak positions, rather than their amplitudes are used, the changes in the selective (large-pore) layer can be corrected for effects of the presence of small molecules by linear subtraction of the appropriately weighted values. These methods provide a ready means for removing signals due to the presence of buffers and other small molecules such as sugars in a solution containing a large analyte.
Although the concept was demonstrated for separation and detection of biomolecules by size exclusion, the approach is generally applicable to chemical detection problems. For example, the methodology should also work if one layer contains a specific antibody. This would provide the device with an ability to discriminate based on specific molecular affinity rather than nonspecific interaction. The methods exist to place molecules in specific layers of a porous Si multilayer,35 and the use of antibodies or other specific capture probes in porous Si layers is well-established.4,7,9,19,36,37 The approach should also be amenable to other label-free transduction modalities that utilize refractive index changes, such as surface plasmon resonance or microcavity resonance. The built-in reference channel and Fourier method of analysis provides a general means to compensate for changes in sample matrix, temperature, and other experimental fluctuations.
4. EXPERIMENTAL
Materials
All reagents were used as received. Potassium phosphate pH 7 buffer was obtained from Fisher, Inc. as a 0.05 M potassium phosphate Certified Buffer Solution (Cat. No. SB108-20). The potassium biphthalate pH 4 buffer was obtained from Fisher, Inc. as a 0.05 M potassium biphthalate Certified Buffer Solution (Cat. No. SB98-500). Bovine Serum Albumin (BSA), lyophilized powder, 1x crystallized, > 97% purity, was obtained from Sigma-Aldrich (Cat. No. A 4378). Sucrose was obtained from EM Science (Cat. No. SX 1075-1). Aqueous HF (48%) and ethanol (99.9%) were supplied by Fisher Scientific and AAper, respectively. Porous Si samples were prepared from single-crystalline highly-doped p-type Si (0.0008-0.0012 Ω-cm resistivity, <100> oriented, B-doped, from Siltronix Corp.)
Etching Procedure
Porous Si samples were prepared by anodization of the degenerately doped p-type Si wafers in ethanolic HF solution (3:1 v/v 48% aqueous HF:ethanol) in a two-electrode configuration using a platinum mesh counter-electrode. Si wafers with an exposed area of 1.2 cm2 were contacted on the back side with a strip of aluminium foil and mounted in a Teflon etching cell. Galvanostatic anodization was performed in the dark. Single-layers were etched by applying 500 mA/cm2 for 11 s (“single-layer 1”) or 167 mA/cm2 for 55 s (“single-layer 2”). Double-layer samples were prepared by application of 500 mA/cm2 for 11 s followed immediately by application of 167 mA/cm2 for 55 s. After etching, the samples were rinsed thoroughly with ethanol and then dried under a stream of nitrogen.
Scanning Electron Microscopy
Scanning electron microscopy (SEM) images were obtained with a Cambridge EM-360 electron microscope using an accelerating voltage of 20 keV. In order to avoid sample charging anomalies, the porous Si samples were sputter-coated with a thin layer of gold (20 nm) prior to the SEM analysis.
Interferometric Reflectance Spectra
Interferometric reflectance spectra of porous Si were collected by using an Ocean Optics CCD S-2000 spectrometer fitted with a microscope objective lens coupled to a bifurcated fiber optic cable. A tungsten light source was focused onto the center of a porous Si surface with a spot size of approximately 1-2 mm2. Reflectivity data were recorded with a CCD detector in the wavelength range of 400-1000 nm, with a spectral acquisition time of 100 ms. Typically 10 spectral scans (1 s total integration time) were averaged before FFT processing. Both the illumination of the surface and the detection of the reflected light were performed along an axis coincident with the surface normal.
Thermal oxidation
Porous Si samples were thermally oxidized by heat treatment in a tube furnace (Fisher Blue M). The samples were heated at 600 °C for 1 h in ambient air, then allowed to cool to room temperature.
Gravimetric determination of porosity and thickness
Three porous Si samples were weighed on a laboratory balance with a resolution of 10 μg before (m1) and after etching at mA/cm2, respectively. Each sample was thermally oxidized and weighed again (m2). The oxidized porous Si layer was then dissolved in 48% aqueous HF:ethanol (3:1, v:v), and the wafer remaining was weighed (m3). The porosity P was calculated using the following equation:22
The thickness W of the porous Si layer was determined by applying the equation:
where S is the wafer area exposed to HF during the electrochemical etching and d is the density of bulk Si.
Flow cell experiments
Biomolecule penetration experiments were carried out in a custom-made flow cell which has been described previously.4 Briefly, the flow cell was constructed of plexiglass and connected via an outlet and inlet to a peristaltic pump. The light beam was focused on the surface of the sample through the plexiglas cover and interference spectra were recorded.
Data analysis
The wavelength axis of the spectrum from the Ocean Optics spectrometer was calibrated using a least-squares fit of five spectral lines observed from a neon lamp, at 585.3, 614.3, 640.2, 703.2, and 811.5 nm. The data spacing is approximately 0.4 nm. The x-axis was inverted and a linear interpolation was applied such that the data were spaced evenly in units of nm-1. A Hanning window was applied to the spectrum, it was redimensioned to 4096 data points and zero padded to the power of two. A discrete Fourier transform using a multidimensional fast prime factor decomposition algorithm from the Wavemetrics, inc (www.wavemetrics.com) IGOR program library (FFT) was applied.
5. ACKNOWLEDGEMENT
This project has been funded in part with Federal funds from the National Cancer Institute of the National Institutes of Health (Contract No. N01-C0-37117) and the Air Force Office of Scientific Research (Grant# F49620-02-1-0288). C.P. thanks the Deutsche Forschungsgemeinschaft, (PA 925/1-1) for a post-doctoral fellowship. M.S. thanks the Fondazione Ing. Aldo Gini for a study grant. The authors thank Do-Kyung Kim for helpful discussions.
6. REFERENCES
- (1).Hérino R. In: Properties of Porous Silicon. Canham L, editor. Vol. 18. Short Run Press Ltd; London: 1997. pp. 89–96. [Google Scholar]
- (2).Buriak JM. Adv. Mater. 1999;11:265–267. [Google Scholar]
- (3).Lin VS-Y, Motesharei K, Dancil KS, Sailor MJ, Ghadiri MR. Science. 1997;278:840–843. doi: 10.1126/science.278.5339.840. [DOI] [PubMed] [Google Scholar]
- (4).Janshoff A, Dancil K-PS, Steinem C, Greiner DP, Lin VS-Y, Gurtner C, Motesharei K, Sailor MJ, Ghadiri MR. J. Am. Chem. Soc. 1998;120:12108–12116. [Google Scholar]
- (5).Zangooie S, Bjorklund R, Arwin H. Thin Sol. Films. 1998;313-314:825–830. [Google Scholar]
- (6).Snow PA, Squire EK, Russell PSJ, Canham LT. J. Appl. Phys. 1999;86:1781–1784. [Google Scholar]
- (7).Dancil K-PS, Greiner DP, Sailor MJ. J. Am. Chem. Soc. 1999;121:7925–7930. [Google Scholar]
- (8).van Noort D, Welin-Klintstrom S, Arwin H, Zangooie S, Lundstrom I, Mandenius C-F. Biosens. Bioelectron. 1998;13:439–449. doi: 10.1016/s0956-5663(97)00094-8. [DOI] [PubMed] [Google Scholar]
- (9).Chan S, Horner SR, Miller BL, Fauchet PM. J. Am. Chem. Soc. 2001;123:11797–11798. doi: 10.1021/ja016555r. [DOI] [PubMed] [Google Scholar]
- (10).Gauglitz G, Brecht A, Kraus G, Nahm W. Sens. Actuators B. 1993;11:21–27. [Google Scholar]
- (11).Collins BE, Dancil K-P, Abbi G, Sailor MJ. Adv. Funct. Mater. 2002;12:187–191. [Google Scholar]
- (12).Karlsson LM, Tengvall P, Lundström I, Arwin H. J. Colloid Interface Sci. 2003;266:40–47. doi: 10.1016/s0021-9797(03)00595-2. [DOI] [PubMed] [Google Scholar]
- (13).Karlsson LM, Schubert M, Ashkenov N, Arwin H. Thin Sol. Films. 2004;455–456:726–730. [Google Scholar]
- (14).Zhang XG. J. Electrochem. Soc. 2004;151:C69–C80. [Google Scholar]
- (15).Foll H, Christopherson M, Carstensen J, Haase G. Mater. Sci. Eng. R. 2002;39:93–141. [Google Scholar]
- (16).Vincent G. Appl. Phys. Lett. 1994;64:2367–2369. [Google Scholar]
- (17).Berger MG, Arens-Fischer R, Thoenissen M, Krueger M, Billat S, Lueth H, Hilbrich S, Theiss W, Grosse P. Thin Sol. Films. 1997;297:237–240. [Google Scholar]
- (18).Meade SO, Yoon MS, Ahn KH, Sailor MJ. Adv. Mater. 2004;16:1811–1814. [Google Scholar]
- (19).Marti’n-Palma RJ, Torres-Costa V, Arroyo-Herna’ndez M, Manso M, Pe’rez-Rigueiro J, Martı’nez-Duart JM. Microelectronics J. 2004;35:45–48. [Google Scholar]
- (20).Lees IN, Lin H, Canaria CA, Gurtner C, Sailor MJ, Miskelly GM. Langmuir. 2003;19:9812–9817. [Google Scholar]
- (21).Gao T, Gao J, Sailor MJ. Langmuir. 2002;18:9953–9957. [Google Scholar]
- (22).Halimaoui A. In: Properties of Porous Silicon. Canham L, editor. Vol. 18. Short Run Press Ltd; London: 1997. pp. 12–22. [Google Scholar]
- (23).Bohren CF, Huffman DR. Adsorption and scattering of light by small particles. Wiley; New York: 1983. [Google Scholar]
- (24).Theiss W, Henkel S, Arntzen M. Thin Sol. Films. 1995;255:177–180. [Google Scholar]
- (25).Lee C, Koker L, Kolasinski KW. Appl. Phys. 2000:77–82. [Google Scholar]
- (26).Anglin EJ, Schwartz MP, Ng VP, Perelman LA, Sailor MJ. Langmuir. 2004;20:11264–11269. doi: 10.1021/la048105t. [DOI] [PubMed] [Google Scholar]
- (27).Zangooie S, Jansson R, Arwin H. J. Appl. Phys. 1999;86:850–858. [Google Scholar]
- (28).Astrova EV, Voronkov VB, Remenyuk AD, Shuman VB, Ioffe AF, Tolmachev VA, Vavilov SI. Semiconductors. 1999;33:1149–1155. [Google Scholar]
- (29).McLeod HA, Adam Hilger, Ltd. Bristol: 1986. p. 49. [Google Scholar]
- (30).Huang BX, Kim H-Y, Dass C. J. Am. Soc. Mass. Spectrom. 2004:1237–1247. doi: 10.1016/j.jasms.2004.05.004. [DOI] [PubMed] [Google Scholar]
- (31).Hlady V, Buijs J. Curr. Opin. Biotechnol. 1996;7:72–77. doi: 10.1016/s0958-1669(96)80098-x. [DOI] [PMC free article] [PubMed] [Google Scholar]
- (32).Tarasevich YI, Monakhova LI. Colloid J. 2002;64:482–487. [Google Scholar]
- (33).Su TJ, Lu JR, Thomas RK, Cui ZF. J. Phys. Chem. B. 1999;103:3727–3736. [Google Scholar]
- (34).Schwartz MP, Cunin F, Cheung RW, Sailor MJ. Phys. Stat. Sol. A. 2005;202:1380–1384. [Google Scholar]
- (35).Link JR, Sailor MJ. Proc. Nat. Acad. Sci. 2003;100:10607–10610. doi: 10.1073/pnas.1233824100. [DOI] [PMC free article] [PubMed] [Google Scholar]
- (36).Cunin F, Schmedake TA, Link JR, Li YY, Koh J, Bhatia SN, Sailor MJ. Nature Mater. 2002;1:39–41. doi: 10.1038/nmat702. [DOI] [PubMed] [Google Scholar]
- (37).Starodub NF, Fedorenko LL, Starodub VM, Dikij SP, Svechnikov SV. Sens. Actuators B. 1996;35:44–47. [Google Scholar]