Abstract

Mn doped Si nanoparticles have been synthesized via a low temperature solution route and characterize by X-ray powder diffraction, TEM, optical and emission spectroscopy and by EPR. The particle diameter was 4 nm and the surface was capped by octyl groups. 5% Mn doping resulted in a green emission with slightly lower quantum yield than undoped Si nanoparticles prepared by the same method. Mn2+ doped into the nanoparticle is confirmed by epr hyperfine and the charge carrier dynamics were probed by ultrafast transient absorption spectroscopy. Both techniques are consistent with Mn2+ on or close to the surface of the nanoparticle.
Multifunctional nanomaterials are multi-phase nanostructures with combined functionality such as detection by multiple imaging modalities, or detection and therapy. These nanomaterials possess combinations of properties that do not exist in single-phase materials. Nanoparticles, in particular, have potential for multimodal biological applications by the addition of functionality to augment their luminescence.1-3 Nanoparticles have intense visible luminescence because of quantum confinement and the color can be tuned throughout the visible spectrum by changing the particle size.4,5 Due to their biocompatibility, high photoluminescence quantum efficiency, and stability against photobleaching, silicon nanoparticles are expected to be an ideal candidate in many biological assays and fluorescence imaging techniques.6-8 The addition of paramagnetism to silicon nanoparticles would allow combination of optical detection with magnetic resonance imaging detection or magnetic separation.
An effective method for manipulating the physical properties of semiconductors involves impurity doping.9 II-VI semiconductor quantum dots can be doped with metal ions that have energy states within the bandgap. As a result, light emission from these introduced trap states can be observed.10 The advantage of this approach is that color can be controlled by the nature of the dopant, which allows for similar sized quantum dots with a full spectrum of colors. Doped nanomaterials provide the possibility for enhanced, multimodal functionality in contrast to their single-component counterparts.11 Recently, Mn doped group IV semiconductors have attracted much attention both in experiment and theory.12-14
In this communication, we describe our syntheses of Mn doped Si nanoparticles and characterize the optical and magnetic properties of the system. Recently, a solution route has been used to produce macroscopic amounts of either amorphous or crystalline hydrogen terminated Si nanoparticles in our laboratory.15,16 Herein, Mn doped Zintl salts (NaSi1-xMnx, x = 0.05, 0.1, 0.15) were prepared as precursors, followed by the reaction with ammonium bromide to make hydrogen capped nanocomposites.
| (1) |
The hydride-capped Mn doped silicon nanoparticles can be modified further via a hydrosilylation process to form chemically robust Si-C bonds on the surface and to protect the silicon particles from oxidation.17,18 The nanoparticles described herein were capped with octyne to form organic soluble nanoparticles.
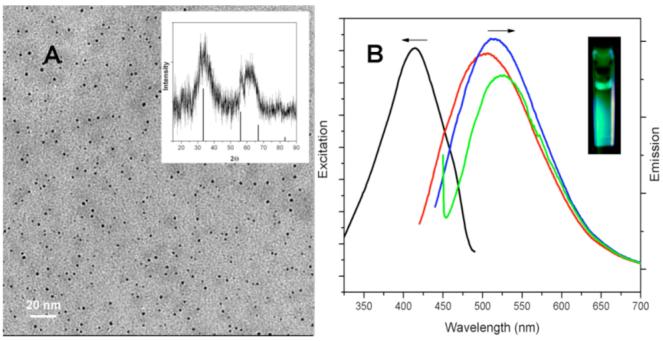
Figure 1A shows representative TEM image of 5% Mn doped Si nanoparticles collected on a carbon TEM grid. The percentage of Mn in the Si nanoparticle sample was confirmed by elemental analysis with a molar ratio of Si:Mn of 18.2:1, consistent with 5% Mn doped Si nanoparticles and all the characterization described herein are on samples with nominally 5% Mn doping. The average diameter of Si nanoparticles is 4.2 ± 0.9 nm based on a survey of 530 particles from different regions of the grid. This result is similar to that for undoped Si nanoparticles prepared by this same method.15
Figure 1.

(A) TEM image of 5% Mn doped Si nanoparticles. Inset is XRD pattern of Mn doped silicon nanoparticles. The lines indicate the X-ray diffraction peak position for diamond structure silicon. (B) Excitation spectra (black) and Room temperature PL spectra of Si nanoparticles in chloroform at different excitation wavelengths: 400 nm (red); 420 nm (blue), and 440 nm (green). Inset: fluorescence from a cuvette of Mn doped Si nanoparticles when excited with a handheld UV lamp.
The inset of Figure 1A shows the X-ray powder diffraction pattern of the obtained Mn doped Si nanoparticles. The diffraction pattern shows two broad diffraction peaks at approximately 33° and 60°, consistent with observations for amorphous silicon.16,19 The narrow peaks at 32° and 56° could correspond to the (111) and (220) reflections of crystalline silicon. The diffraction pattern can be interpreted as due to mainly amorphous Si.16 No diffraction due to Mn and MnOx phases are observed, suggesting that Mn is incorporated into the Si nanoparticles.
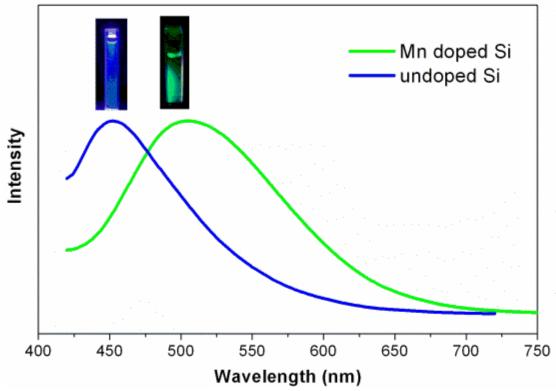
Photoluminescence (PL) spectra (excitation and emission) were used to investigate the optical properties of the Mn doped silicon nanoparticles in chloroform (Figure 1B). The excitation spectrum (black curve) shows that monitored at excitation wavelength 510 nm, the Mn doped Si nanoparticle sample gave the strongest peak when excited at 420 nm. The emission spectra show a relatively narrow region of intense luminescence with maximum intensity from 490 to 520 nm, with excitation from 380 to 440 nm. The maximum intensity emission spectrum is centered at 510 nm with an excitation wavelength of 420 nm. Compared to the undoped Si nanoparticles,15 there is an obvious red shift from 430 nm to 520 nm. Changes in the excitation wavelength excited different size populations of nanoparticles, resulting in the varying emission wavelengths observed. Quantum yields of up to 16% in chloroform were obtained relative to the standard fluorescein solution20 for the Mn doped Si sample, lower than that reported for undoped Si prepared in the same manner (18%).15 With larger amounts of Mn, the quantum yield decreased significantly.
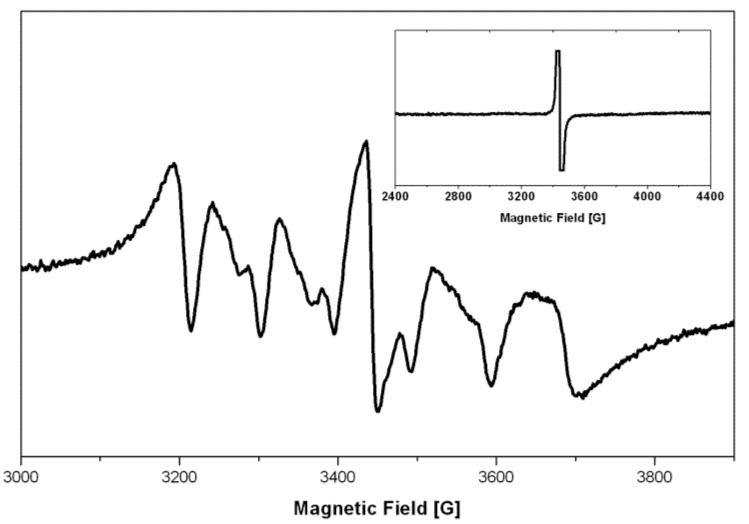
Electron Paramagnetic Resonance (EPR) measurements (Figure 2) were used to confirm the presence of Mn2+ in the Si nanoparticles. The EPR spectrum of the undoped samples (insert in Fig. 2) shows a sharp signal at g = 2.0, attributed to dangling bonds in the Si nanoparticles.21 In addition to the g = 2.0 signal, the Mn doped sample exhibits a six-line spectrum, arising from the hyperfine interaction with the 55Mn nuclear spin (I = 5/2).22 The observed hyperfine splitting is 96 G, and is similar to the hyperfine splitting observed for Mn2+ ions isolated on the surface of Si rather than in the interior.23 To rule out possible presence of the Mn2+ ions simply physisorbed on the Si surface, an additional set of samples were prepared by successive purification (washed four times with a chloroform/methanol mixture) followed by ligand exchange with pyridine in order to remove Mn2+ from the surface of the particles.11 The corresponding EPR spectra are almost identical to the one obtained with the nonwashed samples and the Mn hyperfine splitting value remains the same, suggesting that Mn2+ is covalently bound to the surface or near the surface of the nanoparticle (supporting information). The presence of Mn2+ near or at the surface would be optimal for MRI applications.
Figure 2.

EPR spectrum of the Mn2+ doped Si nanoparticles. Inset: EPR spectra of the undoped Si nanoparticles.
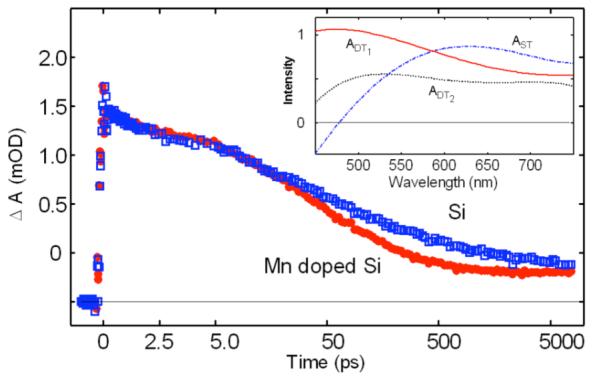
Additional evidence for Mn doped into the nanoparticles can be provided by transient absorption (TA) spectroscopy. TA data show that the excited state dynamics of the 5% Mn doped Si nanoparticles differs distinctly from undoped Si nanoparticles (Figure 3). At least two trapped electronic populations can be distinguished spectroscopically in the undoped Si nanoparticles (Inset, Figure 3). The population associated with higher energy electron trap states decays ∼20% more quickly in the Mn doped Si nanoparticles, suggesting that photogenerated excitons have additional relaxation paths. Similarly faster trapped electron relaxation has been observed in Er3+ doped Si nanocrystals.24 A ns plateau in absorption also indicates a longer lived charge separation in the Mn doped Si nanoparticles. One explanation for the differences in dynamics is a terminal migration of charge carriers from Si traps to Mn states. The red-shifted emission spectrum of Mn doped Si indicates recombination from trap states that are on average > 0.1 eV lower in energy than trap states in undoped Si. These states are likely associated with Mn2+, from which radiative recombination is inhibited both by a highly localized electron and because the d-d transition is not spin allowed.25 Because radiative trap sites in Si nanoparticles are attributed to non-quantized surface states26 electron transfer from deep Si traps suggests that Mn2+ is coupled to the Si surface.
Figure 3.

Transient absorption spectroscopy probed at 525 nm in Mn doped Si and undoped Si nanoparticles. Inset: Global analysis was used to determine species associated spectra for three electron populations in shallow traps (ST), deep traps (DT1 and DT2).
Supplementary Material
Acknowledgements
This work was supported by the NIH (HL081108-01).
References
- (1).Huh Y-M, Jun Y.-w., Song H-T, Kim S, Choi J.-s., Lee J-H, Yoon S, Kim K-S, Shin J-S, Suh J-S, Cheon J. J. Am. Chem. Soc. 2005;127:12387–12391. doi: 10.1021/ja052337c. [DOI] [PubMed] [Google Scholar]
- (2).Santra S, Yang H, Holloway PH, Stanley JT, Mericle RA. J. Am. Chem. Soc. 2005;127:1656–1657. doi: 10.1021/ja0464140. [DOI] [PubMed] [Google Scholar]
- (3).Michalet X, Pinaud FF, Bentolila LA, Tsay JM, Doose S, Li JJ, Sundaresan G, Wu AM, Gambhir SS, Weiss S. Science. 2005;307:538–544. doi: 10.1126/science.1104274. [DOI] [PMC free article] [PubMed] [Google Scholar]
- (4).Canham LT. Appl. Phys. Lett. 1990;57:1046–1048. [Google Scholar]
- (5).Veinot JGC. Chem. Commun. 2006:4160–4168. doi: 10.1039/b607476f. [DOI] [PubMed] [Google Scholar]
- (6).Li ZF, Ruckenstein E. Nano Lett. 2004;4:1463–1467. [Google Scholar]
- (7).Wang L, Reipa V, Blasic J. Bioconjugate Chem. 2004;15:409–412. doi: 10.1021/bc030047k. [DOI] [PubMed] [Google Scholar]
- (8).Buriak JM. Phil. Trans. R. Soc. A. 2006;364:217–225. doi: 10.1098/rsta.2005.1681. [DOI] [PubMed] [Google Scholar]
- (9).Shi W, Zeng H, Sahoo Y, Ohulchanskyy TY, Ding Y, Wang ZL, Swihart M, Prasad PN. Nano letters. 2006;6:875–881. doi: 10.1021/nl0600833. [DOI] [PubMed] [Google Scholar]
- (10).Murphy CJ, Coffer JL. Appl. Spectro. 2002;56:16A–27A. [Google Scholar]
- (11).Wang S, Jarrett BR, Kauzlarich SM, Louie AY. J. Am. Chem. Soc. 2007;129:3848–3856. doi: 10.1021/ja065996d. [DOI] [PMC free article] [PubMed] [Google Scholar]
- (12).Yoon IT, Park CJ, Kang TW. J Magn Magn Mater. 2007;311:693–696. [Google Scholar]
- (13).Li AP, Shen J, Thompson JR, Weitering HH. Applied Physics Letters. 2005;86:152507/1–152507/3. [Google Scholar]
- (14).Jamet M, Barski A, Devillers T, Poydenot V, Dujardin R, Bayle-Guillemaud P, Rothman J, Bellet-Amalric E, Marty A, Cibert J, Mattana R, Tatarenko S. Nat Mater. 2006;5:653–659. doi: 10.1038/nmat1686. [DOI] [PubMed] [Google Scholar]
- (15).Zhang X, Neiner D, Wang S, Louie AY, Kauzlarich SM. Nanotechnology. 2007;18:095601. doi: 10.1088/0957-4484/18/9/095601. [DOI] [PMC free article] [PubMed] [Google Scholar]
- (16).Neiner D, Chiu HW, Kauzlarich SM. J. Am. Chem. Soc. 2006;128:11016–11017. doi: 10.1021/ja064177q. [DOI] [PubMed] [Google Scholar]
- (17).Liao Y-C, Roberts JT. J. Am. Chem. Soc. 2006;128:9061–9065. doi: 10.1021/ja0611238. [DOI] [PubMed] [Google Scholar]
- (18).Liu SM, Yang Y, Sato S, Kimura K. Chem. Mater. 2006;18:637–642. [Google Scholar]
- (19).Kapaklis V, Politis C, Poulopoulos P, Schweiss P. Appl Phys Lett. 2005;87:123114/1–123114/3. [Google Scholar]
- (20).Brannon JH, Magde D. J Phys. Chem. 1978;82:705–9. [Google Scholar]
- (21).Arul Dhas N, Raj CP, Gedanken A. Chem. Mater. 1998;10:3278–3281. [Google Scholar]
- (22).Norris DJ, Yao N, Charnock FT, Kennedy TA. Nano Letters. 2001;1:3–7. [Google Scholar]
- (23).Ludwig GW, Woodburg HH, Carlson RO. J. Phys. Chem. Solids. 1959;8:490–492. [Google Scholar]
- (24).Samia ACS, Lou Y, Burda C, Senter RA, Coffer JL. J. Chem. Phys. 2004;120:8716–8723. doi: 10.1063/1.1695318. [DOI] [PubMed] [Google Scholar]
- (25).Smith BA, Zhang JZ, Joly A, Liu J. Phys. Rev. B. 2000;62:2021–2028. [Google Scholar]
- (26).Klimov VI, Schwarz CJ, McBranch DW, White CW. Appl. Phys. Lett. 1998;73:2603–2605. [Google Scholar]
Associated Data
This section collects any data citations, data availability statements, or supplementary materials included in this article.


