

Abstract
Computer-animated characters are common in popular culture and have begun to be used as experimental tools in social cognitive neurosciences. Here we investigated how appearance of these characters’ influences perception of their actions. Subjects were presented with different characters animated either with motion data captured from human actors or by interpolating between poses (keyframes) designed by an animator, and were asked to categorize the motion as biological or artificial. The response bias towards ‘biological’, derived from the Signal Detection Theory, decreases with characters’ anthropomorphism, while sensitivity is only affected by the simplest rendering style, point-light displays. fMRI showed that the response bias correlates positively with activity in the mentalizing network including left temporoparietal junction and anterior cingulate cortex, and negatively with regions sustaining motor resonance. The absence of significant effect of the characters on the brain activity suggests individual differences in the neural responses to unfamiliar artificial agents. While computer-animated characters are invaluable tools to investigate the neural bases of social cognition, further research is required to better understand how factors such as anthropomorphism affect their perception, in order to optimize their appearance for entertainment, research or therapeutic purposes.
Keywords: anthropomorphism, computer-animated characters, biological motion
INTRODUCTION
Renaissance artists attempted to render human bodies flawlessly, but this period is unusual as art history is dominated by altered depictions of the body. Throughout its much shorter history, computer graphics has similarly followed two paths: the realistic performance of digital characters created for special effects and the compelling but intentionally unrealistic performance of ‘cartoon’ characters. Realistic anthropomorphic characters are widely regarded as the most challenging, in part because they sometimes look eerie or repulsive. According to the popular press (Levi, 2004), anthropomorphic characters, for example those animated from the movements of real actors’ recorded using motion capture equipment in the movie The Polar Express (© Warner Bros Entertainment Inc.) ‘feel more uncanny’ than the stylized heroes moving unrealistically in The Incredibles (© Disney/Pixar).
The ‘uncanny valley’ hypothesis could explain this observation. When Japanese roboticist Masahiro Mori investigated robots’ social competence (Mori, 1970), he proposed that as a robot is made more humanlike in its appearance and motion, an observer's emotional response would not linearly increase but would fall into a local minimum when the robot closely but imperfectly reproduces a human being, hence the name ‘uncanny valley of eeriness’. The motor theory of social cognition, which proposes that the self identifies with others through overlap between neural processes devoted to perception and execution of actions (Decety and Chaminade, 2003), the ‘motor resonance’ exemplified by monkey's mirror neurons (Rizzolatti et al., 2001), yields a contradictory prediction: as artificial characters’ anthropomorphism increases, so should the perceived naturalness of their actions. Despite its ability to address fundamental mechanisms of the social brain, the effect anthropomorphism has on the perception of animated characters’ motions has not been addressed directly (Hodgins et al., 1998).
Stimuli for experiments on the perception of human motion have generally been created either through simple animations or from realistic videos of real world behaviours. The approach of using simple animations was initiated by Gunnar Johansson (1973), who showed that even drastically impoverished displays of biological motion have the ability to elicit spontaneous recognition of actions and intentions. When point-light sources attached to an actor's joints are animated by his movements, their motion gives a spontaneous and vivid impression of the actor and his actions. This specific case of ‘form-from-motion’ transforms the coherent movements of dots into the perception of a human figure acting (Neri et al., 1998). A great deal of information can be extracted from these point-light displays, such as the gender and the emotion of an actor (Verfaillie, 2000), demonstrating how informative body dynamics can be to the observer. The alternative line of investigation has used videos of individuals depicting actions, for example to investigate reciprocal online imitation (Decety et al., 2002). In a fMRI study, subjects were instructed to watch a video showing an actor lifting a box, and were able to infer the actor's expectation of the weight (Grezes et al., 2004b) or to perceive the actor's intent to deceive them (Grezes et al., 2004a).
Both approaches have shortcomings. Point-light displays correctly control for action dynamics, but do not provide information about appearance. Videos of real world performances cannot be controlled for precise details of the action dynamics, which limits our understanding of features relevant to the experimental task. Neurophysiology also reveals possible discrepancies between results obtained with the two types of stimuli. Single neurons responding both to full body and to point-light displays of actions and tuned to different aspects of the observed action such as direction of the movement and orientation of the body were originally found in the monkey's superior temporal sulcus region (Oram and Perrett, 1996). This region has been repeatedly argued, in monkey (Oram and Perrett, 1996), humans (Puce et al., 2003) and computational simulations (Lange and Lappe, 2006), to be the site of integration of form and motion information coming from the ventral and dorsal streams of visual processing, respectively, during the perception of social signals such as actions or speech (Allison et al., 2000; Puce and Perrett, 2003). But on the other hand, human neuroimaging experiments using point lights repeatedly failed to report activity in the premotor cortex (Vaina et al., 2001; Peelen et al., 2006), with one notable exception (Saygin et al., 2004), while this region seems to be the hallmark of research using videos of real individuals (Rizzolatti and Craighero, 2004). Activity in motor-related cortices, predicted by the motor theory of social cognition (Gallese et al., 2004), and in the medial prefrontal cortex, involved in social cognitive processes such as mentalizing (Blakemore and Decety, 2001), appears to depend on the type of stimuli. It has been proposed that point-light stimuli fail to activate the mirror system because they are ‘insufficient to elicit this personal knowledge [in reference to (Merleau-Ponty, 1962)] of the action’ (Rizzolatti and Craighero, 2004). When observing other agents, only embodied actions belonging to the repertoire of the observer would trigger the motor resonance which elicits this personal knowledge of the action.
Computer-animated characters provide an elegant way to reconcile research from these two approaches. Cognitive sciences are starting to make use of such characters (Tarr and Warren, 2002) as stimuli (Pelphrey et al., 2003; Thompson et al., 2005; Schilbach et al., 2006) and when testing virtual reality therapy for social phobia (Klinger et al., 2005; Pertaub et al., 2001; Roy et al., 2003). Yet caution is needed as computer-animated characters may produce undesirable effects such as those predicted by the ‘uncanny valley’ hypothesis. Here we used a classification task to investigate the influence of discrete variations of animated characters’ appearance on the perception of its actions. Participants were required to classify a short running motion as ‘Biological’ or ‘Artificial’, corresponding to the motion capture and keyframing techniques used to animate the characters. The motion capture sequences were created by capturing the motion of actors wearing reflective markers with a commercial motion capture system. The key framed motions were created by an animator who positioned the character at key moments in the running sequence and then had the computer interpolate between those poses. We report that the response bias towards perceiving a motion as biological decreases with anthropomorphism of the characters used to render the motion. The use of event-related fMRI revealed that, independently of the character used, this response bias is positively correlated with the activity in a network of regions known to support mentalizing, in the left superior temporal sulcus (STS) and temporoparietal junction (TPJ), in the right superior temporal gyrus (STG) and in the anterior cingulate cortex (ACC) and precuneus (PreC), and negatively with the mirror system, in the right ventral premotor region and intraparietal sulcus. This result suggests that the actions of characters favouring mentalizing, not motor resonance, are perceived as biological.
METHODS
Stimuli preparation
Behavioural and fMRI experiments use the same stimuli. Different graphical models (see Figure 1A, for examples) were animated based on motion capture data or on motion constructed by interpolating between key frames (‘keyframing’). To create the motion capture animations, the motion of actors running in the laboratory was recorded using a Vicon Motion Capture system (www.vicon.com). This system has 12 cameras, each of which is capable of recording at 120 Hz with images of 4 MegaPixel resolution. The actor wore a marker set of 41 9.5 mm markers to build a sufficiently rich model of his configuration. Motions were captured in a working volume of ∼8 × 8 × 24 m3. A model of the actor's skeleton (limb lengths and joint locations) was obtained automatically from a canonical static pose (the T-pose) and a trial in which the actor moved each of his joints through their full range of motion. Using this skeleton, the motion was further processed to the position and orientation of a root body (the pelvis), and the relative joint angles of 18 joints and then imported into Autodesk's Maya animation software for rendering. A trained animator used keyframing to create the second set of motions. In this technique, the animator manually designs poses (key frames) for the character and the Maya software interpolates between those poses to create the full motion. Approximately, three full poses of the character were used for each running step. The skeleton created from the motion capture session was used for keyframing so that the degrees of freedom and limb lengths were unchanged. The sets of motion capture and keyframed stimuli were also matched one-to-one in terms of duration, camera angle and distance travelled by the character (see http://graphics.cs.cmu.edu/projects/anthropomorphism/).
Fig. 1.
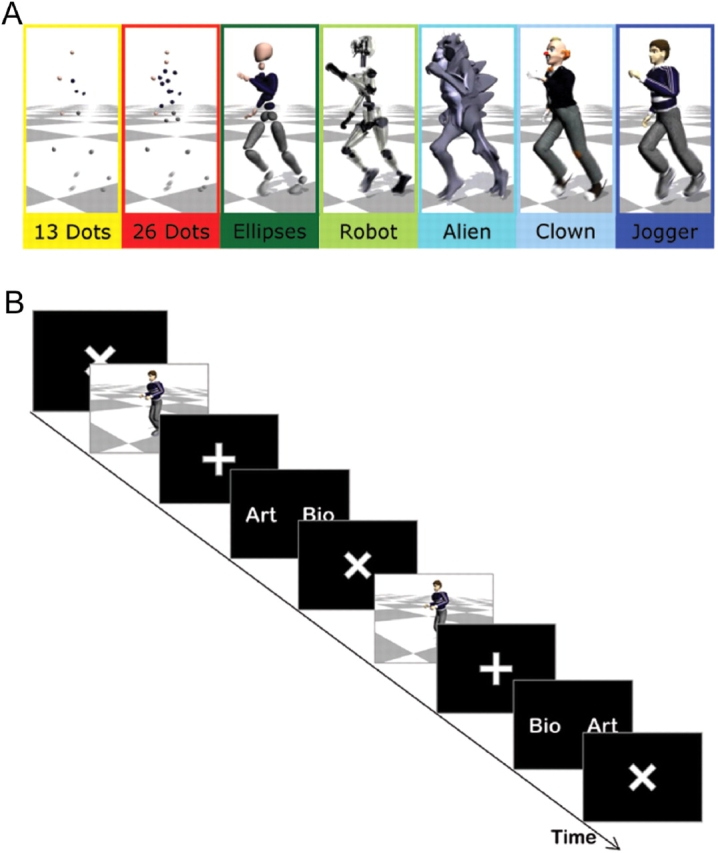
Experimental paradigm. (A) Characters used in the behavioural experiment (colour frames and names are added for reference in this report and were not visible to subjects). The Dots characters contain 13 and 26 spheres on articulations of the body, comparable to those used in point-light displays. Full body characters include a body made of disconnected ellipsoid volumes, a robot with metallic shafts for body parts, a humanoid monster and human-like clown and jogger. (B) Stimuli are preceded by a response–stimulus interval (titled cross) and followed by a stimulus–response interval (straight cross). The response cue indicates which side of the mouse should be pressed to answer biological (‘Bio’) and artificial (‘Art’), randomized for each trial. It disappears after recording the subjects’ response, or after a maximum duration. The timing properties of the intervals were adapted to the experimental constraints.
Experimental paradigm
Subjects were presented with stimuli showing the character's running movements at the centre of a computer screen. The motions were approximately 1 s in duration. After viewing the motion, they were asked to decide whether its origin was Biological (‘Bio’) or Artificial (‘Art’) in a two-alternative forced-choice (2AFC) paradigm. The differences between the two types of motion were fully explained to the subject. In particular, the subjects were told how the motions were prepared, and were shown one to five exemplary pairs of motion capture and keyframe stimuli (not used in the actual experiment) prior to starting. We ensured verbally that they understood the meaning of the two different types of motions and the instruction before the onset of the first experimental session. A cue screen, appearing after stimulus presentation, randomly assigned the side of the mouse button click to respond ‘Bio’ and ‘Art’ in each trial (Figure 1B). The randomization of the side of response indicated on the response screen prevented subjects from preparing the response during the preceding interval.
The response–stimulus and stimulus–response intervals and the maximum duration of the response screen were adapted to experimental constraints. The interval between stimulus and response was randomized between 400 and 600 ms for the behavioural experiment, and between 2000 and 3000 ms for the fMRI. The interval between the response and the next stimulus was randomized between 500 and 1000 ms for the behavioural experiment, and between 1000 and 2000 ms for the fMRI experiment. Longer intervals were used in fMRI to ensure efficient deconvolution of the haemodynamic response associated with the presentation of the stimulus and with the motor response. The maximum duration of the response screen was 1000 ms in both experiments. In the behavioural experiment, 640 × 480 pixels stimuli were presented at the centre of a computer LCD 1280 × 1024 screen subtending a field of view of ∼20° at a distance of ∼75 cm from the subjects. In the fMRI scanner, stimuli were projected on a screen fixed to the head coil located in front of subjects’ eyes, with a field of view of 20° approximately.
Volunteers gave informed consent to participate to these experiments, which were approved by the local ethics committee of ATR. Twelve self-reported right-handed volunteers (6 men; aged 27.3 ± 4.7 years) with no known history of neurological disorder and normal or corrected-to-normal vision participated in the behavioural experiment and in the fMRI experiment on the following day. In each of the four experimental sessions, each of the seven characters (Figure 1A) was presented six times depicting motion capture and with keyframe stimuli. Twelve sets of motions were used, so that each individual stimulus was presented twice to each subject over the course of the experiment. Ten sets of motions and three graphical models [26 Dots (referred to as Dots), Ellipse and Jogger in Figure 1A] were selected for the fMRI experiment, while keeping the same randomization procedure.
Functional magnetic resonance imaging (fMRI) study specifications
The 1.5T MRI scanner (Shimadzu-Marconi Magnex ECLIPSE 1.5T) of the Advanced Telecommunications Research Institute brain imaging centre was used to obtain blood oxygen level dependent (BOLD) contrast functional images. Images weighted with the apparent transverse relaxation time (T*2) were obtained with an echo-planar imaging sequence (TR = 2.5 s). Voxel size of 4 × 4 × 4 mm3 with 64 × 64 in-plane voxels covering the whole brain, and 25 slices acquired with 2 mm inter-slice gap gave a total field of view 192 × 192 × 150 mm3. A total of 168 image volumes were acquired for each of the four experimental 7 min sessions. High-resolution T1-weighted images covering the whole brain were also acquired from each subject to improve the localization of activation foci.
Analysis of behaviour
Subjects classified each individual stimulus as artificial or biological in a 2AFC paradigm. Signal Detection Theory (SDT) was used to extract two independent measures from the subjects’ behaviour,sensitivity d ′ and response bias c. SDT requires variance of hits and false alarms to be homogeneous across subjects, models and sessions. The Levene's test of equal variance (at P < 0.05 level of significance) was systematically used to test this assumption before using the standard formulae for 2AFC paradigms to measure the sensitivity d ′:
 |
and the response bias c :
 |
where, Φ is the inverse of the standard normal cumulative function. ‘Hit’ is the proportion of motion capture stimuli correctly classified as biological and ‘False alarm’, the proportion of keyframe stimuli incorrectly classified as biological. ‘Hits’ and ‘False alarms’ were corrected according to the 1/2N rule, where N is the maximum number of responses for each session of the experiment.
The values of d ′ and c were analysed using repeated-measure analyses of variance (ANOVA), using sessions and graphical characters as within-subjects factors and gender as between-subjects factor. Greenhouse–Geisser corrected P-values (GG) are reported, when the sphericity assumption is violated (Mauchly test of sphericity P < 0.05). When ANOVAs indicated a significant effect of the model, pairwise t-tests (for the effect of characters) and linear contrasts (for the effect of sessions) were used to further explore the results. Thresholds of P < 0.001 are considered ‘highly significant’ and thresholds of P < 0.05 are considered ‘significant’. Results obtained with the more lenient threshold of P < 0.1 are reported as ‘marginally significant’, when they address an important experimental hypothesis.
fMRI analysis
We used SPM2 software (SPM2, 2003) for processing and statistical analysis of EPI time series. The first three volumes of each session were discarded to allow for T1 equilibration, while the remaining 165 image volumes were realigned to the first volume and unwarped before a slice-timing correction algorithm was applied. The estimated movement did not exceed 3 mm. A high-resolution T2 image (voxel size: 1 × 1 × 6 mm) acquired before the first functional session with the same slice specifications was spatially normalized to the Montreal Neurological Institute (MNI; Montreal, Canada) reference brain, and normalization parameters were then applied to the EPI time-series. The normalized images with 2 × 2 × 2 mm3 voxels were spatially smoothed by a Gaussian kernel of full width half maximum 8 mm.
First-level single subject analysis modelled the brain response according to the six types of stimuli (three characters × two motions; duration 1 s), irrespective of the subjects’ responses, as well as the two possible responses (left and right clicks; a duration of 0 s was used for SPM2 to model response as events). High-pass cut-off filter (128 s) was applied to remove low frequency signal changes.
The three second-level, random effect, analyses reported here used the same threshold of P < 0.05 corrected for multiple comparisons by false discovery rates (FDR), with an extent k > 50 voxels. The first analysis focused on the brain response to stimulus presentation compared to the implicit baseline, pooling the six types of stimuli together. Data were then analysed as a two (motion) by three (characters) factorial design according to published guidelines (Penny and Henson, 2006), in order to isolate the brain regions, where activity is modulated by each of the two factors and by the interaction term between these factors. Finally, we identified regions whose activity is correlated with the sensitivity and response bias independently of the character used to render motions. Contrasts between brain responses to stimuli based on motion-capture and keyframe data were first computed for each character and for each subject. The resulting 36 (3 characters by 12 subjects) contrast images were entered in second level analyses of covariance including the three characters as explanatory variable and the response bias or the sensitivity as covariate. Non-sphericity correction controlled for subject effects.
Contrast estimates from spherical volumes centred on the maximum of activated clusters of interest, with a radius of 5 mm (extent: mean 69 voxels; s.d. 11 voxels) were extracted and subjected to further analysis with SPSS to assess the significance of the regression (Pearson's R and P regression) and of the effect of characters (P ANOVA) on the activity.
RESULTS
Behavioural results
We used a motion classification task to determine the effect of anthropomorphism of computer graphics characters on the perception of biological motion. Participants were required to classify a briefly presented running motion as biological or artificial, corresponding respectively to the motion capture and keyframe stimuli that were used. A negligible number of trials (seven for the behavioural, and six for the fMRI) were discarded, when subjects did not respond within the dedicated time. Subjects’ responded significantly (P < 0.001) better than chance in both the behavioural experiment [correct answer mean: 0.73, standard error of the mean (s.e.m.) 0.01] and the fMRI experiment (correct answer mean: 0.86, s.e.m. 0.01).
Perceptual experiment
As illustrated in Figure 2A, the ratio of stimuli classified as biological depends mainly on the origin of the stimulus (motion capture or keyframe), but it is also influenced by the character used to render the motion. SDT was used to extract two independent measures from the subjects’ behaviour taking into account responses to both motion capture and keyframe animations. The sensitivity d ′ describes the discriminability of biological and artificial motions by the sensory system, illustrating how the two types of motions can be distinguished on the basis of their perceptible features. The response bias c reflects the tendency towards answering biological, and indicates to what extent the subjects considered the perceived motion as natural. As the same motion sets are used to animate all characters, differences in sensitivity and response bias can only be explained taking into account the characteristics of the graphical character used to render the movement.
Fig. 2.

Behavioural results. (A) Ratio (±s.e.m.) of motion capture (striped bars) and keyframe (plain bars) classified as biological as a function of the character used to render the motion. (B) Sensitivity d′ and bias c as a function of the character used during the behavioural experiment (n = 12). Top: graphs show the mean sensitivity d′ or bias c (±s.e.m.). Bottom: The tables give the mean value and s.e.m. of d′ or c and the significance P of the pairwise t-tests comparisons between pairs of models, with greyscale indicating level of significance.
Characters (F6,66 = 8.32, P < 0.001) and sessions (F3,33 = 6.14, P = 0.002) have a significant effect on sensitivity, but only the characters have an significant effect on the response bias (GG F6,66 = 16.29, P < 0.001). Paired t-tests indicate that sensitivity is significantly smaller and the bias larger for the two dots characters (see statistical significance of pairwise t-tests comparisons in Figure 2B for sensitivity and in Figure 2C for bias). When only full characters are used in the statistical analysis, the effect of characters on sensitivity is not significant (F4,44 = 1.35, P = 0.3), but significant on bias (F4,44 = 2.69, P < 0.05). Paired t-tests on the response bias for the full characters identify two groups: differences between the response bias to the ellipse and the robot characters, on the one hand, and between the monster, clown and jogger characters on the other hand, are not significant, whereas all pairwise comparisons between characters from these two groups are significant (Figure 2C). There is also a significant increasing linear trend in sensitivity with sessions (F1,11 = 14.84, P = 0.003; Figure 3). The effect of the between-subject factor gender on sensitivity and bias is not significant (all P > 0.5).
Fig. 3.

Variation (±s.e.m.) of the sensitivity to the biological motion d′ and of the response bias c in the course of the behavioural experiment (sessions 1 to 4) for the different characters, indicated by colour code as in previous figures.
fMRI experiment
The same participants underwent the fMRI experiment the day following the behavioural experiment. The fMRI experiment used one character from each of the three groups isolated using the behavioural response bias (Dots, Ellipse, Jogger). As for the behavioural experiment, the effect of the between-subject factor gender on sensitivity and bias is not significant (all P > 0.5). In contrast with the behavioural experiment, neither sessions (P = 0.5) nor characters (GG P = 0.3) have a significant effect on sensitivity during the fMRI recordings (Dots: mean 1.36, s.e.m. 0.06, Ellipses: 1.50 s.e.m. 0.05, Jogger: 1.50 s.e.m. 0.06). In addition, these sensitivity scores are similar to those achieved in the last session of the behavioural experiment (Dots: 1.02 s.e.m. 0.08, Ellipses 1.27 s.e.m. 0.08, Jogger 1.36 s.e.m. 0.08).
In contrast, results regarding the bias are in line with those of the first experiment. ANOVA indicates a highly significant effect of characters on response bias (F2,22 = 14.55, P < 0.001) without significant effect of sessions (GG P = 0.9). Pairwise comparisons between characters are all highly significant (P < 0.001), with an increase of the bias to respond biological from the Jogger (mean: −0.11, s.e.m.: 0.06), Ellipse (0.06 ± 0.05) and Dots (0.21 ± 0.04) characters. Taken together, these results indicate that the bias towards answering biological for less anthropomorphic characters survives repeated exposure to the characters, while sensitivity for the two types of motions increases and reaches a maximum after repeated exposure. The behavioural experiment ensured that subjects had reached their maximal sensitivity prior to the fMRI experiment, so that no major behavioural changes would take place during scanning.
Neuroimaging results
Results from the main effect of stimulus presentation across all types of stimuli are given in Table 1 and illustrated in Figure 4, top panel. Regions of the temporal and occipital lobes were expected in response to the presentations of biological motion on the basis of their acknowledged functions. By comparing the activation map (FDR-corrected P < 0.05, k > 50) with published coordinates of identified temporo–occipital functional regions, it appears that the cluster covers areas MT/V5 (Watson et al., 1993), specialized in motion perception, and EBA (Downing et al., 2001), involved in the perception of body parts. Superior occipital gyrus is likely to belong to the visual area V3 or the posterior part of the intraparietal sulcus, where recent comparative work between human and monkeys have shown a specifically human system involved in extracting form information from motion (Orban et al., 2005). Ventral occipital activity, in the lingual gyrus bilaterally and right fusiform gyrus belongs to the ventral stream of visual processing specialized in shape analysis, and contains areas FBA and FFA, specialized in perception of bodies and faces, respectively (Schwarzlose et al., 2005). Occipital areas not only respond to external stimuli in a bottom-up fashion, they also receive top-down modulation by attention. The neural correlates of this attentional control have been reported in right inferior ventral prefrontal regions such as the one reported in Table 1 (Buchel et al., 1998). Surprisingly, only with a more lenient threshold (P < 0.001 uncorrected, no extent threshold) was a cluster found in the superior and posterior temporal region (right posterior superior temporal sulcus, PFDR_corrected: 0.016, Z-score: 3.62, extent: 7 voxels, coordinates x = 48, y = −38, z = 10), while this brain area is believed to integrate from information carried by the ventral stream and motion information carried by the dorsal stream of visual processing during biological motion perception on the basis of macaque monkey electrophysiology (Oram and Perrett, 1996) and human neuroimaging experiments (Allison et al., 2000).
Table 1.
Regions activated in response to the presentation of stimuli, ordered by decreasing z-coordinate (FDR-corrected P < 0.05, k > 50).
| Location |
SPM analysis |
||||||
|---|---|---|---|---|---|---|---|
| Anatomy | x | y | z | FDR-cor P | Z-score | Extent | |
| Right | Superior occipital gyrus | 14 | −88 | 28 | 0.017 | 3.56 | 64 |
| Left | Superior occipital gyrus | −18 | −90 | 28 | 0.005 | 4.73 | 148 |
| Right | Inferior frontal gyrus | 44 | 4 | 28 | 0.019 | 3.50 | 151 |
| Left | Caudate nucleus | −24 | −18 | 26 | 0.012 | 3.83 | 156 |
| Right | Head of caudate nucleus | 14 | 24 | 12 | 0.020 | 3.46 | 60 |
| Left | Head of caudate nucleus | −16 | 22 | 10 | 0.010 | 4.15 | 191 |
| Right | Anterior insula | 32 | 24 | 0 | 0.025 | 3.33 | 87 |
| Left | Temporo–occipital junction | −44 | −74 | 2 | 0.008 | 4.26 | 801 |
| Right | Anterior calcarine sulcus | 24 | −52 | −2 | 0.012 | 3.82 | 207 |
| Right | Temporo–occipital junction | 46 | −50 | −10 | 0.004 | 5.31 | 1295 |
| Right | Fusiform gyrus | 42 | −64 | −18 | 0.004 | 4.91 | 792 |
| Right | Lingual gyrus | 32 | −58 | −16 | 0.007 | 4.50 | 250 |
| Left | Lingual gyrus | −38 | −52 | −18 | 0.007 | 4.57 | 718 |
| Left | Cerebellum | −8 | −76 | −18 | 0.007 | 4.58 | 460 |
Fig. 4.

Standard brain render showing results of the random effect analysis (t-test) of the effect of stimulus presentation across models and types of motions (FDR-corrected P < 0.05, k > 50 voxels) at the top and of the activity positively (hot scale) and negatively (cold scale) correlated with the response bias (FDR-corrected P < 0.05, k > 50) at the bottom.
The second analysis used an ANOVA approach (Penny and Henson, 2006) to identify brain regions whose activity is significantly modulated by the two factors manipulated in the experiment, the origin of the motion (motion capture, keyframe) and the characters (Dots, Ellipse, Jogger) used to render it, and the interaction between these factors. No voxel survived at the threshold used (P < 0.05 FDR-corrected) in response to the main effect of and interaction between the two factors. Activity in a cluster in the right superior temporal sulcus (PFDR_corrected: 0.396, Z-score: 4.28, extent: 69 voxels, coordinates 60, −18, −2) was modulated by the origin of the motion with a more lenient threshold (P < 0.001 uncorrected), with increase for motion capture compared to keyframe stimuli. Similarly, a number of clusters in the occipital lobe [bilateral middle occipital (Right: PFDR_corrected: 0.086, Z-score: 4.70, extent: 109 voxels, coordinates 36, −76, 2; left: PFDR_corrected: 0.097, Z-score: 3.95, extent: 120 voxels, coordinates −14, −96, 16), and superior occipital (PFDR_corrected: 0.396, Z-score: 4.28, extent: 69 voxels, coordinates 60, −18, −2) gyri] as well as a cluster in the right posterior superior temporal gyrus (PFDR_corrected: 0.086, Z-score: 4.47, extent: 74 voxels, coordinates 54, −36, 20) were affected by the character used to render the motion using the more lenient threshold (P < 0.001 uncorrected).
The low statistical significance of the results reported here, which focused on the effect of independent variables on the brain response, suggests that individuals differed in their neural responses to the different types of motion and characters. This could be explained by individual differences in subjects’ experience of computer-animated agents, though we have no objective measure of their experience to address this issue. Individual differences were controlled by adding a dependent variable related to behaviour in the last analyses using analysis of covariances (ANCOVAs) in order to identify brain regions in which activity in the contrasts between motion capture and keyframe stimuli are correlated with the sensitivity d′ or the response bias c. Behavioural results indicate that characters have no significant effect on sensitivity, but significantly affect the response bias during the fMRI experiment. No brain region was found to correlate with sensitivity at the thresholds used. Brain areas significantly correlated to the bias, both positively and negatively, are given in Table 2 and illustrated in Figure 4, bottom panel. Positively correlated regions were found in the temporal cortex bilaterally, the PreC and the ACC. Negatively correlated areas are found in the right ventral premotor cortex and posterior intraparietal sulcus.
Table 2.
SPM (FDR-corrected P < 0.05, k > 50) and the SPSS (regression with the bias: Pearson's R and P regression, and effect of characters: P ANOVA) statistical analysis of regions showing significant correlation with the bias.
| Location |
SPM analysis |
SPSS analysis on VOI |
||||||||
|---|---|---|---|---|---|---|---|---|---|---|
| Anatomy | x | y | z | FDR-cor P | Z-score | Extent | R | P regression | P ANOVA | |
| Positive correlation with the bias | ||||||||||
| Bilateral | Precuneus | −4 | −60 | 32 | 0.012 | 4.88 | 448 | 0.71 | <0.001 | 0.106 |
| Left | Temporo–parietal junction | −46 | −64 | 26 | 0.015 | 4.43 | 395 | 0.70 | <0.001 | 0.217 |
| Right | Superior temporal gyrus | 2 | −16 | 16 | 0.018 | 4.00 | 84 | 0.63 | <0.001 | 0.121 |
| Bilateral | Anterior cingulate cortex | 4 | 40 | 14 | 0.016 | 4.21 | 425 | 0.56 | <0.001 | 0.615 |
| Left | Superior temporal sulcus | −56 | −16 | −10 | 0.015 | 4.39 | 111 | 0.63 | <0.001 | 0.288 |
| Negative correlation with the bias | ||||||||||
| Right | Intraparietal sulcus | 34 | −60 | 46 | 0.031 | 4.58 | 73 | −0.58 | <0.001 | 0.209 |
| Right | Ventral premotor cortex | 50 | 10 | 36 | 0.031 | 4.58 | 271 | −0.60 | <0.001 | 0.396 |
Results of the SPM random effect-analysis were confirmed using regression between the extracted contrast estimates in volumes of interest centred on the maximum of the activated cluster and the bias in SPSS. In addition, ANOVA using the characters as the factor of interest were used to ensure that the positive response to the bias could not be explained by a differential response to characters. As indicated on the right of Table 2, all regressions were found to be significant at P < 0.001, and in no case was the effect of the character significant on the contrast estimate. Regressions are illustrated for two regions of particular interest, the left TPJ and the ACC in Figure 5. This independence results from the SPM analysis itself as characters and bias were modelled independently.
Fig. 5.

Regression of contrast estimates between the brain response to animations based on motion capture and on key frames for the three characters used in the fMRI experiment (red: Dots, green: Ellipse, blue: Jogger) and the response bias. Coefficient of correlation and significance is given on the top left of each panel.
Activity in these regions is therefore both correlated with bias and independent of the characters used to render the motion. A likely explanation invokes differences between subjects. At the level of individual subjects, the bias reflects how natural a motion is perceived, irrespectively of the characters used to render the motion. While the response bias decreases when anthropomorphism increases in the group analysis, there are individual differences. It follows that brain regions correlated with the bias reflect neural mechanisms underlying subjects’ perceived naturalness of the motion which are not significantly affected by the characters used to render the motion at the level of the group analysis. This explanation is in line with the absence of main effects of characters and of motions in the ANOVA analysis of brain responses, when thresholds corrected for multiple comparisons are used.
DISCUSSION
We used a motion classification task to determine the effect of anthropomorphism of computer-animated characters on the perception of biological motion. We purposefully used a simple and familiar running motion to ensure all individuals participating in the experiment had a personal experience with the action.
Characters used to render the motion significantly affect sensitivity d ′, which describes the discriminability of the motions, and response bias c, which indicates the preference toward answering ‘Biological’. Compared with fully rendered characters, dots characters lead to decreased sensitivity. A previous experiment showed that subjects are better able to discriminate motion variations with a fully rendered character than with a stick figure (Hodgins et al., 1998). Subtleties of the motion used for discrimination are less perceptible when sparse graphical models such as dot or stick figures are used. Taken together, the low sensitivity and positive response bias of the dots characters may explain why synthetic movements are readily accepted as human when rendered with point-light displays (Cutting, 1978). This large difference of behaviour between dots and full characters motivated the exclusion of dots when assessing statistically whether full characters have an effect on a behavioural measure. Results demonstrate that full characters have no effect on sensitivity d ′ but do have a significant effect on the response bias c.
Full characters yield a negative response bias c in comparison to the dots, indicating a reduced tendency to report the motion as biological. Pairwise comparisons of response bias characterize two groups of full characters. The robot and ellipse characters have an intermediate bias between the dots and the other full characters, the jogger, clown and monster. The later characters depict fleshy articulated bodies with anthropomorphic features such as eyes, mouth, hands and ears, and the monster was perceived as a ‘human wearing a costume’ in preliminary experiments. In contrast, the robot's body is made of metallic rods and the ellipse character, of disconnected volumes, both models being partially transparent. Therefore, the decrease of the response bias from the dots, the robot and ellipse characters, and the jogger, clown and monster characters parallels the addition of anthropomorphic features: motions rendered with anthropomorphic characters are perceived as less natural.
What can explain this negative bias of anthropomorphism during perception of artificial characters’ actions? The ‘Uncanny Valley of Eeriness’ proposal states that artificial designs attempting imperfectly to reproduce human form would trigger a negative emotional response, which could be responsible for the negative anthropomorphic bias. For example, the full characters used in these studies had no facial expressions or motion, only simple rules for adjusting the motion of the skin across joints and rigid clothing. The biological motion was also imperfect in that it was captured to approximate the motion of the skeleton but motion of the muscles, hair, or detailed motion of the hands was neither captured nor rendered. Imperfections of both characters and motions could more strongly induce the negative emotional response postulated by the ‘Uncanny Valley’ hypothesis for the more anthropomorphic characters.
Alternatively, the perceptual decision could use an internal model of the running action. In that case, a breach from expectations of the combined motion and form cues would results in motions being perceived as atypical and less natural, in the absence of emotional response. The neural substrate of the response bias was investigated using fMRI in order to disentangle these two possibilities with a focus on the neural substrates of emotions and action perception.
The response bias describing the tendency to perceive the motion as natural is negatively correlated with activity in the right ventral premotor and posterior parietal cortices, which both contribute to controlling attention (Rees et al., 1997; Buchel et al., 1998). Balance between activity in the lateral and medial prefrontal cortices is associated with balance between integration of information about visual motion and reaching a decision about the nature of the stimulus (Chaminade and Fonlupt, 2003). The finding that the bias is negatively correlated with activity in regions controlling allocation of attention suggests that the tendency to report the motion as artificial requires more attention than reporting it as biological, i.e. that biological motion perception would be automatic, while reporting a motion as artificial would be more demanding cognitively.
More interestingly, the right inferior frontal and intraparietal sulcus clusters of activity negatively correlated with the response bias could be attributed to the involvement of the mirror system (Rizzolatti and Craighero, 2004). For example, a similar right intraparietal sulcus region was reported in a study of the influence of motor expertise on observation of whole body action (Calvo-Merino et al., 2005), and a right ventral premotor region, in a study of biological motion perception (Saygin et al., 2004). While confirming an influence of the motor resonance on action observation, this interpretation contradicts a simple role in action understanding as its activity correlates to a stimulus being reported as an artificial, in contrast to a biological, action. Yet, the finding that the regions negatively correlated with the response bias, which is itself negatively correlated with anthropomorphism, belong to the mirror system is in line with the idea that a anthropomorphic rendering of the body is necessary to induce mirror system activity (Rizzolatti and Craighero, 2004). A similar conclusion has already been reached using a motor interference paradigm, which tackles motor resonance specifically. An interference effect due to the observation of movements incongruent with the executed movements was observed when the subjects were facing a human or, to a lesser degree, a humanoid robot, but not when facing a simple robotic arm (Oztop et al., 2005). Altogether, these results corroborate the hypothesis that anthropomorphism facilitates motor resonance, but they also suggest that motor resonance is not sufficient to perceive an action as being natural.
The response bias is positively correlated to activity in the left TPJ and STS, the right STG, as well as in the ACC and PreC. The STS has been repeatedly associated with biological motion perception in primates (Allison et al., 2000; Puce and Perrett, 2003), and has been shown in the monkey to integrate form and motion information when perceiving actions (Oram and Perrett, 1996; Jellema et al., 2004). In agreement with the global processing hypothesis (Bertenthal and Pinto, 1994), computational models (Giese and Poggio, 2003; Lange and Lappe, 2006) have proposed that ‘templates’ of configural body cues, roughly corresponding to snapshots of actions, are used when recognizing point-light displays and can be found in the STS. The STS is thus involved in extrapolating form from motion, a phenomenon potent enough to override scrambled depth information when using a stereoscopic point-light displays (Bulthoff et al., 1998). Likewise, extrapolation of the body structure from motion could cause the artificial motion of the less anthropomorphic characters in our experiment to be readily accepted as natural. The keyframe stimuli maintain the relationships between the body parts by using the same skeleton as the motion-capture stimuli, and similarly depict a running action albeit one that is not dynamically valid. Therefore, body structure can still be extracted from motion as readily as with motion-capture stimuli, possibly leading to a percept of natural motion. In other words, the extrapolation of form from motion overrides perception of flaws in the artificial motion, when it is rendered with the Dots characters. This interpretation, corroborated by the positive correlation between STS activity and the response bias, could explain both the lack of sensitivity—form can be extracted similarly from motion capture and keyframe stimuli—and the high bias—form extrapolated from motion is perceived as natural—for point-light displays in our experiment. In addition, the response bias is present across subjects and, in contrast to sensitivity, it is not influenced by repetition of the stimuli across sessions (Figure 3). This implies that the response bias originates in normal visual perception mechanisms, and explains why even synthetic movements rendered with point-light displays are readily accepted as natural (Cutting, 1978). Altogether, these results suggest that caution should be exerted when extrapolating results from investigations using point-light displays to any type of biological motion perception.
The response bias is negatively correlated with the complexity of the stimuli, for example the presence of a full body or the quantity of pixels moving in the stimuli, so that brain activity related to this complexity should be, if anything, negatively correlated with the bias. This suggests that the STS region is the target of top-down influences at play in our motion classification task. Other clusters correlated with the response bias could be the source of top-down influences on the STS. Activity is reported in regions that have repeatedly been associated with mentalizing [TPJ (Frith and Frith, 1999; Saxe and Kanwisher, 2003), ACC (Amodio and Frith, 2006) and PreC (Cavanna and Trimble, 2006)], which describes reasoning about the content of other individuals’ mental states.
The ACC has also been associated with emotional tasks (Bush et al., 2000) and human and animal research suggest an role in attentional processing of emotional stimuli (see discussion of the function of the ACC in Davidson and Irwin, 1999). Was the correlation of the ACC activity with the anthropomorphic bias associated with such a processing of the emotional content of stimuli, we would expect additional clusters of activity in other areas related to emotional processing such as the amygdala or the insular and orbitofrontal cortices (Davidson and Irwin, 1999). The absence of activity in these and other regions of the limbic system in Table 2 argues against a role of emotions in the anthropomorphic bias, and thus against a literal interpretation of the ‘Uncanny Valley of Eeriness’ proposal (Mori, 1970).
Alternatively, the ACC is implied in the ‘meta-cognitive process of reflecting on feelings and intentions’, and its activity is related to the degree of familiarity with the object of mentalization (Amodio and Frith, 2006). This interpretation suggests a causal relation between subjective familiarity of the character used in a stimulus and tendency to report its motion as biological (response bias). The fact that analyses focused on the characters failed to reach significance further suggests that, at the group level, the brain activity pertains to the subjective perception of the artificial agents used as stimuli rather than to their intrinsic features. Therefore, the finding that the response bias correlates with activity in the ACC, as well as in the left STS region discussed earlier and in the right TPJ (Frith and Frith, 1999), suggests that deciding whether the source of an observed action is natural (responding ‘Biological’) involves a mentalizing process. This interpretation makes sense as perception of action is inherently linked to the attribution of intention to the agent (Blakemore and Decety, 2001). In other words, the actions of characters favouring mentalization, not motor resonance, are perceived as biological.
CONCLUSION
Using a biological motion classification task, we found that the tendency to perceive a simple running motion as natural is modulated by the appearance of the character used to render the motion. Anthropomorphism of artificial agents decreases the tendency to report their motion as biological, and an fMRI investigation found that the response bias towards ‘biological’ is correlated with an increase of activity in regions involved in mentalizing and a decrease of activity in regions belonging to the mirror system. This experimental paradigm, based on the use of artificial agents, therefore allows the dissociation of the brain activity in these two key networks of social cognition, and should now be used to explore systematically, which features of artificial agents favour mentalizing in order to optimize them for entertainment, research or therapeutic purposes.
Acknowledgments
T.C. was supported by a Japan Trust grant. We thank Moshe Mahler for recording the motion capture data and creating the animated models, and insightful comments from Chris Frith on earlier versions of this manuscript. Carnegie Mellon University would like to thank Autodesk for the donation of licenses for their Maya software. J.K.H. was supported in part by NSF Grant IIS-0326322.
Footnotes
Conflict of Interest
None declared.
REFERENCES
- Allison T, Puce A, McCarthy G. Social perception from visual cues: role of the STS region. Trends in Cognitive Sciences. 2000;4(7):267–78. doi: 10.1016/s1364-6613(00)01501-1. [DOI] [PubMed] [Google Scholar]
- Amodio DM, Frith CD. Meeting of minds: the medial frontal cortex and social cognition. Nature Reviews Neuroscience. 2006;7(4):268–77. doi: 10.1038/nrn1884. [DOI] [PubMed] [Google Scholar]
- Bertenthal BI, Pinto J. Global processing of biological motions. Psychological Science. 1994;5(4):221–4. [Google Scholar]
- Blakemore SJ, Decety J. From the perception of action to the understanding of intention. Nature Reviews Neuroscience. 2001;2(8):561–7. doi: 10.1038/35086023. [DOI] [PubMed] [Google Scholar]
- Buchel C, Josephs O, Rees G, Turner R, Frith CD, Friston KJ. The functional anatomy of attention to visual motion. A functional MRI study. Brain. 1998;121(Pt 7):1281–94. doi: 10.1093/brain/121.7.1281. [DOI] [PubMed] [Google Scholar]
- Bulthoff I, Bulthoff H, Sinha P. Top-down influences on stereoscopic depth-perception. Nature Neuroscience. 1998;1(3):254–7. doi: 10.1038/699. [DOI] [PubMed] [Google Scholar]
- Bush G, Luu P, Posner MI. Cognitive and emotional influences in anterior cingulate cortex. Trends in Cognitive Sciences. 2000;4(6):215–22. doi: 10.1016/s1364-6613(00)01483-2. [DOI] [PubMed] [Google Scholar]
- Calvo-Merino B, Glaser DE, Grezes J, Passingham RE, Haggard P. Action observation and acquired motor skills: an FMRI study with expert dancers. Cerebral Cortex. 2005;15(8):1243–9. doi: 10.1093/cercor/bhi007. [DOI] [PubMed] [Google Scholar]
- Cavanna AE, Trimble MR. The precuneus: a review of its functional anatomy and behavioural correlates. Brain. 2006;129(Pt 3):564–83. doi: 10.1093/brain/awl004. [DOI] [PubMed] [Google Scholar]
- Chaminade T, Fonlupt P. Changes of effective connectivity between the lateral and medial parts of the prefrontal cortex during a visual task. European Journal of Neuroscience. 2003;18(3):675–9. doi: 10.1046/j.1460-9568.2003.02787.x. [DOI] [PubMed] [Google Scholar]
- Cutting JE. Generation of synthetic male and female walkers through manipulation of a biomechanical invariant. Perception. 1978;7(4):393–405. doi: 10.1068/p070393. [DOI] [PubMed] [Google Scholar]
- Davidson RJ, Irwin W. The functional neuroanatomy of emotion and affective style. Trends in Cognitive Sciences. 1999;3(1):11–21. doi: 10.1016/s1364-6613(98)01265-0. [DOI] [PubMed] [Google Scholar]
- Decety J, Chaminade T, Grezes J, Meltzoff AN. A PET exploration of the neural mechanisms involved in reciprocal imitation. Neuroimage. 2002;15(1):265–72. doi: 10.1006/nimg.2001.0938. [DOI] [PubMed] [Google Scholar]
- Decety J, Chaminade T. When the self represents the other: a new cognitive neuroscience view on psychological identification. Consciousness and Cognition. 2003;12(4):577–96. doi: 10.1016/s1053-8100(03)00076-x. [DOI] [PubMed] [Google Scholar]
- Downing PE, Jiang Y, Shuman M, Kanwisher N. A cortical area selective for visual processing of the human body. Science. 2001;293(5539):2470–3. doi: 10.1126/science.1063414. [DOI] [PubMed] [Google Scholar]
- Frith CD, Frith U. Interacting minds–a biological basis. Science. 1999;286(5445):1692–5. doi: 10.1126/science.286.5445.1692. [DOI] [PubMed] [Google Scholar]
- Gallese V, Keysers C, Rizzolatti G. A unifying view of the basis of social cognition. Trends in Cognitive Sciences. 2004;8(9):396–403. doi: 10.1016/j.tics.2004.07.002. [DOI] [PubMed] [Google Scholar]
- Giese MA, Poggio T. Neural mechanisms for the recognition of biological movements. Nature Reviews of Neurosciences. 2003;4(3):179–92. doi: 10.1038/nrn1057. [DOI] [PubMed] [Google Scholar]
- Grezes J, Frith C, Passingham RE. Brain mechanisms for inferring deceit in the actions of others. Journal of Neurosciences. 2004a;24(24):5500–5. doi: 10.1523/JNEUROSCI.0219-04.2004. [DOI] [PMC free article] [PubMed] [Google Scholar]
- Grezes J, Frith CD, Passingham RE. Inferring false beliefs from the actions of oneself and others: an fMRI study. Neuroimage. 2004b;21(2):744–50. doi: 10.1016/S1053-8119(03)00665-7. [DOI] [PubMed] [Google Scholar]
- Hodgins JK, O'Brien J-F, Tumblin J. Perception of human motion with different geometric models. IEEE Transactions on Visualization and Computer Graphics. 1998;4(4):307–16. [Google Scholar]
- Jellema T, Maassen G, Perrett DI. Single cell integration of animate form, motion and location in the superior temporal cortex of the macaque monkey. Cerebral Cortex. 2004;14(7):781–90. doi: 10.1093/cercor/bhh038. [DOI] [PubMed] [Google Scholar]
- Johansson G. Visual perception of biological motion and a model for its analysis. Perception & Psychophysics. 1973;14:201–11. [Google Scholar]
- Klinger E, Bouchard S, Legeron P, et al. Virtual reality therapy versus cognitive behavior therapy for social phobia: a preliminary controlled study. Cyberpsychology and Behavior. 2005;8(1):76–88. doi: 10.1089/cpb.2005.8.76. [DOI] [PubMed] [Google Scholar]
- Lange J, Lappe M. A model of biological motion perception from configural form cues. Journal of Neurosciences. 2006;26(11):2894–906. doi: 10.1523/JNEUROSCI.4915-05.2006. [DOI] [PMC free article] [PubMed] [Google Scholar]
- Levi S. Why Tom Hanks is less than human. While sensors can not capture how humans act, humans can give life to digital characters. Newsweek. 2004;650:305–6. [Google Scholar]
- Merleau-Ponty M. Phenomenology of Perception. Transl. C Smith. London: Routledge; 1962. [Google Scholar]
- Mori M. The valley of eeriness (Japanese) Energy. 1970;7(4):33–5. [Google Scholar]
- Neri P, Morrone MC, Burr DC. Seeing biological motion. Nature. 1998;395(6705):894–6. doi: 10.1038/27661. [DOI] [PubMed] [Google Scholar]
- Oram MW, Perrett DI. Integration of form and motion in the anterior superior temporal polysensory area (STPa) of the macaque monkey. Journal of Neurophysiology. 1996;76(1):109–29. doi: 10.1152/jn.1996.76.1.109. [DOI] [PubMed] [Google Scholar]
- Orban GA, Claeys K, Nelissen K, et al. Mapping the parietal cortex of human and non-human primates. Neuropsychologia. 2005;44:2647–67. doi: 10.1016/j.neuropsychologia.2005.11.001. [DOI] [PubMed] [Google Scholar]
- Oztop E, Franklin D, Chaminade T, Gordon C. Human-humanoid interaction: is a humanoid robot perceived as a human. Internation Journal of Humanoid Robotics. 2005;2(4):537–59. [Google Scholar]
- Peelen MV, Wiggett AJ, Downing PE. Patterns of fMRI activity dissociate overlapping functional brain areas that respond to biological motion. Neuron. 2006;49(6):815–22. doi: 10.1016/j.neuron.2006.02.004. [DOI] [PubMed] [Google Scholar]
- Pelphrey KA, Mitchell TV, McKeown MJ, Goldstein J, Allison T, McCarthy G. Brain activity evoked by the perception of human walking: controlling for meaningful coherent motion. Journal of Neurosciences. 2003;23(17):6819–25. doi: 10.1523/JNEUROSCI.23-17-06819.2003. [DOI] [PMC free article] [PubMed] [Google Scholar]
- Penny W, Henson R. Analysis of variance. In: Friston K, Ashburner J, Kiebel S, editors. Statistical Parametric Mapping. Elsevier; 2006. [Google Scholar]
- Pertaub DP, Slater M, Barker C. An experiment on fear of public speaking in virtual reality. Studies in Health Technology Informatics. 2001;81:372–8. [PubMed] [Google Scholar]
- Puce A, Perrett D. Electrophysiology and brain imaging of biological motion. Philosophical Transactions of the Royal Society London B Biological Science. 2003;358(1431):435–45. doi: 10.1098/rstb.2002.1221. [DOI] [PMC free article] [PubMed] [Google Scholar]
- Puce A, Syngeniotis A, Thompson JC, Abbott DF, Wheaton KJ, Castiello U. The human temporal lobe integrates facial form and motion: evidence from fMRI and ERP studies. Neuroimage. 2003;19(3):861–9. doi: 10.1016/s1053-8119(03)00189-7. [DOI] [PubMed] [Google Scholar]
- Rees G, Frackowiak R, Frith C. Two modulatory effects of attention that mediate object categorization in human cortex. Science. 1997;275(5301):835–8. doi: 10.1126/science.275.5301.835. [DOI] [PubMed] [Google Scholar]
- Rizzolatti G, Fogassi L, Gallese V. Neurophysiological mechanisms underlying the understanding and imitation of action. Nature Reviews Neuroscience. 2001;2(9):661–70. doi: 10.1038/35090060. [DOI] [PubMed] [Google Scholar]
- Rizzolatti G, Craighero L. The mirror-neuron system. Annual Reviews of Neuroscience. 2004;27:169–92. doi: 10.1146/annurev.neuro.27.070203.144230. [DOI] [PubMed] [Google Scholar]
- Roy S, Klinger E, Legeron P, Lauer F, Chemin I, Nugues P. Definition of a VR-based protocol to treat social phobia. Cyberpsychological Behavior. 2003;6(4):411–20. doi: 10.1089/109493103322278808. [DOI] [PubMed] [Google Scholar]
- Saxe R, Kanwisher N. People thinking about thinking people. The role of the temporo-parietal junction in “theory of mind”. Neuroimage. 2003;19(4):1835–42. doi: 10.1016/s1053-8119(03)00230-1. [DOI] [PubMed] [Google Scholar]
- Saygin AP, Wilson SM, Hagler DJ, Jr, Bates E, Sereno MI. Point-light biological motion perception activates human premotor cortex. Journal of Neurosciences. 2004;24(27):6181–8. doi: 10.1523/JNEUROSCI.0504-04.2004. [DOI] [PMC free article] [PubMed] [Google Scholar]
- Schilbach L, Wohlschlaeger AM, Kraemer NC, et al. Being with virtual others: neural correlates of social interaction. Neuropsychologia. 2006;44(5):718–30. doi: 10.1016/j.neuropsychologia.2005.07.017. [DOI] [PubMed] [Google Scholar]
- Schwarzlose RF, Baker CI, Kanwisher N. Separate face and body selectivity on the fusiform gyrus. Journal of Neurosciences. 2005;25(47):11055–9. doi: 10.1523/JNEUROSCI.2621-05.2005. [DOI] [PMC free article] [PubMed] [Google Scholar]
- SPM2. Statistical parametric mapping 2. 2003 May 12; from http://www.fil.ion.ucl.ac.uk/spm/
- Tarr MJ, Warren WH. Virtual reality in behavioral neuroscience and beyond. Nature Neuroscience. 2002;5(Suppl. 1):1089–92. doi: 10.1038/nn948. [DOI] [PubMed] [Google Scholar]
- Thompson JC, Clarke M, Stewart T, Puce A. Configural processing of biological motion in human superior temporal sulcus. Journal of Neurosciences. 2005;25(39):9059–66. doi: 10.1523/JNEUROSCI.2129-05.2005. [DOI] [PMC free article] [PubMed] [Google Scholar]
- Vaina LM, Solomon J, Chowdhury S, Sinha P, Belliveau JW. Functional neuroanatomy of biological motion perception in humans. Proceedings of National Academy of Sciences USA; 2001. pp. 11656–61. [DOI] [PMC free article] [PubMed] [Google Scholar]
- Verfaillie K. Perceiving human locomotion: priming effects in direction discrimination. Brain and Cognition. 2000;44(2):192–213. doi: 10.1006/brcg.2000.1228. [DOI] [PubMed] [Google Scholar]
- Watson JD, Myers R, Frackowiak RS, et al. Area V5 of the human brain: evidence from a combined study using positron emission tomography and magnetic resonance imaging. Cerebral Cortex. 1993;3(2):79–94. doi: 10.1093/cercor/3.2.79. [DOI] [PubMed] [Google Scholar]