

Abstract
PTH promotes bone catabolism by targeting bone marrow stromal cells (SCs) and their osteoblastic progeny. Here we show that a continuous infusion of PTH that mimics hyperparathyroidism fails to induce osteoclast formation, bone resorption and cortical bone loss in mice lacking T cells. T cells provide proliferative and survival cues to SCs and sensitize SCs to PTH through CD40 Ligand (CD40L), a surface molecule of activated T cells that induces CD40 signaling in SCs. As a result, deletion of T cells or T cell expressed CD40L blunts the bone catabolic activity of PTH by decreasing bone marrow SC number, RANKL/OPG production and osteoclastogenic activity. Therefore, T cells play an essential permissive role in hyperparathyroidism as they influence SC proliferation, lifespan and function through CD40L. T cell-SC cross-talk pathways may thus provide pharmacological targets for PTH induced bone disease.
INTRODUCTION
Chronic excessive production of Parathyroid hormone (PTH) is a cause of skeletal and extra skeletal disease. Secondary hyperparathyroidism has been implicated in the pathogenesis of senile osteoporosis (Riggs and Melton, 1986), while primary hyperparathyroidism (PHP), is associated with accelerated bone loss (Grey et al., 1996), osteopenia (Parisien et al., 2001; Potts, 1998; Silverberg et al., 1989), and increased bone turnover (Parisien et al., 2001), an independent risk factor for fractures. Furthermore, PHP is a cause of extra-skeletal manifestations stemming from increased bone resorption such as hypercalcemia, recurrent nephrolithiasis, renal failure, peptic ulcers and mental changes (Potts, 1998).
PHP and secondary hyperparathyroidism are mimicked by continuous PTH infusion, while intermittent PTH administration is an approved treatment modality for osteoporosis (Canalis et al., 2007). Both continuous PTH and intermittent PTH increase bone turnover in trabecular and cortical bone, as evidenced by elevations in histomorphometric and biochemical markers of resorption and formation (Dempster et al., 1999; Iida-Klein et al., 2005,Qin, 2004 #5315; Zhou et al., 2001). PHP and continuous PTH treatment cause cortical bone loss by enhancing endosteal resorption through stimulation of osteoclast (OC) formation and activity (Iida-Klein et al., 2005; Lotinun et al., 2004; Potts, 1998). Severe chronic elevations of PTH levels may also lead to trabecular bone loss (Iida-Klein et al., 2005; Potts, 1998), although PHP and continuous PTH treatment often induce a modest increase in cancellous bone (Parisien et al., 2001; Silverberg et al., 1989; Zhou et al., 2001). In contrast, intermittent PTH treatment markedly increase trabecular bone volume due to a preponderant stimulation of trabecular bone formation, and causes a small loss of cortical bone (Dempster et al., 1993; Neer et al., 2001).
The biological activities of PTH result from its binding to the PTH/PTH-related protein (PTHrP) receptor (PPR or PTH-1R), expressed on bone marrow (BM) SCs and their osteoblastic progeny (Calvi et al., 2001; Qin et al., 2004). The catabolic effect of PTH has been shown to be mediated, in part, by enhanced production of RANKL and M-CSF, and decreased production of OPG by SCs and osteoblasts (OBs) (Ma et al., 2001; Weir et al., 1996). However, additional BM cells may contribute to the catabolic activity of PTH in vivo. Among them are activated T cells (Clark and Normansell, 1990; Di Rosa and Pabst, 2005), a lineage now known to regulate bone homeostasis through secretion of pro- and anti-osteoclastogenic factors (Clowes et al., 2005; Teitelbaum, 2004; Weitzmann and Pacifici, 2005). Activated T cells also express surface receptors which bind to, and activate counter-receptors found on the surface of cells of the osteoblastic lineage (Ahuja et al., 2003). One of these T cell receptors is CD40L, which upon ligation to SC and OB expressed CD40 provides survival cues to these cells (Ahuja et al., 2003). Furthermore, T cells promote the capacity of osteoblastic cells to support OC formation by increasing the differentiation of SCs into OBs (Rifas and Arackal, 2003; Rifas et al., 2003), and by augmenting the SC/OB production of osteoclastogenic cytokines (Rifas and Avioli, 1999). These data suggest a model whereby T lymphocytes function as permissive cells which increase the capacity of SCs and OBs to support PTH induced osteoclastogenesis by promoting their survival and cytokine production. We thus investigated whether T cells facilitate PTH induced cortical bone loss by increasing the responsiveness of SCs to PTH. We show that continuous PTH treatment at doses which elevate serum PTH to levels typical of PHP stimulates OC formation and bone resorption and induces cortical bone loss only in the presence of T cells. We also show that T cells represent a permissive lineage which regulates the production of RANKL and OPG by SCs, and thus their capacity to support PTH induced osteoclastogenesis, through the CD40L/CD40 signaling system.
RESULTS
cPTH treatment fails to cause cortical bone loss in T cell deficient mice
To model the steady state elevation of PTH levels characteristic of PHP, hPTH 1–34 was infused into WT and nude female mice of 10 weeks of age at the rate of 80 µg/kg/day for 2 weeks, a treatment modality referred to hereafter as cPTH. Compared to WT controls, C57BL/6 nude mice have an increased rate of bone resorption and a lower bone density (Gao et al., 2004; Lee et al., 2006; Li et al., 2007; Toraldo et al., 2003). To control for these strain dependent confounders, the study included nude mice subjected to adoptive transfer of WT T cells 2 weeks before initiation of the PTH treatment. Two weeks after the T cell transfer, reconstituted nude mice had ~ 60 % of the T cells of WT mice (Supplementary Fig. 1), thus demonstrating that this design allows the homeostatic expansion of donor T cells to occur prior to treatment with cPTH. cPTH increased serum hPTH 1–34 to 590 ± 14 ng/L, values which are typical of PHP (Potts, 1998).
To assess the differential effects of cPTH on cortical and trabecular bone, micro-computed tomography (µCT) was utilized to analyze femurs harvested at sacrifice. µCT analysis of cortical bone showed that cPTH induced significant cortical thinning and loss of cortical volume in WT mice and T cell reconstituted nude mice. In contrast, cPTH did not cause significant cortical bone loss in T cell deficient nude mice (Fig.1a). µCT analysis of femoral trabecular bone revealed that cPTH increased trabecular bone volume (BV/TV) in all groups of mice; although such increase was lower in nude mice than in WT and T cell reconstituted mice. Thus, T cells are required for PTH to induce cortical bone loss, but are not essential for the anabolic effect of PTH on trabecular bone.
Figure 1.

Analysis of the effects (mean ± SEM) of cPTH in WT mice, nude mice, and nude mice previously subjected to adoptive transfer of WT T cells. * = p<0.05 as compared to the corresponding vehicle treated group. A Ex vivo µCT analysis of femur cortical and trabecular bone (n = 12 mice per group). B serum CTX and osteocalcin levels (n = 12 mice per group). C H and E staining of representative longitudinal sections of distal femurs. D Histomorphometric analysis of femoral trabecular bone volume, formation, and resorption. N.Ob/BS (the number of osteoblasts per mm bone surface), and ObS/BS (the percentage of bone surface covered by osteoblasts) are indices of bone formation. N.Oc/BS (the number of osteoclasts per mm bone surface), and OCs/BS (the percentage of bone surface covered by OCs) are indices of bone resorption. BV/TV (the percentage of trabecular volume occupied by bone volume) is an index of bone structure. n= 8–10 mice per group.
Additional measurements of vertebral trabecular bone by µCT confirmed that cPTH increased BV/TV in all groups and revealed that cPTH induced similar increases in BV/TV in the femur and in the spine (data not shown). Measurements of serum C-terminal telopeptide of collagen (CTX), a biochemical marker of resorption confirmed (Fig.1b) that nude mice have a higher rate of resorption than WT mice and showed that adoptive transfer of T cells into nude hosts leads to a decrease in serum CTX levels. These phenomena are due, in part, to the capacity of T cells to induce B cell production of OPG (Li et al., 2007). The data also revealed that PTH increased resorption in WT mice and T cell reconstituted nude mice, but not in T cell deficient mice. Serum osteocalcin, a marker of bone formation, was increase by PTH in all groups. The calcemic response of WT and nude mice to cPTH is shown in Supplementary Fig. 2.
Histomorphometric analysis of femoral trabecular bone revealed that the number of OB per bone surface (NOb/BS), and the percent of bone surface covered by OBs (ObS/BS), two indices of bone formation, were significantly augmented by PTH in all groups. In contrast, cPTH increased trabecular bone resorption, as assessed by measurements of the number of OCs per bone surface (NOc/BS) and the OC surface per bone surface (OcS/BS), in T cell replete, but not in T cell deficient mice. Moreover, cPTH increased BV/TV by ~ 30 % in WT mice, ~ 33 % in nude mice, and ~ 39 % in reconstituted nude mice (Fig.1c–d). These changes approached, but did not reach, statistical significance. Thus, while T cells are required for cPTH at 80 µg/kg/day to induce bone resorption and cortical bone loss, they are not required for cPTH to stimulate bone formation. Moreover, the capacity of reconstituted nude mice to exhibit a resorptive response to cPTH demonstrates that nude mice are protected against the catabolic activity of cPTH at 80 µg/kg/day because of their T cell paucity, rather than as a result of a strain dependent maximal elevation of bone resorption at baseline. This hypothesis was further confirmed by the finding that a lethal dose of cPTH (240 µg/kg/day) stimulates bone resorption in both WT and nude mice (Supplementary Fig 3).
To confirm that T cells are required for PTH to induce bone loss, cPTH was infused in class I and class II double MHC −/− (Abb/β2m) mice, a strain characterized by a completed lack of T cells. While cPTH increased osteocalcin levels in all groups, cPTH induced cortical bone loss and increased CTX levels in WT controls, but not in mice lacking T cells (Fig. 2a).
Figure 2.

Analysis of the effects (mean ± SEM) of cPTH in MHC double KO mice, TCRβ −/− mice, nude mice adoptively transferred with either CD4+ or CD8+ cells, and WT mice treated with anti CD4/8 or irrelevant antibodies. * = p<0.05 as compared to the corresponding vehicle treated group. A Ex vivo µCT analysis of femur cortical bone, serum CTX and osteocalcin levels in class I and class II MHC double KO mice (n = 8 mice per group). B Ex vivo µCT analysis of femur cortical bone, serum CTX and osteocalcin levels in TCRβ −/− mice which lack αβ T cells (n = 8 mice per group). C Ex vivo µCT analysis of femur cortical bone, serum CTX and osteocalcin levels in nude mice adoptively transferred with either CD4+ or CD8+ cells (n = 10 mice per group). D Analysis of femur cortical bone by µCT, and serum CTX and osteocalcin levels in WT mice depleted of T cells in vivo by injection of anti CD4/8 mAbs. Controls were treated with irrelevant (Irr) mAbs (n = 9 mice per group). E Analysis of femur cortical and trabecular bone by histomorphometry in WT mice treated in vivo with anti CD4/8 or irrelevant antibodies (n = 9 mice per group).
The T cells mediating the catabolic effect of cPTH were found to be αβ T cells, because cPTH induced cortical bone loss and increased serum CTX in WT mice but not in TCRβ −/− mice, a strain completely devoiced of αβ T cells (Fig. 2b). Confirming that cPTH induced anabolism is independent of T cells, PTH increased osteocalcin levels in all groups.
To further characterize the subset of T cells required for cPTH to induce bone loss, nude mice were subjected to adoptive transfer of either CD4+ or CD8+ T cells and treated with cPTH, starting two weeks after the T cell transfer. While cPTH increased osteocalcin levels in all groups, cPTH induced cortical bone loss and increased CTX levels in WT controls, but not in mice reconstituted with either CD4+ or CD8+ T cells (Fig. 2c). FACS analysis of splenocytes harvested prior to initiation of cPTH treatment revealed that nude mice reconstituted with a single T cell lineage had a number of either CD4+ T cells or CD8+ T cells which was similar (86–100 %) to that of nude mice reconstituted with all T cells (CD90+ cells). However, nude mice reconstituted with a single lineage had a severe deficit in the number of T cells of the other lineage. As a result, nude mice reconstituted with a single T cell lineage had a number of total T cells which was only 61–66 % that of nude mice reconstituted with all T cells. These findings, along with additional in vitro data shown in Fig. 3d (see below), suggest that in the single T cell lineage reconstitution experiment the catabolic activity of PTH was silenced by a decrease in the total number of T cells, rather than by the lack of one T cell population.
Figure 3.

PTH has a reduced capacity to stimulate in vitro OC formation in the absence of T cells. All data are expressed as mean ± SEM. A–B BM from nude and TCRβ −/− mice and from the respective controls were stimulated with PTH for 7 days, stained for TRAP, and OCs counted. *= p<0.05 and ** p<0.01 as compared to vehicle. C BM from mice treated in vivo with anti CD4/8 mAbs for 24 days was cultured with PTH for 7 days. *= p<0.05 as compared to vehicle treated BM, **= p<0.05 as compared to PTH treated BM from T cell depleted mice. D WT BM was depleted of either T cells (CD90+ cells), CD4+ or CD8+ cells in vitro. Controls included BM depleted of T cells and immediately reconstituted with 10–20 % BM T cells, CD4+ or CD8+ T cells. All samples were stimulated with PTH for 7 days, stained for TRAP, and OCs counted. *= p<0.05 and **= p<0.01 compared to the other groups. E Images of PTH treated BM stained for TRAP to visualize OCs. Samples stimulated with RANKL and M-CSF were used as a positive control. OCs were defined as multinucleated (≥ 3 nuclei) TRAP+ cells.
In vivo T cell immunodepletion prevents the bone loss induced by cPTH in WT mice
To demonstrate a role for T cells in PTH induced bone loss in non-genetically manipulated animals, WT female mice were first depleted of T cells by injection of anti CD4/CD8 antibodies using established methods (Chen et al., 2000; Kitaura et al., 2004), and then treated with cPTH for 2 weeks, starting 10 days after the first mAb injection. FACS analysis showed that anti CD4/CD8 mAbs had effectively depleted the BM and the spleen of T cells prior to initiation of cPTH treatment (Supplementary Fig. 4). Analysis of femoral cortical bone by µCT revealed that in vivo T cell depletion afforded a significant protection against cPTH induced cortical bone loss (Fig. 2d). T cell depletion also prevented the increase in the serum level of CTX induced by cPTH. In contrast, cPTH increased serum osteocalcin in all groups.
Histomorphometric analysis of femoral cortical bone revealed (Fig.2e) that cPTH increases cortical bone resorption and OC number in control, but not in T cell depleted WT mice. This was established by measuring the number of OCs per bone surface (NOc/BS), and the OC surface per bone surface (OcS/BS). Analysis of trabecular bone showed that BV/TV increased by ~ 23 % and ~32 % in T cell depleted and replete mice, respectively. However the changes in BV/TV were not statistically significant. Thus, studies in non-genetically manipulated mice confirmed T cells are required for cPTH to induce cortical bone loss and stimulate bone resorption, while they are not required for cPTH to stimulate osteocalcin levels, a marker of bone formation.
PTH fails to stimulate OC formation in cultures of BM lacking T cells
To establish whether T cells are required for PTH to induce OC formation in vitro, we counted the number of OCs produced by osteoclastogenic cultures of whole BM. In vitro PTH treatment (1–10 nm) failed to significantly increase OC formation in BM derived from nude mice, while it did so in BM from both nude mice previously subjected to adoptive transfer of T cells, and WT controls (Fig. 3a). In vitro PTH treatment also failed to stimulate OC formation in cultures of BM from TCRβ −/− mice (Fig. 3b).
To confirm these findings in non-genetically manipulated mice BM was harvested from WT mice injected with anti CD4/8 mAbs or isotype matched irrelevant mAbs for 24 days. BM was then cultured with vehicle or PTH for 7 days. Although PTH stimulated osteoclastogenesis in both groups, the number of OCs was more than 5 fold lower in BM from T cell depleted mice than in BM from T cell replete controls (Fig. 3c).
Finally, BM was harvested from WT mice, depleted in vitro of all T cells (CD90+ cells), CD4+ or CD8+ T cells by negative immunomagnetic selection, and cultured with PTH for 7 days (Fig. 3d). Controls included T cell depleted BM immediately reconstituted with 10 or 20 % T cells, a 2–4 fold super-physiologic proportion selected to account for the diminished survival in vitro of purified T cells. PTH failed to stimulate OC formation in BM depleted of either CD4+ or CD8+ T cells while the addition of CD4+ or CD8+ cells to T cell depleted BM dose dependently increased the osteoclastogenic activity of PTH. These findings confirm that CD4+ or CD8+ cells are both capable of promoting PTH induced OC formation, and that such response is a function of the number of T cells rather than their phenotype. Representative images of T cell depleted BM cultures stained for tartrate-resistant acid phosphatase (TRAP) to visualize OCs are shown in Fig 3e.
T cells regulate the number and the osteoclastogenic activity of SCs
To investigate whether T cells regulate the number of BM SCs, BM was harvested from nude mice and WT mice depleted of T cells for 24 days in vivo by injection of anti CD4/8 mAbs. Furthermore, WT BM was depleted of T cells in vitro by negative immunomagnetic selection using beads coupled with anti CD4 and anti CD8 mAbs. Controls included nude mice reconstituted with T cells 2 weeks earlier, WT mice treated with irrelevant mAbs, and BM depleted of T cells in vitro immediately reconstituted with a physiologic number of BM T cells. Since SCs proliferate rapidly for one week after adhering to plastic (Quarles et al., 1992), all BM samples were cultured for 7 days to allow SCs to increase in number. SCs were then purified and counted. This analysis revealed that BM lacking or depleted of T cells had ≤ 50 % fewer SCs as compared to T cell replete cultures (Fig. 4a–c).
Figure 4.

Effects (mean ± SEM) of T cells on SC number, proliferation and apoptosis. SCs were purified from BM harvested from T cell deficient nude mice, WT mice depleted of T cells in vivo via injection of anti CD4/8 mAbs, and WT mice depleted of T cells in vitro by immunomagnetic selection. Control groups included nude mice subjected to adoptive transfer of spleen WT T cells 2 weeks earlier, BM from WT mice treated with irrelevant mAbs, and WT mice first depleted of T cells in vitro and immediately reconstituted with WT BM T cells. n = 3 wells per group. A–C number of SCs/mouse yielded by the purification procedure. *= p<0.05 as compared to the other groups. D–F SC proliferation assay. SCs were purified as described in the methods, seeded in equal number, cultured for 3 days, and pulsed with thymidine for the last 18 hours of culture. Data are expressed in CPM. *= p<0.05 as compared to the other groups. G–I % Analysis of the rate of SC apoptosis. SCs were cultured for three days and their rate of apoptosis determined by TUNEL staining at the end of the culture period. *= p<0.05 as compared to the other groups.
To investigate the mechanism involved, SCs were purified as described above, seeded in equal number, cultured for 3 days and used to determine their rate of proliferation and apoptosis by thymidine incorporation and TUNEL staining. SCs from BM lacking or depleted of T cells exhibited a ~2–3 fold lower proliferation (Fig. 4d–f), and ~2–3 fold higher rate of apoptosis (Fig. 4g–i), as compared to SCs from T cell replete BM, demonstrating that T cells provide survival and proliferation signals to SCs. Thus, one mechanism by which T cells affect the osteoclastogenic response to PTH is by regulating the size of the SC pool in the BM.
To determine whether T cells regulate SC function, WT mice, nude mice and nude mice previously reconstituted with WT T cells were infused with cPTH for 2 weeks. BM was harvested and cultured for 1 week. SCs were then purified, seeded in equal number, cultured for 3 days with and without PTH, and their production of RANKL and the soluble RANKL decoy receptor OPG mRNA assessed by real time RT-PCR. As compared to SCs from T cell replete controls, SCs from nude mice treated with vehicle expressed lower mRNA levels of both RANKL and OPG (Fig. 5a). However, the RANKL/OPG mRNA ratio was similar in all vehicle treated groups. cPTH increased the expression of RANKL mRNA and lowered that of OPG mRNA in SCs from T cell replete mice but not in those from nude mice. As a result, SCs from cPTH treated T cell deficient nude mice demonstrated a lower RANKL/OPG mRNA ratio as compared to SCs from cPTH treated WT and reconstituted nude mice.
Figure 5.

Effect (mean ± SEM) of T cells on RANKL/OPG mRNA expression by BM SCs and SC osteoclastogenic activity. A mRNA levels of RANKL and OPG and RANKL/OPG mRNA ratio in SCs from nude mice. *= p<0.05 as compared to the corresponding vehicle group. **= p<0.05 as compared to the corresponding WT and T cell reconstituted groups. B mRNA levels of RANKL and OPG and RANKL/OPG mRNA ratio in SCs from WT mice depleted of T cells in vitro. *= p<0.05 as compared to the corresponding vehicle group. **= p<0.05 as compared to the corresponding WT and T cell reconstituted groups. C BMMs and T cells from WT mice were cocultured with SCs from nude and control mice for 1 week in the presence of PTH. Cocultures were stained for TRAP and OCs counted. *= p<0.05 compared to vehicle. **= p<0.05 compared to vehicle and to the corresponding PTH treated groups with SCs from WT and T cell reconstituted nude mice. D BMMs and T cells from WT mice were cocultured for 1 week in the presence of PTH with SCs from either WT BM depleted of T cells in vitro or control BM. *= p<0.05 compared to vehicle. **= p<0.05 compared to vehicle and to PTH treated groups with SCs from whole and reconstituted BM.
To confirm these findings in an in vitro model, WT BM was depleted of T cells in vitro by negative immunomagnetic selection and cultured for 1 week. Controls included whole BM and BM which was first depleted of T cells, and immediately reconstituted with BM T cells. SCs were then purified and cultured for 3 days with or without PTH. Unstimulated SCs from T cell depleted BM expressed lower mRNA levels of RANKL and OPG than those from T cell replete BM (Fig. 5b). However, the RANKL/OPG mRNA ratio was similar in unstimulated SCs from all groups. In this model stimulation with PTH increased the expression of RANKL in all groups, and decreased the levels of OPG mRNA in SCs from T cell replete BM, but not in those from T cell depleted BM. Therefore, the RANKL/OPG mRNA ratio was lower in PTH stimulated SCs from T cell depleted BM than in control SCs. These findings demonstrate that SCs which have matured both in vitro and in vivo in a microenvironment lacking BM T cells exhibit an altered RANKL/OPG ratio.
To assess the capacity of SCs to support PTH induced osteoclastogenesis, T cells and BM macrophages (BMMs) harvested from untreated WT mice were cocultured for 7 days with equal numbers of SCs from either nude mice or T cell replete controls in the presence of PTH, a hormone which promotes OC formation by targeting SCs. Under these conditions PTH induced OC formation is a function of SC osteoclastogenic activity. Since the physiologic SC/BMM ratio in the BM is ~ 1/1000, initial experiments were conducted using this ratio of SCs and BMMs, but PTH failed to induce OC formation in all groups (not shown). Therefore, in subsequent experiments the SC/BMM ratio was set at 200/1 to favor OC formation. SCs from T cell deficient nude mice exhibited a lower osteoclastogenic response to PTH (Fig. 5c), as compared to SCs from WT and reconstituted nude mice, suggesting that the lack of T cells in the BM microenvironment leads to the emergence of SCs characterized by blunted osteoclastogenic activity. This phenomenon was evident in spite of the presence of T cells in the osteoclastogenic cultures, suggesting that the 7 day long culture period was not sufficient for T cells to modify the osteoclastogenic phenotype of SCs harvested from T cell deficient mice.
To confirm these findings, WT BM was depleted of T cells in vitro. T cell reconstituted BM was prepared by first depleting the BM of T cells, followed by the immediate addition of a physiologic number of CD4+ and CD8+ BM T cells. BM was then cultured for 1 week to expand the SC pool. SCs were then purified and cocultured for 7 days with T cells and BMMs from untreated WT mice in the presence of PTH. The number of OCs produced by these cocultures was counted at the end of this 1 week culture period.
This experiment revealed that in spite of the presence of T cells in the osteoclastogenic culture, SCs from T cell depleted BM exhibited a lower osteoclastogenic activity (Fig. 5d) than those from T cell replete BM. Together, these findings indicate that the lack of T cells in the BM microenvironment leads to the emergence of SCs characterized by a blunted capacity to support PTH induced OC formation. This phenomenon is likely to result from impaired production of RANKL not sufficiently offset by a decrease in OPG.
To determine whether T cells regulate the capacity of BMMs to differentiate into OCs, SCs and T cells from WT mice were cocultured with BMMs from either nude or WT mice in the presence of PTH for 1 week. All cultures, regardless of the BMM source, produced the same number of OCs (Supplementary Fig. 5a). Furthermore, purified BMMs from WT and nude mice formed the same number of OCs in response to stimulation with M-CSF and a suboptimal concentration of RANKL (Supplementary Fig. 5b). Thus nude mice do not have defective OC precursors.
T cells stimulate SC osteoclastogenic activity through CD40L
One feature of activated T cells is that of expressing CD40L, a receptor for the costimulatory molecule CD40, which is expressed on cells of the osteoblastic lineage (Ahuja et al., 2003). Accordingly, we found that ~ 22 % of stimulated CD4+ and CD8+ BM T cells were CD40L+ (supplementary Fig. 6a). However, cPTH treatment did not further increase T cell activation and T cell CD40L expression (not shown). In contrast, RT-PCR and western blot analysis revealed that cPTH upregulates CD40 mRNA and CD40 protein expression in SCs from WT mice but not from nude mice (supplementary Fig. 6b,c), suggesting that PTH upregulates the expression of CD40 only in SCs which have matured in the presence of T cells.
To determine whether BM T cells regulate the osteoclastogenic activity of SCs through CD40L/CD40 signaling, WT and CD40 −/− SCs were cocultured with BMMs and PTH to induce OC formation. The formation of OCs induced by PTH was reduced in cultures containing CD40 −/− SCs (Fig. 6a). Moreover, while T cells increased OC formation in cultures with WT SCs, T cells failed to increase OC formation in those with CD40 −/− SCs. Neutralization of CD40L by the anti CD40L mAb MR-1 also blocked the capacity of T cells to increase PTH induced OC formation, while the addition of soluble CD40L to cocultures of SCs and BMMs increased SC osteoclastogenic activity in a manner identical to the addition of T cells. In contrast, soluble CD40L did not increase OC formation in cultures of BMMs alone stimulated with M-CSF and RANKL (not shown), suggesting that CD40 signaling in BMMs does not regulate the capacity of BMMs to differentiate into OCs.
Figure 6.
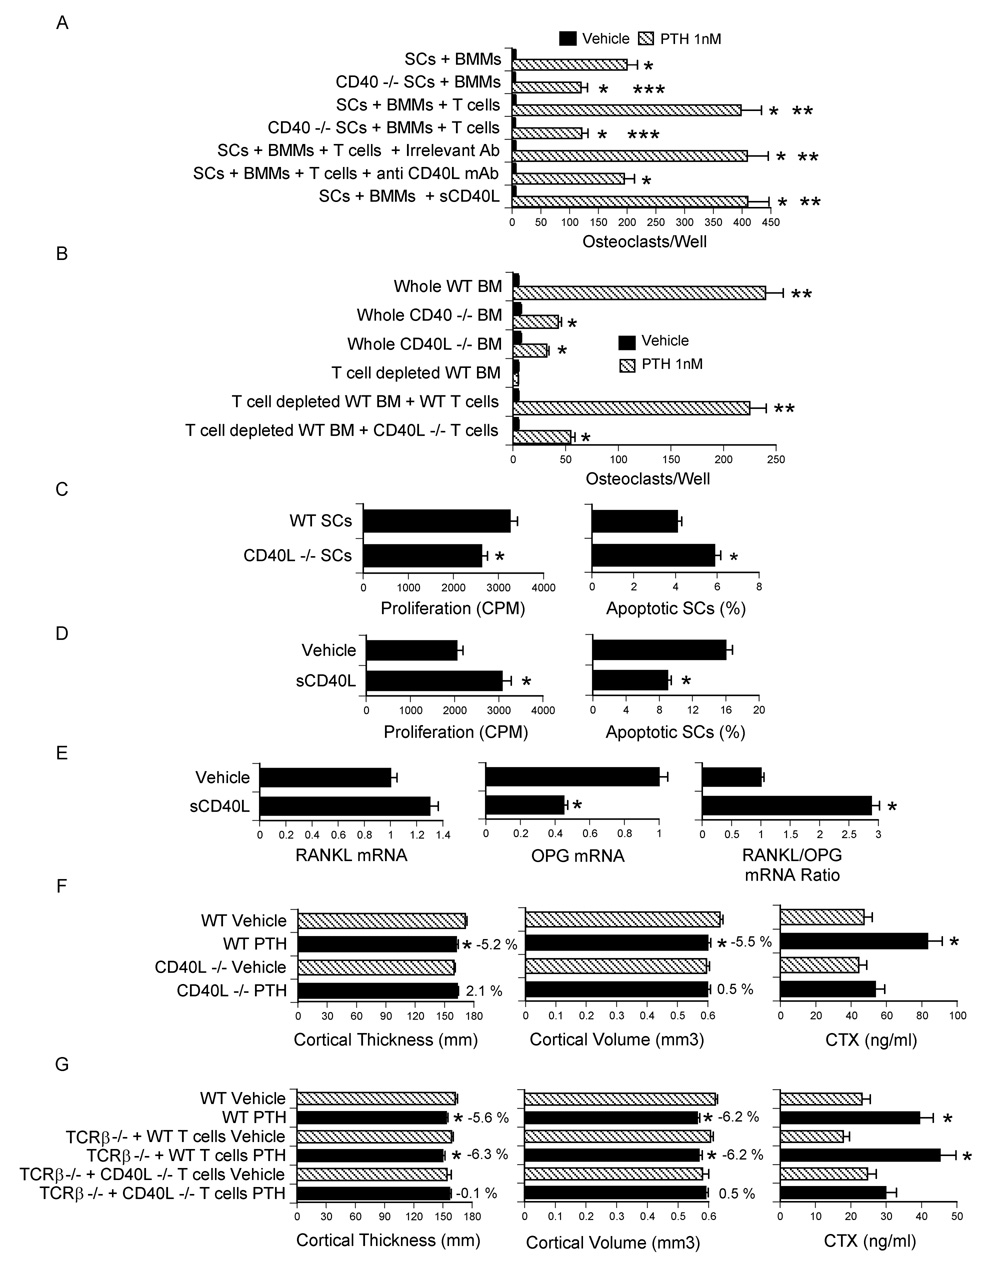
T cells regulate SC activity and mediate PTH induced bone loss through CD40L. All data are expressed as mean ± SEM. A SCs from WT or CD40 −/− mice were cocultured with BMMs and T cells from WT mice in the presence of PTH for 7 days. Anti CD40L mAb and soluble CD40L were added to same samples. The cocultured were then stained for TRAP, and OCs counted. *= p<0.05 compared to vehicle. **= p<0.05 compared to all other groups. ***= p<0.05 compared to corresponding groups with WT SCs. B Whole BM from WT, CD40 −/− and CD40L −/− mice was cultured with PTH for 7 days, stained for TRAP, and OCs counted. In some samples WT BM was depleted of T cells in vitro and reconstituted with either WT or CD40L −/− T cells. *= p<0.05 compared to vehicle. **= p<0.05 as compared to all other groups. C–D SCs were purified as described in the methods, cultured for 7 days with vehicle or soluble CD40L (1 µg/ml) and pulsed with thymidine for the last 18 hours to measure SC proliferation. SC apoptosis was determined by TUNEL staining at the end of the 7 day culture period. *= p<0.05 compared to WT SCs or vehicle. E mRNA levels of RANKL and OPG and RANKL/OPG mRNA ratio in SCs stimulated by soluble CD40L (1 µg/ml). *= p<0.05 compared to vehicle. F Ex vivo µCT analysis of femur cortical bone and serum CTX levels in WT and CD40L −/− mice treated with cPTH (80 µg/kg/day) for 2 weeks. n= 10 mice per group. *= p<0.05 compared to the corresponding vehicle treated group. G Ex vivo µCT analysis of femur cortical bone and serum CTX levels in TCRβ −/− reconstituted with CD40L −/− T cells. Reconstituted mice were treated with cPTH (80 µg/kg/day) for 2 weeks. n = 12 mice per group. *= p<0.05 compared to the corresponding vehicle treated group. The numbers next to the bars indicate the % difference between the corresponding vehicle and the PTH treated group.
Further confirming the relevance of CD40L/CD40 signaling, the osteoclastogenic activity of PTH was markedly blunted in CD40 −/− and CD40L −/− BM (Fig. 6b). Moreover, experiments in which BM from WT mice was depleted of T cells in vitro and reconstituted with BM T cells from either WT mice or CD40L −/− mice revealed that the addition of WT T cells rescues PTH induced osteoclastogenesis, while reconstitution with CD40L −/− T cells is only ~ 20 % effective.
SCs purified from CD40L −/− BM after 1 week of culture in vitro also exhibited a reduced rate of proliferation and increased apoptosis (Fig. 6c). To provide an additional confirmation of the capacity of CD40L to regulate SC function, WT BM was cultured for 1 week. SCs were then purified and incubated with soluble CD40L for 7 days. These studies revealed that CD40L increases SC thymidine incorporation by ~ 50 %, decreases SC apoptosis by 2 fold (Fig. 6d) and increases the RANKL/OPG mRNA ratio (Fig.6e). Thus, CD40L increases SC proliferation and lifespan, and causes the formation of SCs with increased osteoclastogenic potentials.
To demonstrate the relevance of CD40L in vivo, CD40L −/− mice and congenic WT controls were infused with cPTH for 2 weeks. µCT analysis revealed that cPTH decreases femoral cortical thickness and volume and increases serum CTX in WT mice but not in CD40L −/− mice (Fig. 6f). Finally, T cells harvested from CD40L −/− mice were adoptively transferred into TCRβ −/− mice. After 10 weeks, the shortest time that preliminary studies revealed to be required for T cells to rescue SC function in this strain, reconstituted mice were infused with cPTH for 2 weeks. Again, we found that cPTH induces cortical bone loss and increases serum CTX levels in TCRβ −/− mice reconstituted with WT T cells, but not in mice injected with CD40L −/− T cells (Fig. 6g). Together, these findings demonstrate that cPTH stimulate bone resorption and cause bone loss through T cell expressed CD40L.
DISCUSSION
We report that mice lacking T cells are protected against the loss of cortical bone and the stimulation of bone resorption induced by cPTH, thus indicating that T cells represent a regulatory component of the BM microenvironment involved in the osteoclastogenic response to PTH. This response is induced by PPR signaling in SCs and their osteoblastic progeny, but T cells play a permissive role by promoting the osteoclastogenic activity of SCs through membrane-bound CD40L (Fig. 7). We also show that the PTH permissive activity of T cells is not a feature of a specific lineage, but rather depends on the presence of a sufficient number of either CD4+ or CD8+ T cells.
Figure 7.

Schematic representation of the role of T cells in the mechanism by which PTH stimulates OC formation. In the absence of T cells (left panel) BM SCs are fewer in number (not shown), and exhibit a blunted capacity to support PTH induced OC formation due to diminished production of RANKL and continuous production of the RANKL decoy receptor OPG. In the presence of T cell expressed CD40L (right panel) the pool of SCs in the BM is 2-fold larger (not shown). Furthermore, CD40L/CD40 signaling increases the osteoclastogenic activity of SCs by augmenting the SC production of RANKL and blunting their secretion of OPG. The result is a potentiation of the capacity of PTH to stimulate the formation of OCs.
Transplantation of tumors producing PTH and/or PTHrP in nude mice stimulates bone resorption in spite of the absence of T cells in the host (Guise et al., 1992; Mehdizadeh et al., 1989; Uy et al., 1995). The apparent discrepancy between these reports and our is explained by the higher levels of circulating PTH/PTHrP attained by transplanting PTH/PTHrP producing tumors, as compared to those obtained by infusing PTH 80 at µg/kg/day. In support of this hypothesis are our findings demonstrating that cPTH at 240 µg/kg/day, a dose that elevates circulating PTH to levels observed in mice bearing PTH/PTHrP producing tumor (≥ 1000 ng/L), stimulates bone resorption and induces hypercalcemia in T cell deficient nude mice, although less potently than in WT mice. In contrast, cPTH at 80 µg/kg/day, a dose which raises serum PTH to a level typical of PHP stimulates bone resorption only in T cell replete mice. Adding further support to our hypothesis, are reports from others demonstrating that transplantation of adenomatous and hyperplastic parathyroid tissues in nude mice in a fashion that elevates serum PTH to 80–240 ng/L fails to induce hypercalcemia (Hory et al., 2000; Strieth et al., 2005), while parathyroid transplants that elevate serum PTH to ≥ 1000 ng/L induce hypercalcemia in nude hosts (Schachter et al., 1990). A likely hypothesis is that extreme levels of PTH/PTHrP induce SC/OBs expression of osteoclastogenic factors in an amount sufficient to maximally stimulate OC formation and activity even in the absence of T cells. Alternatively, extreme levels of PTH/PTHrP could alter the production of RANKL and OPG by other BM cells which are not key targets of physiologic levels of PTH. For example, the B cell production of OPG, which represents ~ 65 % of the total BM OPG (Li et al., 2007), might be blunted by high levels of PTH, as the functional activity of B cells is repressed by PTH (Alexiewicz et al., 1990; Shurtz-Swirski et al., 1995),
cPTH is known to stimulate both the resorption and the formation of trabecular bone (Dempster et al., 1999; Iida-Klein et al., 2005; Qin et al., 2004; Zhou et al., 2001). Since we found that the lack of T cells abrogates the capacity of cPTH to stimulate bone resorption but not bone formation, it would be predicted that cPTH would cause a greater increase in BV/TV in T cell deficient animals than in T cell replete mice. By contrast, cPTH increased BV/TV in all groups. A likely explanation for this finding is that the diminuished osteoclastogenic response to cPTH obseved in T cell deficient mice blunts a permissive osteoclastic signal required for PTH to stimulate trabecular bone growth (Koh et al., 2005).
In spite of a smaller SC pool and a blunted SC osteoclastogenic activity, T cell deficient mice possess a normal anabolic response to cPTH. This may suggest that the SCs which produce osteoclastogenic factors and support OC formation are not the same cells that differentiate into OBs, the cells that form osteoid and mineralize it, a hypothesis recently proposed by others (O'Brien et al., 2006). Indeed osteoclastogenic SCs express intercellular adhesion molecule-1 (ICAM-1) which is necessary for binding to OC precursors (Tanaka et al., 2000), while matrix producing osteoblastic cells are ICAM-1 negative (Everts et al., 2002). However, it is also possible that a defective stimulation of bone formation might emerge in T cell deficient mice in response to long-term cPTH treatment.
The BM contains activated memory T cells which express ligands for surface molecules expressed by cells of the osteoblastic lineage (Ahuja et al., 2003). Among them is CD40L, which is known to promote OB survival through binding to OB expressed CD40 (Ahuja et al., 2003). Our findings demonstrate that CD40L signaling provides survival and proliferation cues to SCs and regulates their function by increasing the RANKL/OPG ratio. These quantitative and qualitative changes provide a molecular explanation for the reduced capacity of SCs from T cell deficient BMs to support OC formation in vitro. The relevance of T cell expressed CD40L in vivo was confirmed by the failure of PTH to induce cortical bone loss and stimulate bone resorption in both CD40L −/− mice and T cell deficient mice reconstituted with CD40L −/− T cells. Together these data demonstrate that T cells increase PTH induced osteoclastogenesis through a CD40L/CD40 mediated cross-talk between T cells and SCs.
Since CD40 is expressed not only in SCs but also in OC precursors of the monocytic lineage (O'Sullivan and Thomas, 2003), it could be argued that T cell expressed CD40L may stimulate OC formation through direct signaling in maturing OCs. This is unlikely because neither anti CD40L mAb nor soluble CD40L alters OC formation in cultures of BMMs and T cells stimulated with RANKL and M-CSF (data not shown).
Antigen activated Th2 cells have been shown to produce PTH, which contributes to maintain the anabolic activity of OBs under inflammatory conditions (Young et al., 2005). It is unlikely that mice lacking T cells are protected against the catabolic activity of cPTH because of the absence of Th2 cell produced PTH. In fact, activated Th2 cells mitigate bone resorption by lowering the RANKL/OPG ratio largely through PTH independent mechanisms (Young et al., 2005).
Previous studies have shown that T cells play a pivotal role in stimulating OC formation and inducing bone loss in inflammatory diseases (Kong et al., 1999), periodontal bone disease (Taubman and Kawai, 2001) and estrogen deficiency (Weitzmann and Pacifici, 2005) through upregulated production of RANKL and TNF by activated T cells (Kong et al., 1999; Weitzmann and Pacifici, 2005). The current investigation demonstrates the key role of CD4+ and CD8+ T cells in a model of hyperparathyroidism, another common condition characterized by stimulated osteoclastogenesis, increased bone turnover and bone loss (Potts, 1998; Riggs and Melton, 1986). Together, these data suggest that T cells may be central for stimulating OC formation above baseline both in inflammatory and hormone mediated bone loss. However, T cells mediate PTH induced bone loss by regulating SC function through a membrane bound signaling molecule, while they cause other forms of bone loss by secreting osteoclastogenic cytokines.
Cortical bone represents about 80 % of the entire skeletal mass (Riggs et al., 2002) and cortical volume and thickness are major predictors of bone strength and fracture risk (Cheng et al., 2006). Thus, the T cell dependent bone effects of PTH are relevant for the risk of long bone fractures associated with primary and secondary hyperparathyroidism (Grey et al., 1996; Parisien et al., 2001; Potts, 1998; Riggs and Melton, 1986). Understanding the cross-talk between T cells and SCs may thus yield novel therapeutic strategies for PTH induced bone disease.
EXPERIMENTAL PROCEDURES
Animals
All animal procedures were approved by the Institutional Animal Care and Use Committee of Emory University. All experiments were conducted in female mice of 10 weeks of age. C57BL/6 WT mice, homozygous nude mice (nu/nu), Abb/β2m mice, TCRβ −/−, CD40 −/− and CD40L −/− mice were purchased from The Jackson Laboratory (Bar Harbor, Maine). All mice were maintained pathogen free conditions. Animals were fed sterilized food and water.
T cell Transfer
Nude and TCRβ −/− mice were subjected to adoptive transfer of WT spleen T cells via tail-vein injection of 2 × 10⁶ T cells purified by positive immuno-magnetic selection using MACS Microbeads (Miltenyi Biotec, Auburn, CA) coupled to anti-CD90 (Thy1.2), anti-CD4, or anti-CD8 antibodies. T cells were transferred into nude mice 2–10 weeks before treatment to allow the engraftment and the peripheral expansion of the transferred T cells, as well as the recovery of SC function.
In vivo PTH infusion
80 µg/kg/day of hPTH1-34 (Bachem California Inc., Torrance, CA) or vehicle were delivered for 2 weeks by implanting ALZET osmotic pump model-1002 (DURECT corporation, Cupertino, CA) with a delivery rate of 0.25 µl/hr.
In vivo T cell depletion
WT mice were depleted of T cell subsets by IP injections of bioreactor-generated mAbs GK1.5 (ATCC, Manassas VA) and 2.43 (ATCC), which are directed against CD4+ and CD8+ cells, respectively (Chen et al., 2000), or irrelevant isotype matched control mAbs at the dose of 500 µg each twice a week for 24 days (Grcevic et al., 2000; Kitaura et al., 2004), starting 10 days before the PTH or vehicle infusion. Depletion efficiencies were confirmed by flow cytometry, and depleted subsets of lymphocytes were routinely obtained (Supplemental figure 4).
In vitro T cell depletion
Whole BM was harvested from WT mice and depleted of T cells by negative immunomagnetic selection using beads coupled with anti CD4 and anti CD8 mAbs. T cell reconstituted BM was prepared by first depleting the BM of T cells, followed by the immediate addition of a physiologic number of CD4+ and CD8+ BM T cells.
Stromal cell purification
BM was collected from long bones by centrifugation for 2 minutes at 13000 rpm, and cultured for 7 days in α-MEM medium containing 10% FBS, 100mg/ml of penicillin, and 100 IU/ml of streptomycin. After discarding the non adherent cells, adherent BMMs were eliminated by positive immunoselection by MACS Microbeads (Miltenyi Biotec, Auburn, CA) coupled to anti-CD11c antibody. This marker is expressed on non adherent DCs and adherent BMMs(Corbi and Lopez-Rodriguez, 1997). The remaining adherent cells were SCs. Cell purity was verified by histochemical staining for nonspecific esterase, a marker for cells of the monocytic/macrophage lineage. Purified SCs were > 95 % nonspecific esterase negative. When cultured in the presence of 50 µg/ml of ascorbic acid and 5 mM β-glycerophosphate to induce differentiation toward the osteoblastic lineage SCs were > 95 % positive for alkaline phosphatase (ALP), a marker of differentiated BM SCs.
BMM and T cell purification and culture
BMMs and T cells were purified from the BM and spleen by positive immunoselection using MACS Microbeads (Miltenyi Biotech,) coupled to anti-CD11b, anti CD90, or anti CD4 and anti CD8 antibodies, as described (Cenci et al., 2003). Cell purity was verified to be > 90% by FACS. T cell conditioned media was prepared by culturing purified T cells with plate bound anti-CD3 and anti-CD28 mAbs for 3 days.
In vitro OC generation
BM or cultures of BMMs, SCs and T cells were cultured for 7 days in the presence of human PTH 1–34 (0.1 – 10 nM) to induce OC formation. The cultures were then fixed and stained for TRAP. TRAP positive cells with ≥ 3 nuclei were scored as OCs.
µCT measurements of cortical bone
µCT scanning and analysis was performed as reported previously (Gao et al., 2007) by a technician blind to grouping of animals, using a Scanco µCT-40 scanner (Scanco Medical, Bassersdorf, Switzerland). Bones were scanned at a resolution of 12 µm, tomographic images were obtained at conditions of 70 KV and 114 µA by collecting 500 projections. Cortical bone volume and cortical thickness were determined by analyzing 80 slices at the mid –diaphysis of the femurs.
Quantitative bone histomorphometry
Bone histomorphometry analysis was performed at the University of Alabama at Birmingham, Center for Metabolic Bone Disease--Histomorphometry and Molecular Analysis Core Laboratory by using Bioquant Image Analysis software (R&M Biometrics, Nashville, TN). The measurements, terminology and units used for histomorphometric analysis, were those recommended by the Nomenclature Committee of the American Society of Bone and Mineral Research (Parfitt et al., 1987). Femurs were decalcified with 20% EDTA in PBS, embedded in paraffin, sectioned, and stained with hematoxylin and eosin (H and E) and TRAP. For analysis of trabecular bone, measurements were obtained in an area of cancellous bone that measured approximately 2.5 mm2, contained only secondary spongiosa, and was located 0.5–2.5 mm proximally to the distal epiphyseal growth cartilage of femurs. For analysis of cortical bone, measurements were obtained in cross-sections of the central region of the distal femur. N.Ob/BS (the number of OBs per mm bone surface), ObS/BS (the percentage of bone surface covered by OBs), N.OC/BS (the number of OCs per mm bone surface), OcS/BS (the percentage of BS occupied by OCs), ES/BS (the percentage of eroded bone surfaces), and BV/TV (the percentage of total volume occupied by trabecular bone volume) were measured.
Measurement of serum calcium and PTH
Serum calcium was measured by a colorimetric kit, Calcium LiquiColor (Stanbio Laboratory, Boerne, TX). Serum human PTH1–34 levels were measured in PTH treated mice to verify the successful delivery of human PTH1–34 using a human 1–34 PTH ELISA kit which does not cross-react with mouse 1–34 PTH (Immutopics, Inc. San Clemente, CA).
Measurement of serum markers of bone turnover
Serum C-terminal telopeptide of collagen (CTX), a marker of bone resorption, was measured by a rodent specific ELISA assay (Nordic Bioscience Diagnostics A/S, Herlev, Denmark). Serum osteocalcin, a specific marker for bone formation, was measured using Rat-MID™ Osteocalcin ELISA kit (Nordic Bioscience Diagnostics A/S, Herlev, Denmark).
Thymidine incorporation assay
SC proliferation was quantitated by thymidine incorporation. SCs were seeded in equal number, cultured for 3 days and pulsed with 3H-thymidine (0.5 µCi/well), added during the last 18 h of culture. Cells were harvested by using a Cell Harvester (Skatron, Sterling, VA) and thymidine incorporation determined on a Packard TRI-CARB 4640 liquid Scintillation Counter.
Apoptotic cell assay
SCs were seeded in equal number and cultured for 3 days. Apoptotic SCs were stained by DeadEnd™ Colorimetric TUNEL System (Promega, Madison, WI) according to the manufacturer’s instruction. The number of apoptotic cells were counted and expressed as a percentage of total cells.
Real-Time RT-PCR
RANKL, and OPG mRNA were quantitated by real-time PCR using a GeneAmp 7000 system (PE Biosystems) as previously described (Cenci et al., 2003). All primers for real time PCR were designed by using Primer Express® Software v2.0 (PE Biosystems ). The primers used were: 5’-CAC AGC GCT TCT CAG GAG CT-3’ (forward) and 5’-CAT CCA ACC ATG AGC CTT CC-3’ (reverse) for RANKL, and 5’-CTT GGG TCT GTT GCT TGG TGA-3’ (forward) and 5’-GCC GCT TCC TTA CAC ACC AG-3’(reverse) for OPG. mRNA was normalized against β tubulin by using the primers 5′-GGA GAG CTG TGA TTG CCT GC (forward) and 5′-CCA CCC AGT GAG TGG GTC AG-3′ (reverse). Amplification reactions were performed in 25µl containing 0.5 µM of primers, dNTPs (0.2 mM each) in PCR buffer and 0.03 U Taq polymerase along with SYBR-green (Molecular Probes, Eugene, OR). Dissociation curves revealed a single product in all cases. Fold change in cDNA concentration was calculated as described (Cenci et al., 2003) with normalization of input using β tubulin.
Statistical Analysis
For each outcome, a two-way analysis-of-variance was applied that included the main effects for animal strain and treatment plus the statistical interaction between animal strain and treatment. When the statistical interaction between animal strain and treatment group was not statistically significant (P > 0.05) nor suggestive of an important interaction (P > 0.10) p values for the main effects tests were reported. When the statistical interaction was statistically significant or suggestive of an important interaction then t-tests were used to compare the differences between the treatment means for each animal strain, applying the Bonferroni correction for multiple comparisons. Simple comparisons were made using unpaired students t- test to evaluate the effects of sCD40L on SC proliferation and apoptosis.
Supplementary Material
ACKNOWLEDGMENTS
This study was supported, in part, by grants from the National Institutes of Health (AR54625 and AG28278) and the University Research Committee of Emory University. NMW was supported in part by grants from the National Institutes of Health (AR053607 and DK067389), and the University Research Committee of Emory University. We are grateful to Dr. Laurie McCauley at Michigan University and Dr. Gilbert Kersh at Emory University for their suggestions and review of the manuscript, and the University of Alabama at Birmingham, Center for Metabolic Bone Disease-Histomorphometry and Molecular Analysis Core Laboratory, NIH Grant P30-AR46031 for the histomorphometric analysis presented herein.
Abbreviations
- BM
Bone marrow
- BMM
BM macrophage
- BMD
Bone mineral density
- OB
osteoblast
- OC
osteoclast
- µCT
micro computerized tomography
- M-CSF
macrophage colony stimulating factor
- PHP
primary hyperparathyroidism
- RANKL
receptor activator of nuclear factor-κB ligand
- SCs
stromal cell
- BV/TV
Trabecular bone volume
- TNF
Tumor necrosis factor
- CTX
C-terminal telopeptides
- TRAP
tartrate-resistant acid phosphatase
Footnotes
Publisher's Disclaimer: This is a PDF file of an unedited manuscript that has been accepted for publication. As a service to our customers we are providing this early version of the manuscript. The manuscript will undergo copyediting, typesetting, and review of the resulting proof before it is published in its final citable form. Please note that during the production process errors may be discovered which could affect the content, and all legal disclaimers that apply to the journal pertain.
REFERENCES
- Ahuja SS, Zhao S, Bellido T, Plotkin LI, Jimenez F, Bonewald LF. CD40 ligand blocks apoptosis induced by tumor necrosis factor alpha, glucocorticoids, and etoposide in osteoblasts and the osteocyte-like cell line murine long bone osteocyte-Y4. Endocrinology. 2003;144:1761–1769. doi: 10.1210/en.2002-221136. [DOI] [PubMed] [Google Scholar]
- Alexiewicz JM, Klinger M, Pitts TO, Gaciong Z, Linker-Israeli M, Massry SG. Parathyroid hormone inhibits B cell proliferation: implications in chronic renal failure. J Am Soc Nephrol. 1990;1:236–244. doi: 10.1681/ASN.V13236. [DOI] [PubMed] [Google Scholar]
- Calvi LM, Sims NA, Hunzelman JL, Knight MC, Giovannetti A, Saxton JM, Kronenberg HM, Baron R, Schipani E. Activated parathyroid hormone/parathyroid hormone-related protein receptor in osteoblastic cells differentially affects cortical and trabecular bone. J Clin Invest. 2001;107:277–286. doi: 10.1172/JCI11296. [DOI] [PMC free article] [PubMed] [Google Scholar]
- Canalis E, Giustina A, Bilezikian JP. Mechanisms of anabolic therapies for osteoporosis. N Engl J Med. 2007;357:905–916. doi: 10.1056/NEJMra067395. [DOI] [PubMed] [Google Scholar]
- Cenci S, Toraldo G, Weitzmann MN, Roggia C, Gao Y, Qian WP, Sierra O, Pacifici R. Estrogen deficiency induces bone loss by increasing T cell proliferation and lifespan through IFN-gamma-induced class II transactivator. Proc Natl Acad Sci U S A. 2003;100:10405–10410. doi: 10.1073/pnas.1533207100. [DOI] [PMC free article] [PubMed] [Google Scholar]
- Chen SH, Pham-Nguyen KB, Martinet O, Huang Y, Yang W, Thung SN, Chen L, Mittler R, Woo SL. Rejection of disseminated metastases of colon carcinoma by synergism of IL-12 gene therapy and 4-1BB costimulation. Mol Ther. 2000;2:39–46. doi: 10.1006/mthe.2000.0086. [DOI] [PubMed] [Google Scholar]
- Cheng X, Li J, Lu Y, Keyak J, Lang T. Proximal femoral density and geometry measurements by quantitative computed tomography: Association with hip fracture. Bone. 2006 doi: 10.1016/j.bone.2006.06.018. [DOI] [PubMed] [Google Scholar]
- Clark P, Normansell DE. Phenotype analysis of lymphocyte subsets in normal human bone marrow. Am J Clin Pathol. 1990;94:632–636. doi: 10.1093/ajcp/94.5.632. [DOI] [PubMed] [Google Scholar]
- Clowes JA, Riggs BL, Khosla S. The role of the immune system in the athophysiology of osteoporosis. Immunol Rev. 2005;208:207–227. doi: 10.1111/j.0105-2896.2005.00334.x. [DOI] [PubMed] [Google Scholar]
- Corbi AL, Lopez-Rodriguez C. CD11c integrin gene promoter activity during myeloid differentiation. Leuk Lymphoma. 1997;25:415–425. doi: 10.3109/10428199709039028. [DOI] [PubMed] [Google Scholar]
- Dempster DW, Cosman F, Parisien M, Shen V, Lindsay R. Anabolic actions of parathyroid hormone on bone. Endocr Rev. 1993;14:690–709. doi: 10.1210/edrv-14-6-690. [DOI] [PubMed] [Google Scholar]
- Dempster DW, Parisien M, Silverberg SJ, Liang XG, Schnitzer M, Shen V, Shane E, Kimmel DB, Recker R, Lindsay R, Bilezikian JP. On the mechanism of cancellous bone preservation in postmenopausal women with mild primary hyperparathyroidism. J Clin Endocrinol Metab. 1999;84:1562–1566. doi: 10.1210/jcem.84.5.5652. [DOI] [PubMed] [Google Scholar]
- Di Rosa F, Pabst R. The bone marrow: a nest for migratory memory T cells. Trends Immunol. 2005;26:360–366. doi: 10.1016/j.it.2005.04.011. [DOI] [PubMed] [Google Scholar]
- Everts V, Delaisse JM, Korper W, Jansen DC, Tigchelaar-Gutter W, Saftig P, Beertsen W. The bone lining cell: its role in cleaning Howship's lacunae and initiating bone formation. J Bone Miner Res. 2002;17:77–90. doi: 10.1359/jbmr.2002.17.1.77. [DOI] [PubMed] [Google Scholar]
- Gao Y, Grassi F, Ryan MR, Terauchi M, Page K, Yang X, Weitzmann MN, Pacifici R. IFN-gamma stimulates osteoclast formation and bone loss in vivo via antigen-driven T cell activation. J Clin Invest. 2007;117:122–132. doi: 10.1172/JCI30074. [DOI] [PMC free article] [PubMed] [Google Scholar]
- Gao Y, Qian WP, Dark K, Toraldo G, Lin AS, Guldberg RE, Flavell RA, Weitzmann MN, Pacifici R. Estrogen prevents bone loss through transforming growth factor beta signaling in T cells. Proc Natl Acad Sci U S A. 2004;101:16618–16623. doi: 10.1073/pnas.0404888101. [DOI] [PMC free article] [PubMed] [Google Scholar]
- Grcevic D, Lee SK, Marusic A, Lorenzo JA. Depletion of CD4 and CD8 T lymphocytes in mice In vivo enhances 1, 25- dihydroxyvitamin D(3)-stimulated osteoclast-like cell formation In vitro by a mechanism that is dependent on prostaglandin synthesis. J Immunol. 2000;165:4231–4238. doi: 10.4049/jimmunol.165.8.4231. [DOI] [PubMed] [Google Scholar]
- Grey AB, Stapleton JP, Evans MC, Reid IR. Accelerated bone loss in post-menopausal women with mild primary hyperparathyroidism. Clin Endocrinol (Oxf) 1996;44:697–702. doi: 10.1046/j.1365-2265.1996.744565.x. [DOI] [PubMed] [Google Scholar]
- Guise TA, Chirgwin JM, Favarato G, Boyce BF, Mundy GR. Chinese hamster ovarian cells transfected with human parathyroid hormone-related protein cDNA cause hypercalcemia in nude mice. Lab Invest. 1992;67:477–485. [PubMed] [Google Scholar]
- Hory BG, Roussanne MC, Rostand S, Bourdeau A, Drueke TB, Gogusev J. Absence of response to human parathyroid hormone in athymic mice grafted with human parathyroid adenoma, hyperplasia or parathyroid cells maintained in culture. J Endocrinol Invest. 2000;23:273–279. doi: 10.1007/BF03343723. [DOI] [PubMed] [Google Scholar]
- Iida-Klein A, Lu SS, Kapadia R, Burkhart M, Moreno A, Dempster DW, Lindsay R. Short-term continuous infusion of human parathyroid hormone 1–34 fragment is catabolic with decreased trabecular connectivity density accompanied by hypercalcemia in C57BL/J6 mice. J Endocrinol. 2005;186:549–557. doi: 10.1677/joe.1.06270. [DOI] [PubMed] [Google Scholar]
- Kitaura H, Sands MS, Aya K, Zhou P, Hirayama T, Uthgenannt B, Wei S, Takeshita S, Novack DV, Silva MJ, Abu-Amer Y, Ross FP, Teitelbaum SL. Marrow stromal cells and osteoclast precursors differentially contribute to TNF-alpha-induced osteoclastogenesis in vivo. J Immunol. 2004;173:4838–4846. doi: 10.4049/jimmunol.173.8.4838. [DOI] [PubMed] [Google Scholar]
- Koh AJ, Demiralp B, Neiva KG, Hooten J, Nohutcu RM, Shim H, Datta NS, Taichman RS, McCauley LK. Cells of the osteoclast lineage as mediators of the anabolic actions of parathyroid hormone in bone. Endocrinology. 2005;146:4584–4596. doi: 10.1210/en.2005-0333. [DOI] [PubMed] [Google Scholar]
- Kong YY, Feige U, Sarosi I, Bolon B, Tafuri A, Morony S, Capparelli C, Li J, Elliott R, McCabe S, Wong T, Campagnuolo G, Moran E, Bogoch ER, Van G, Nguyen LT, Ohashi PS, Lacey DL, Fish E, Boyle WJ, Penninger JM. Activated T cells regulate bone loss and joint destruction in adjuvant arthritis through osteoprotegerin ligand. Nature. 1999;402:304–309. doi: 10.1038/46303. [DOI] [PubMed] [Google Scholar]
- Lee SK, Kadono Y, Okada F, Jacquin C, Koczon-Jaremko B, Gronowicz G, Adams DJ, Aguila HL, Choi Y, Lorenzo JA. T lymphocyte-deficient mice lose trabecular bone mass with ovariectomy. J Bone Miner Res. 2006;21:1704–1712. doi: 10.1359/jbmr.060726. [DOI] [PubMed] [Google Scholar]
- Li Y, Toraldo G, Li A, Yang X, Zhang H, Qian WP, Weitzmann MN. B cells and T cells are critical for the preservation of bone homeostasis and attainment of peak bone mass in vivo. Blood. 2007;109:3839–3848. doi: 10.1182/blood-2006-07-037994. [DOI] [PMC free article] [PubMed] [Google Scholar]
- Lotinun S, Evans GL, Bronk JT, Bolander ME, Wronski TJ, Ritman EL, Turner RT. Continuous parathyroid hormone induces cortical porosity in the rat: effects on bone turnover and mechanical properties. J Bone Miner Res. 2004;19:1165–1171. doi: 10.1359/JBMR.040404. [DOI] [PubMed] [Google Scholar]
- Ma YL, Cain RL, Halladay DL, Yang X, Zeng Q, Miles RR, Chandrasekhar S, Martin TJ, Onyia JE. Catabolic effects of continuous human PTH (1--38) in vivo is associated with sustained stimulation of RANKL and inhibition of osteoprotegerin and gene-associated bone formation. Endocrinology. 2001;142:4047–4054. doi: 10.1210/endo.142.9.8356. [DOI] [PubMed] [Google Scholar]
- Mehdizadeh S, Alaghband-Zadeh J, Gusterson B, Arlot M, Bradbeer JN, Loveridge N. Bone resorption and circulating PTH-like bioactivity in an animal model of hypercalcaemia of malignancy. Biochem Biophys Res Commun. 1989;161:1166–1171. doi: 10.1016/0006-291x(89)91364-8. [DOI] [PubMed] [Google Scholar]
- Neer RM, Arnaud CD, Zanchetta JR, Prince R, Gaich GA, Reginster JY, Hodsman AB, Eriksen EF, Ish-Shalom S, Genant HK, Wang O, Mitlak BH. Effect of parathyroid hormone (1–34) on fractures and bone mineral density in postmenopausal women with osteoporosis. N Engl J Med. 2001;344:1434–1441. doi: 10.1056/NEJM200105103441904. [DOI] [PubMed] [Google Scholar]
- O'Brien C, Fu Q, Mommsen L, Dusevich V, Bonewald L, Manolagas SC, Jilka RL. Osteoblasts are not the source of RANKL and OPG in bone but are required for maintenance of osteoclast function. Journal Bone Mineral Research. 2006;22 abstract. [Google Scholar]
- O'Sullivan B, Thomas R. Recent advances on the role of CD40 and dendritic cells in immunity and tolerance. Curr Opin Hematol. 2003;10:272–278. doi: 10.1097/00062752-200307000-00004. [DOI] [PubMed] [Google Scholar]
- Parfitt AM, Drezner MK, Glorieux FH, Kanis JA, Malluche H, Meunier PJ, Ott SM, Recker RR. Bone histomorphometry: standardization of nomenclature, symbols, and units. Report of the ASBMR Histomorphometry Nomenclature Committee. J Bone Miner Res. 1987;2:595–610. doi: 10.1002/jbmr.5650020617. [DOI] [PubMed] [Google Scholar]
- Parisien M, Dempster DW, Shane E, Bilezikian JP. The parathyroids. Basic and clinical concepts. San Diego: Academic Press; 2001. Histomorphometric analysis of bone in primary hyperparathyroidism; pp. 423–436. [Google Scholar]
- Potts J. Primary hyperparathyroidism. In: Krane LVAaS., editor. Metabolic Bone Diseases. San Diego: Academic Press; 1998. pp. 411–442. [Google Scholar]
- Qin L, Raggatt LJ, Partridge NC. Parathyroid hormone: a double-edged sword for bone metabolism. Trends Endocrinol Metab. 2004;15:60–65. doi: 10.1016/j.tem.2004.01.006. [DOI] [PubMed] [Google Scholar]
- Quarles LD, Yohay DA, Lever LW, Caton R, Wenstrup RJ. Distinct proliferative and differentiated stages of murine MC3T3-E1 cells in culture: an in vitro model of osteoblast development. J Bone Miner Res. 1992;7:683–692. doi: 10.1002/jbmr.5650070613. [DOI] [PubMed] [Google Scholar]
- Rifas L, Arackal S. T cells regulate the expression of matrix metalloproteinase in human osteoblasts via a dual mitogen-activated protein kinase mechanism. Arthritis Rheum. 2003;48:993–1001. doi: 10.1002/art.10872. [DOI] [PubMed] [Google Scholar]
- Rifas L, Arackal S, Weitzmann MN. Inflammatory T cells rapidly induce differentiation of human bone marrow stromal cells into mature osteoblasts. Journal of cellular biochemistry. 2003;88:650–659. doi: 10.1002/jcb.10436. [DOI] [PubMed] [Google Scholar]
- Rifas L, Avioli LV. A novel T cell cytokine stimulates interleukin-6 in human osteoblastic cells. J Bone Miner Res. 1999;14:1096–1103. doi: 10.1359/jbmr.1999.14.7.1096. [DOI] [PubMed] [Google Scholar]
- Riggs BL, Khosla S, Melton LJ., 3rd Sex steroids and the construction and conservation of the adult skeleton. Endocr Rev. 2002;23:279–302. doi: 10.1210/edrv.23.3.0465. [DOI] [PubMed] [Google Scholar]
- Riggs BL, Melton LJ. Medical progress: involutional osteoporosis. N. Eng. J. Med. 1986;314:1676–1684. doi: 10.1056/NEJM198606263142605. [DOI] [PubMed] [Google Scholar]
- Schachter P, Christy MD, Leight GS, Jr, Lobaugh B. Function in athymic nude mice of parathyroid heterografts from patients with primary hyperparathyroidism and secondary hyperparathyroidism. Surgery. 1990;108:1040–1046. [PubMed] [Google Scholar]
- Shurtz-Swirski R, Shkolnik T, Shasha SM. Parathyroid hormone and the cellular immune system. Nephron. 1995;70:21–24. doi: 10.1159/000188538. [DOI] [PubMed] [Google Scholar]
- Silverberg SJ, Shane E, de la Cruz L, Dempster DW, Feldman F, Seldin D, Jacobs TP, Siris ES, Cafferty M, Parisien MV, et al. Skeletal disease in primary hyperparathyroidism. J Bone Miner Res. 1989;4:283–291. doi: 10.1002/jbmr.5650040302. [DOI] [PubMed] [Google Scholar]
- Strieth S, von Johnston V, Eichhorn ME, Enders G, Krasnici S, Thein E, Hammer C, Dellian M. A new animal model to assess angiogenesis and endocrine function of parathyroid heterografts in vivo. Transplantation. 2005;79:392–400. doi: 10.1097/01.tp.0000151633.92173.75. [DOI] [PubMed] [Google Scholar]
- Tanaka Y, Maruo A, Fujii K, Nomi M, Nakamura T, Eto S, Minami Y. Intercellular adhesion molecule 1 discriminates functionally different populations of human osteoblasts: characteristic involvement of cell cycle regulators. J Bone Miner Res. 2000;15:1912–1923. doi: 10.1359/jbmr.2000.15.10.1912. [DOI] [PubMed] [Google Scholar]
- Taubman MA, Kawai T. Involvement of T-lymphocytes in periodontal disease and in direct and indirect induction of bone resorption. Crit Rev Oral Biol Med. 2001;12:125–135. doi: 10.1177/10454411010120020301. [DOI] [PubMed] [Google Scholar]
- Teitelbaum SL. Postmenopausal osteoporosis, T cells, and immune dysfunction. Proc Natl Acad Sci U S A. 2004;101:16711–16712. doi: 10.1073/pnas.0407335101. [DOI] [PMC free article] [PubMed] [Google Scholar]
- Toraldo G, Roggia C, Qian WP, Pacifici R, Weitzmann MN. IL-7 induces bone loss in vivo by induction of receptor activator of nuclear factor kappa B ligand and tumor necrosis factor alpha from T cells. Proc Natl Acad Sci U S A. 2003;100:125–130. doi: 10.1073/pnas.0136772100. [DOI] [PMC free article] [PubMed] [Google Scholar]
- Uy HL, Guise TA, De La Mata J, Taylor SD, Story BM, Dallas MR, Boyce BF, Mundy GR, Roodman GD. Effects of parathyroid hormone (PTH)-related protein and PTH on osteoclasts and osteoclast precursors in vivo. Endocrinology. 1995;136:3207–3212. doi: 10.1210/endo.136.8.7628353. [DOI] [PubMed] [Google Scholar]
- Weir EC, Lowik CW, Paliwal I, Insogna KL. Colony stimulating factor-1 plays a role in osteoclast formation and function in bone resorption induced by parathyroid hormone and parathyroid hormone-related protein. J Bone Miner Res. 1996;11:1474–1481. doi: 10.1002/jbmr.5650111014. [DOI] [PubMed] [Google Scholar]
- Weitzmann MN, Pacifici R. The role of T lymphocytes in bone metabolism. Immunol Rev. 2005;208:154–168. doi: 10.1111/j.0105-2896.2005.00324.x. [DOI] [PubMed] [Google Scholar]
- Young N, Mikhalkevich N, Yan Y, Chen D, Zheng WP. Differential regulation of osteoblast activity by Th cell subsets mediated by parathyroid hormone and IFN-gamma. J Immunol. 2005;175:8287–8295. doi: 10.4049/jimmunol.175.12.8287. [DOI] [PMC free article] [PubMed] [Google Scholar]
- Zhou H, Shen V, Dempster DW, Lindsay R. Continuous parathyroid hormone and estrogen administration increases vertebral cancellous bone volume and cortical width in the estrogen-deficient rat. J Bone Miner Res. 2001;16:1300–1307. doi: 10.1359/jbmr.2001.16.7.1300. [DOI] [PubMed] [Google Scholar]
Associated Data
This section collects any data citations, data availability statements, or supplementary materials included in this article.