

Abstract
Purpose
Cancer therapies with mechanisms of action which are very different from the more conventional chemotherapies are now being developed. In this article, we investigate the performance of several phase III clinical trial designs, both for testing the overall efficacy of a targeted agent and for testing its efficacy in a subgroup of patients with a tumor marker present. We study different designs and different underlying scenarios assuming continuous markers, and assess the trade-off between the number of patients on the study and the effectiveness of treatment in the subgroup of marker-positive patients.
Experimental Design
We investigate binary outcomes and use simulation studies to determine sample size and power for the different designs and the various scenarios. We also simulate marker prevalence and marker misclassification and evaluate their effect on power and sample size.
Results
In general, a targeted design which randomizes patients with the appropriate marker status performs the best in all scenarios with an underlying true predictive marker. Randomizing all patients regardless of their marker values performs as well as or better in most cases than a clinical trial that randomizes the patient to a treatment strategy based on marker value versus standard of care.
Conclusion
If there is the possibility that the new treatment helps marker-negative patients, or that the cutpoint determining marker status has not been well established and the marker prevalence is large enough, we recommend randomizing all patients regardless of marker values, but using a design such that both the overall and the targeted subgroup hypothesis can be tested.
The paradigm of cancer research has been changing and cancer therapies with new mechanisms of action from conventional chemotherapies are being developed. Conventional chemotherapies are also often known as cytotoxic agents, and use various mechanisms important in mitosis to kill dividing cells, such as tumor cells. Cytostatic agents, on the other hand, exploit alternate mechanisms, such as inhibiting the formation of new blood vessels (antiangiogenic agents), initiating tumor cell death (proapoptotic agents), or inhibiting tumor cell division (epidermal growth factor inhibitors). Many newer therapies (including both cytostatic and cytotoxic agents) are also often referred to as targeted because they target specific molecules or pathways important to cancer cells. It is expected that by focusing treatment on important molecules or mechanisms, the therapies will be more effective and result in less toxicity than many traditional treatments. Although many of these compounds are at a preclinical stage or in early clinical testing, there are already some well known targeted therapies.
Gleevec (imatinib mesylate) is a small-molecule drug approved by the Food and Drug Administration to treat chronic myelogenous leukemia. Gleevec interferes with the protein produced by the bcr/abl oncogene. Velcade (bortezomib) is a proteasome-directed drug approved by the Food and Drug Administration to treat multiple myeloma and is being tested in other cancers. Another approved targeted agent is Herceptin (trastuzumab), which blocks the effects of the growth factor protein Her-2, which transmits growth signals to breast cancer cells. Iressa (gefitinib) and Tarceva (erlotinib) both target the epidermal growth factor receptor. Recent phase III studies do not support the use of Iressa; however, a phase III trial of Tarceva showed a significant improvement in the survival of non–small cell lung cancer (1).
The story for epidermal growth factor receptor inhibitors is complicated because there may be benefits in the subgroup of patients who are nonsmokers due to genetic differences in the tumors. It is not clear if the survival benefit may be due to mutations, gene copy number, or protein expression (2). The results for these epidermal growth factor receptor inhibitors motivate several more general targeted therapy questions. Is there a genetic subgroup in which such treatments are effective (or more effective), and how should study designs be modified where feasible? Should all patients of a particular tumor type be treated with a targeted agent or should only those patients who are positive for the target (or marker) be so treated? As mentioned previously, traditional cytotoxic agents target dividing cells, killing tumor cells but at the cost of collateral damage (toxicity), especially for other organs with a high proliferative fraction. Also, targeted agents can have collateral benefit in that they can be effective in patients classified as negative for the target, either because there is a weak signal for the target in such patients or because the agent hits a different target. For example, there is now evidence that trastuzumab has some effect in Her-2/neu-negative breast cancer patients (3). Another example is imatinib, which was developed to target the chronic myelogenous leukemia–defining bcr/abl translocation but also destroys tumor cells that are c-kit–positive (which virtually defines gastrointestinal stromal tumors; ref. 4).
Technologic and scientific advances in fields such as gene expression profiling and proteomics have made it possible to detect possible tumor markers very efficiently. Research laboratories at universities and pharmaceutical companies have been very productive in developing targeted agents specifically for those tumor markers. The next challenge then is to validate such biomarkers in the clinical trial setting and to determine the subgroup of patients with good prognosis and the subgroup of patients most likely to benefit from a new therapy as a function of these biomarkers. Hoering and Crowley (5) recently discussed some general issues with respect to targeted therapies and cytostatic agents in the context of clinical trials for multiple myeloma.
Two classes of biomarkers can be distinguished. Prognostic markers give information about a likely disease outcome independent of a treatment and can be used for risk stratification. For example, patients at high risk, who do poorly with conventional approaches, may be treated more aggressively or may be reserved for highly experimental regimens. Other markers, on the other hand, give information on a likely disease outcome based on a specific treatment. These therefore represent treatment by marker interactions, and are now known in some clinical literature as predictive markers (6). Predictive markers can be used to indicate which patients should be treated with a particular targeted agent (developed to attack that marker). In general, a prognostic marker is not necessarily a predictive marker, but the hope is that some of the prognostic markers may be predictive as well.
Such markers are often based on levels of a specific chemical in the blood or in other tissue compartments, on the abundance of certain proteins or peptides, or on a combination of gene expression levels. Thus, in practice, the underlying marker distribution and the response probability as a function of the marker value is often continuous. The actual cutpoint to distinguish marker-positive from marker-negative patients may not be able to be determined precisely or the best cutpoint among various possibilities may be unknown. In that scenario, it is advantageous to take the actual marker distribution into account when designing the trial. In this article, we investigate the performance of several phase III clinical trial designs, both for testing the overall efficacy of a new regimen and for testing its efficacy in a subgroup of patients with a tumor marker. We study the effect of designs assuming continuous markers to assess the trade-off between the number of patients on the study and the effectiveness of treatment in the subgroup. This formulation also allows us to explore the effect of marker prevalence in the patient population and the effect of marker misclassification if the actual cutpoint that distinguishes the group of patients associated with the greatest potential treatment effect is not known. We investigate possible trial designs for predictive markers, but we also consider scenarios with an underlying prognostic marker, as it is often unknown whether or not a novel marker is prognostic or predictive. The results of this investigation can serve as a guide in the decision as to which trial design to use in a specific situation. Although we present the results for binary outcome data, the same strategy can be easily implemented for other outcomes including survival data.
Phase III Trial Designs for Targeted Agents
A variety of designs for assessing targeted treatments using biomarkers have been proposed. Figure 1 illustrates three such phase III trial designs for predictive markers. For illustration purposes, we restrict our discussion to two treatments, T1 and T2, where T1 could be the standard of care and T2 the new therapy of interest. These do not have to be limited to single agents but can include entire treatment strategies, as is common for many cancers. We also assume that the marker distinguishes between two groups, marker-positive patients (M+) and marker-negative patients (M-). It is conjectured that the new therapy to be studied, T2, benefits M+ patients. For this illustration, we also assume that for continuous markers, a cutpoint has been determined to distinguish these two groups.
Fig. 1.
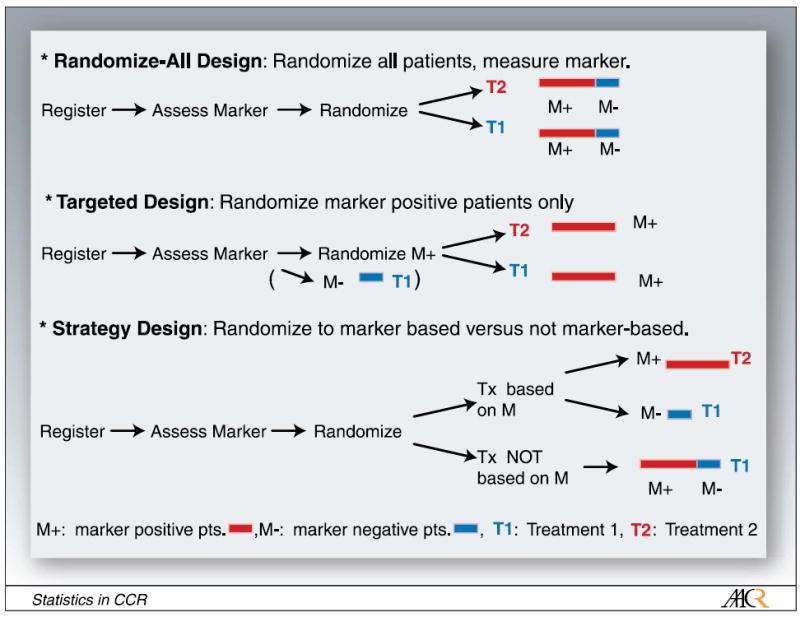
Possible clinical trial designs for targeted therapy: randomize-all design, targeted design, strategy design.
In the randomize-all design, the marker status of the patient is assessed and all patients are randomized to one of two treatments. The treatment assignment for patients can also be stratified by observed marker status. If stratification is deemed not necessary, assessing the marker status of the patient can occur after randomization, which may speed up the beginning of the treatment. If we hypothesize that the treatment is mostly efficacious in marker-positive patients, but it is unclear whether the therapy is beneficial (possibly to a lesser extent) for marker-negative patients as well, this is a good design to test for overall benefit, regardless of marker status, and to explore the M- and M+ subsets. One possibility is to use this design and power it for the subgroup of marker-positive patients. This will then allow us to determine, with appropriate power, whether or not the treatment is effective overall and in the subgroup of M+ patients. A similar procedure in the context of hazard ratios was recently discussed by Jiang et al. (7).
Simon and Maitournam (8) evaluated the efficiency of a targeted trial design. In this design, patients are first assessed for their marker value and only marker-positive patients are enrolled in the trial and randomized to the two treatment options. They evaluated the effectiveness of the targeted design versus the randomize-all design with respect to the number of patients required for screening and the number of patients needed for randomization. A targeted design proves to be a good design if the underlying pathways and biology are understood well enough, so that it is clear that the therapy under investigation only works for a specific subset of patients namely, marker-positive patients. Such a targeted design generally requires a smaller number of patients to be randomized than the randomize-all design to determine the efficaciousness of a new treatment in M+ patients; however, no insight is gained on the efficaciousness of the new treatment in M- patients, and a large number of patients still need to be assessed for their marker status. Freidlin and Simon (9) also proposed an adaptive two-stage trial design specifically for developing and assessing markers using gene expression profiling. We do not evaluate this trial design in our article as we focus our discussion on one-stage designs.
Hayes et al. (10) suggested a trial design for predictive markers, in which patients are randomized between marker-based treatment (M+ patients getting new therapy, M- patients getting standard of care) and every patient, independent of their marker status, getting standard of care. Such a trial is designed to test whether marker-based treatment strategy is superior to standard therapy. We refer to this trial design as the strategy design. Sargent and Allegra (11) suggested an augmented strategy design, extending this strategy design to cases in which patients are randomized between marker-based treatment (as in the strategy design) and treatment independent of marker, wherein a second randomization between new versus standard therapy is added to the latter arm. We evaluate the strategy design rather than the augmented strategy design because the former is more frequently used. As an example, the strategy design was recently used in a used in a non–small cell lung cancer trial to test individualized cisplatin-based chemotherapy dependent on the patient’s excision repair cross-complementing 1 mRNA (12).
These various trial designs test different hypotheses. The randomize-all design addresses the question of whether the treatment is beneficial for all patients, with the possibility of testing whether or not the new treatment is beneficial in the subset of marker-positive patients. We also investigate testing both the targeted and the overall hypothesis in the randomize-all design with appropriate adjustment for multiple comparisons. The targeted design tests whether or not the treatment is beneficial for marker-positive patients. The strategy design addresses the question of whether the marker-based treatment strategy is better than everyone receiving standard of care (T1) regardless of marker status. The strategy design does not directly address the question of whether treatment T2 is more efficacious than treatment T1; however, it is frequently used in that context and we therefore felt it important to assess its properties.
In this article, we evaluate the effectiveness of the randomize-all, the targeted, and the strategy phase III trial designs under several scenarios. These scenarios include the presence of a prognostic marker, several possible scenarios for the presence of a predictive marker, and the absence of a valid marker. We assume that the underlying distribution of the biomarker is continuous in nature. We further assume that a cutpoint is used to distinguish patients with marker values above (below) such a threshold, who are then referred to as marker-positive (negative) patients. We investigate the performance of several test statistics for the different trial designs discussed in this section as a function of the marker distribution and the marker cutoff. The performance is evaluated as a function of the cutpoint, the number of patients screened, and the number of patients randomized to obtain a certain power and significance for the various test statistics. We study these designs under some simple marker and effect assumptions.
Underlying Model Assumptions and Simulations
In practice, the underlying marker distribution, and the response probability as a function of the marker value, are often continuous. Assume that the log-transformed marker value X is normally distributed, X ~ N (μ,σ2), and its density function is denoted by f(X). Other distributional assumptions may be used instead. If multiple markers are of interest, a combined distribution of a linear combination of the markers can be used. We assume that two treatments, T1 and T2, are being investigated and that the treatment assignment has been determined using one of the various trial designs discussed above. The treatment assignment is indexed by j = 1,2 and we focus our analysis on binary outcomes. This approach, however, can easily be extended to a survival outcome. The expected outcome for the subgroup of M+ patients, M+ = {X:X > c} can be written, assuming a logit link, as
where c is the cutpoint that distinguishes M+ from M- subjects and where the fraction of marker-positive patients is given by νM+(c) = ∫x>cf (x)dx and the marker-negative fraction is given by νM−(c) = 1 − νM+(c). Analogous calculations for the M- patients give the summary measures, gj(c,M-) for those groups. We study design properties indexed by the cutpoint c. Therefore, important variables in the design assessments are [gj(c,M+),gj(c,M-), νM+(c)], which constitute the outcome and the fractions of patients in the M+ group.
Figure 2 presents several scenarios based on this simple marker treatment model. Scenario 1 is the scenario in which the marker under investigation is a false marker, i.e., it has no effect on the outcome. Scenarios 2 to 4 are different scenarios for a predictive marker. In scenario 2, the new treatment (T2) does not help M- patients more than the standard treatment (T1), but has additional benefit for marker-positive patients, increasing with the marker value. In scenario 3, the two treatment curves are diverging with increasing marker value. The marker does not have any effect on treatment 1, but the effect of treatment 2 is increasing with increasing marker value. In scenario 4, the new therapy benefits M+ patients, but has a negative effect on M- patients. Finally, for a prognostic marker, in which T2 is overall better than T1, both are increasing with increasing marker value (scenario 5). All these graphs are on a logit scale.
Fig. 2.
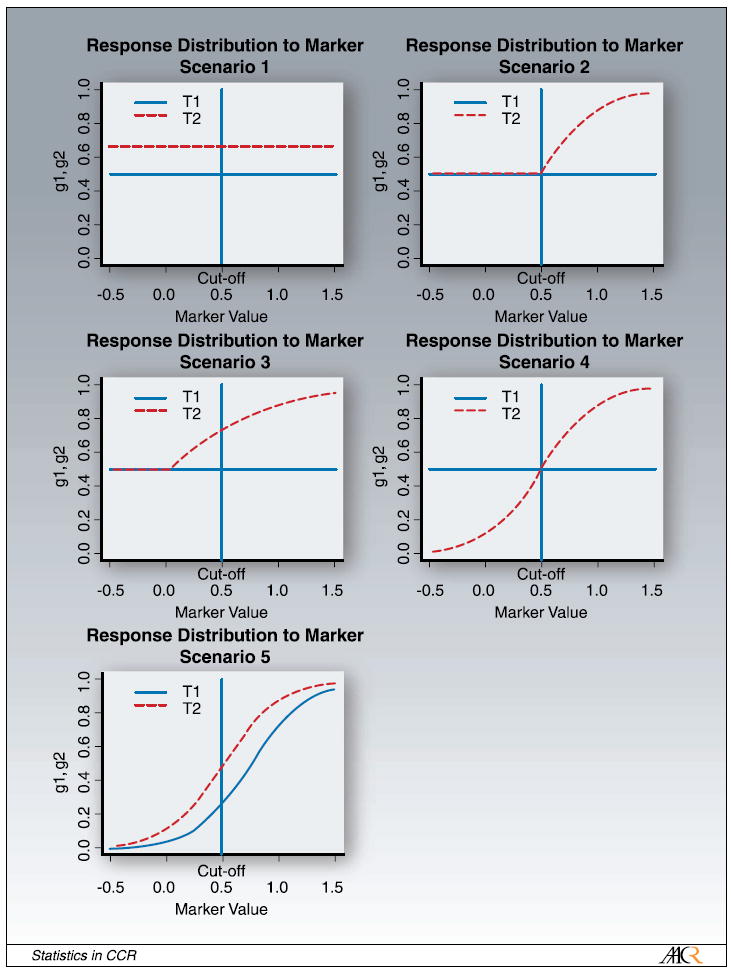
Scenarios for response distribution of marker. The response probability is plotted versus the log-transformed marker value x.
We investigate the overall performance of the different designs in the various scenarios discussed above. We simulate the underlying log-marker distribution from a normal distribution X ~ N(μ, σ2). We then evaluate the response probability to the marker using the distribution functions discussed above for the various scenarios. Appendix 1 lists the actual parameters used to evaluate the response probabilities for the five different scenarios. We did 5,000 simulations to calculate gj(c,M-) and gj(c,M+). Next, we use these derived quantities and evaluate power or sample size for the different scenarios assuming an underlying binomial distribution. For the power calculations, we used a one-sided significance level of α = 0.05.
Results
Figure 3 shows the power of the three designs as a function of the sample size of patients randomized for each of the five scenarios discussed earlier. In scenario 1, which is the scenario with no valid marker, the randomize-all and the targeted design achieve the same power for all sample sizes, as response to treatment is independent of the marker status. The lowest power is achieved with the strategy design as this design assigns subsets of patients in both of the randomized arms to the identical treatment, and is thus inefficient if there is no true underlying marker. For scenario 2, in which the new treatment T2 only helps patients with the marker, the targeted design outperforms both the randomize-all and the strategy design, as this is the scenario of a true marker for which this trial has been designed. The randomize-all design and the strategy design achieve the same power. This is due to the fact that in the experimental arm the same fraction of marker-positive patients are treated with the effective treatment T2 and the same fraction of marker-negative patients are treated with T1 (in the strategy design) or T2 (in the randomize-all design), and the effect of both treatments is the same for marker-negative patients. Scenario 3 is the scenario in which M- patients benefit less than M+ patients. In that scenario, the targeted design performs the best, followed by the randomize-all design, and then the strategy design. In this case, the efficacy is the largest in the M+ patients and is thus best picked up by the targeted design. The new therapy, however, also helps M- patients. This fact is missed by the targeted design because no information is obtained on M- patients. In the strategy design, the M- patients in the experimental arm are treated with the less effective treatment T1 and the power of that design is thus lower than that of the other two designs. In scenario 4, in which the new therapy is beneficial for M+ patients but is actually harmful for M- patients, the targeted design outperforms the others. The randomize-all design does the worst, as the two effects in this example cancel each other out. Lastly, in scenario 5, the example for a purely prognostic marker, the targeted design performs the best, followed by the randomize-all design and lastly the strategy design.
Fig. 3.
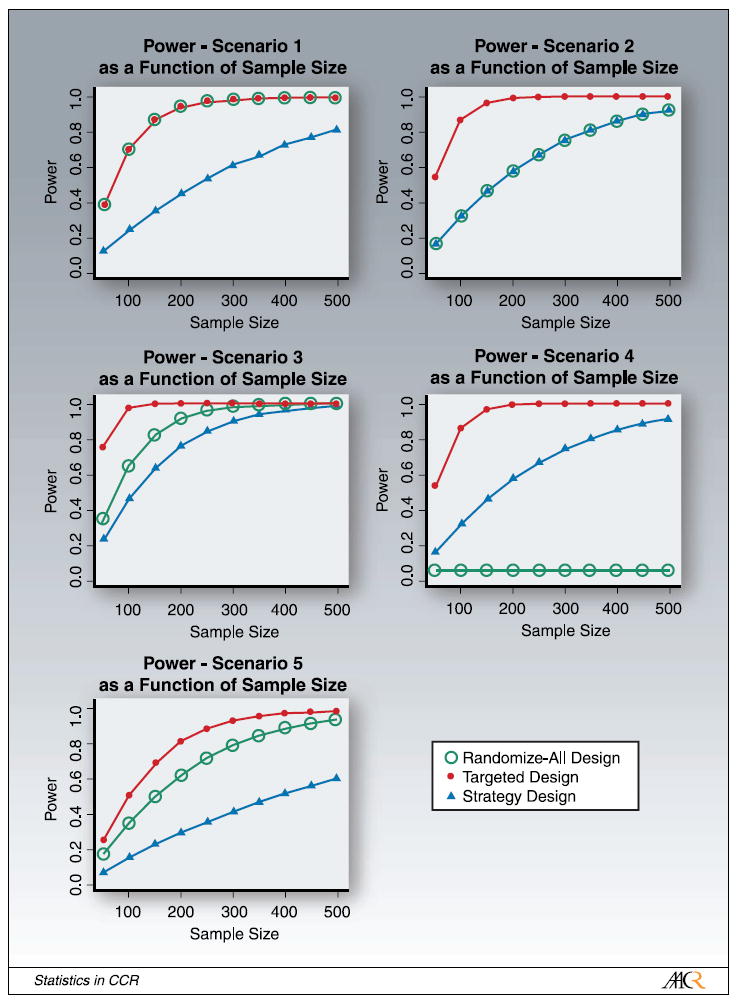
Power of the randomize-all, targeted, and strategy designs as a function of sample size (number of randomized patients) for the different scenarios. In scenario1, the power of the randomize-all and targeted designs are identical. In scenario 2, the power of the randomize-all and strategy designs are identical.
For a new marker or a new assay that has not yet been thoroughly tested, the cutpoint corresponding to the strongest therapeutic effect is often not known precisely. Using an underlying continuous marker model makes it possible to investigate this effect on power and sample size for the various scenarios. We thus perform simulation studies in which we vary the cutpoint c, which distinguishes M+ from M- patients, illustrated in Fig. 4. We keep the normal distribution of the log-transformed marker-value centered at the midpoint μ = 0.5, but the cutpoint is shifted by δ to c′ = c + δ . Shifting the cutpoint results in some patients being incorrectly (or inappropriately) classified as M+, when treatment T2 is not more effective for this patient and vice versa.
Fig. 4.
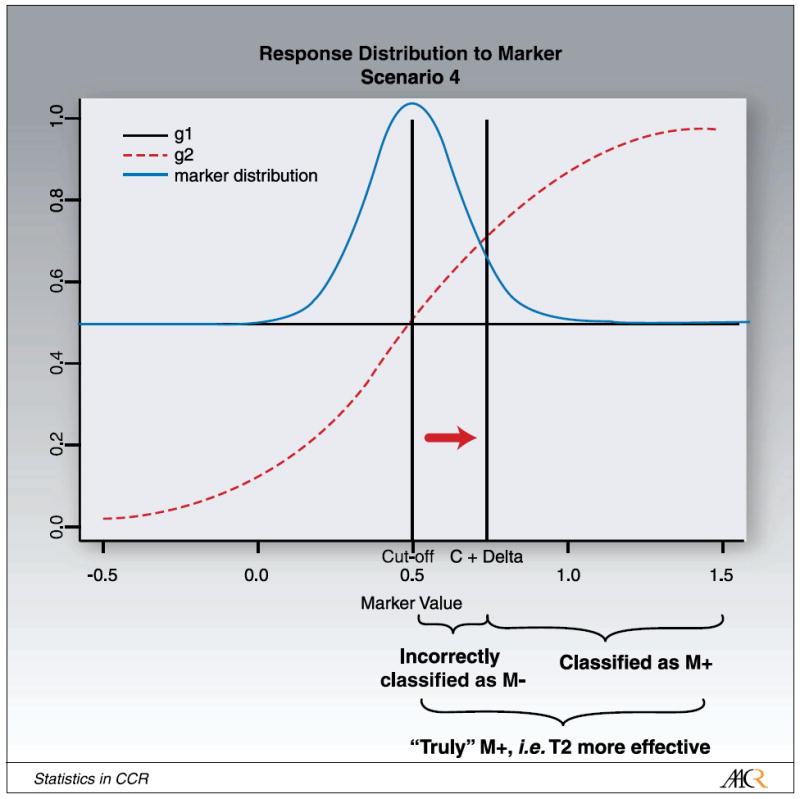
Illustration for shifting the cutpoint from “cutoff” to “C + Δ ”.
We investigated the effect on power for a fixed sample size in the three designs. Moving the cutpoint does not affect power in the randomize-all design, as all patients are being randomized independent of their marker status and the underlying marker distribution is not affected by moving the cutpoint. Moving the cutpoint has an effect on whether a subject is classified as being marker-positive or being marker-negative and thus has a large effect on power for the targeted and the strategy design.
We found that overall, the improvements in power for the targeted design are impressive for most scenarios. Only in the case in which there is a constant odds ratio between treatment arms is there a decrease in power for the targeted design, and then only for the most extreme marker group. The worst case for the randomize-all design is the hypothetical total interaction model of scenario 4, in which the overall treatment effect is null. This is also the only case in which the strategy design performs slightly better than the randomize-all design.
We also explored the effect of maker prevalence in the patient population on power for the different designs and scenarios. In our simulations, we achieve this by shifting the marker distribution, but leaving the cutpoint at X = 0.5. Shifting the marker distribution increases or decreases the fraction of M+ and M- patients, illustrated in Fig. 5. The extreme case with the mean of the distribution beyond the left edge of Fig. 5, μ = -∞, corresponds to all patients being marker-negative, the other extreme case with the mean of the distribution beyond the right edge of Fig. 5, μ = +∞, corresponds to all patients being marker-positive. In the latter case, all three designs are the same. The mid-point, μ = 0.5, corresponds to the case in which the number of marker-positive and marker-negative patients is the same.
Fig. 5.
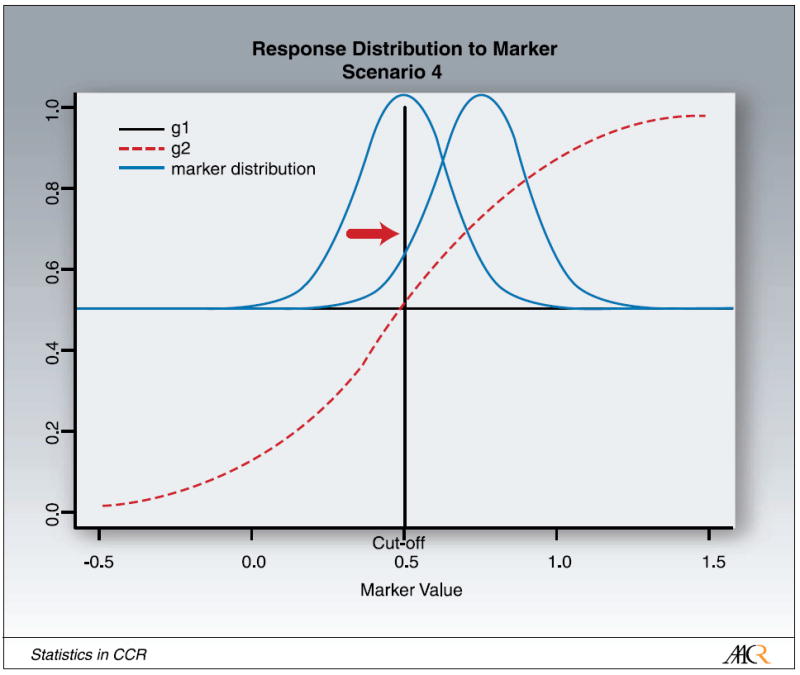
Illustration for shifting the marker distribution.
We evaluated the effect of marker prevalence on power and sample size. The targeted design performs the best in all scenarios with an underlying true predictive marker (scenarios 2-4). In those scenarios, the treatment benefit for M+ patients is diluted in the randomize-all and strategy designs and many more patients are needed to test the respective hypothesis. The targeted design, however, misses the benefit of the T2 for marker-negative patients in scenario 3. In the case of a prognostic marker (scenario 5) with a constant odds ratio between treatment arms, the targeted design has smaller power than the randomize-all design but only for the extreme marker values when the cutpoint is shifted such that most patients are marker-negative. The randomize-all design performs as well, or in most cases, better than the strategy design except for the hypothetical total interaction model of scenario 4, in which the overall treatment effect is null.
Next, we studied the feasibility and performance of testing both the overall and the targeted hypotheses in the randomize-all design, with appropriate adjustment for multiple comparisons. We split the significance level α and test the overall hypothesis at α = 0.04 and the targeted hypothesis at α = 0.01. Other splits of the significance level can be considered, but the outcome would qualitatively stay the same. Figure 6 summarizes our results for power versus sample size for all five scenarios. The solid lines represent the power for each hypothesis with split α. To get a sense of the effect of a reduced α on power, we also include the power for both hypotheses for α = 0.05 (dashed lines). In general, there is little change in power for the overall hypothesis for α = 0.04 versus α = 0.05. The change in power for the targeted hypothesis for α = 0.01 versus α = 0.05 is slightly larger because there is a larger difference in α. The main question, however, is whether it is feasible to test both the targeted and the overall hypothesis in the scenarios with a predictive marker using this trial design. In the scenarios with a predictive marker (scenarios 2-4), with the exception of the scenario of total interaction (scenario 4), the power for the two hypotheses (with Bonferroni-adjusted α-levels) is comparable and only a modest increase of sample size (compared with the randomize-all design with just the overall hypothesis and α = 0.05) is needed to test both hypotheses. We note that in the context of a given real study, one can simulate from the large sample joint normal distribution of the two test statistics to less conservatively control for the overall type 1 error. For instance, if the overall hypothesis is fixed at α = 0.04, then by using this calculation, one could increase α for subgroup test to >0.01, yet still have an overall α = 0.05.
Fig. 6.
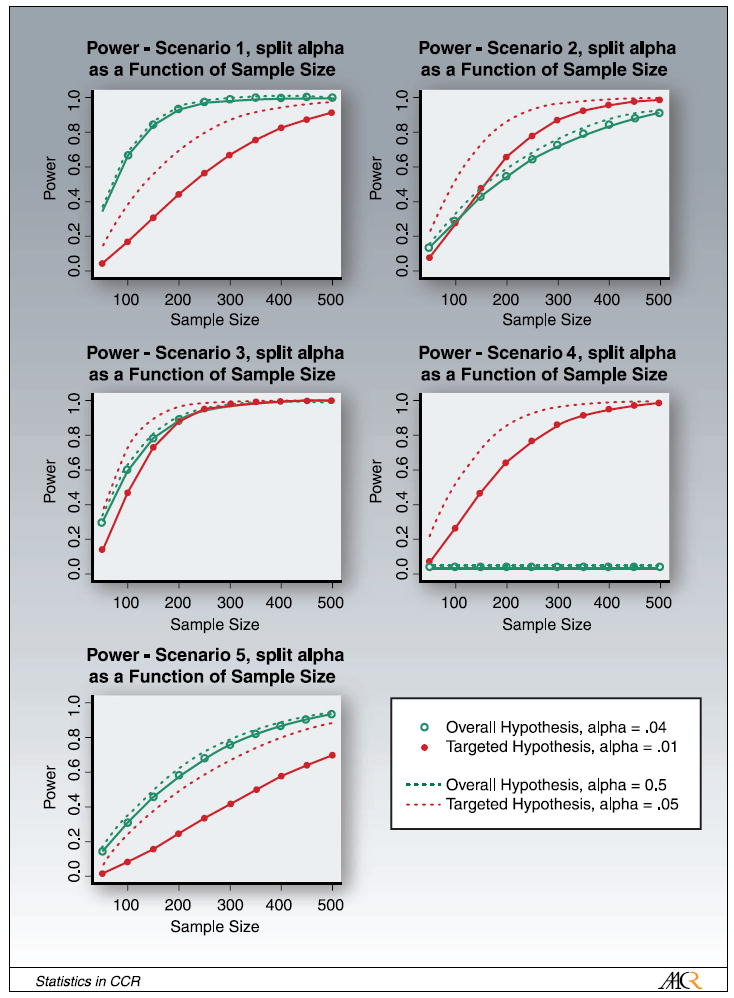
Power for testing the overall and the targeted hypothesis in the randomize-all design with α adjusted for multiple comparisons: α = 0.04 for the overall hypothesis and α = 0.01 for the targeted hypothesis (solid lines). For comparison, the dashed lines show the power for α = 0.05 for both hypotheses.
We also investigated the effect of the marker prevalence on the ratio of the number of patients randomized in the randomize-all design and the number of patients screened in the targeted design (the results are summarized in Fig. 7). The number of patients required for screening in the targeted design is given by the ratio of the number of randomized in the targeted design, divided by the fraction of M+ patients. If the fraction of M+ patients is equal to 1, the targeted and the randomize-all design are equivalent. For a small fraction of M+ patients, the mass of the marker distribution is centered at very low marker values. Scenarios 1 and 5 are similar. In case the marker is absent (scenario 1) and there is a constant difference in treatment efficacy independent of the marker value, this ratio increases linearly with the fraction of M+ patients. In scenario 5, this ratio increases too, but is not linear as the difference in response is not constant. Scenarios 2, 3, and 4, the scenarios with an underlying predictive marker are also similar. The ratio of the number of patients randomized in the randomize-all design and the number of patients screened in the targeted design gets larger with smaller M+ prevalence. If the marker prevalence is small in those scenarios, we have to screen more patients in the targeted design. This figure shows, however, that we have to randomize even more patients in the randomize-all design compared with the number of patients we have to screen in the targeted design, as the treatment effect gets diluted.
Fig. 7.
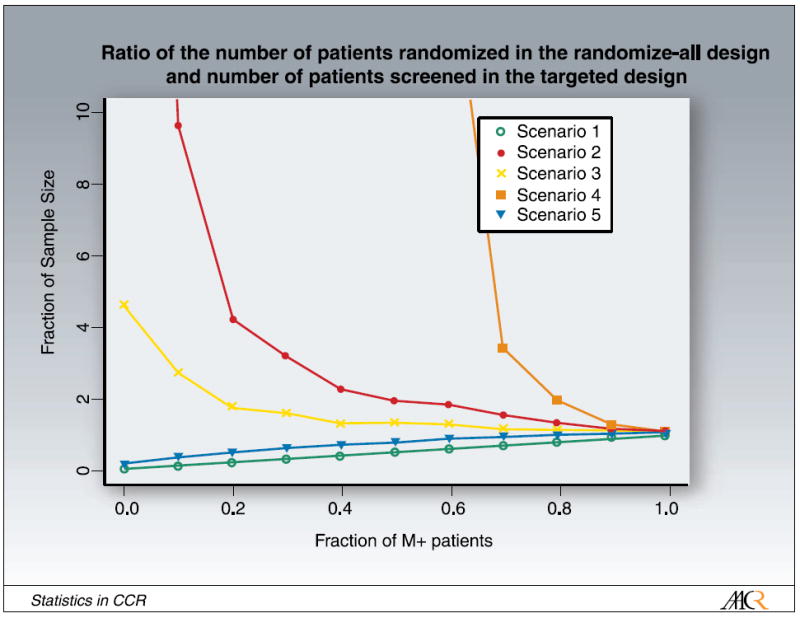
Ratio of the number of patients randomized in the randomize-all design and the number of patients screened in the targeted design as a function of marker prevalence.
Discussion
In this article, we evaluate three different trial designs commonly considered for situations when an underlying predictive marker is hypothesized. We consider the randomize-all design, the targeted design, and the strategy design. We also evaluate testing both the overall and the targeted hypothesis in the randomize-all design. Even if a promising marker is found in the laboratory, it is not clear that this marker is an actual predictive marker for the treatment of patients or that the new treatment under investigation only helps marker-positive patients. Here, we investigate five realistic scenarios, considering several different types of predictive markers, a prognostic marker, and no marker. Because many biological markers are continuous in nature, we assume an underlying continuous marker distribution rather than a discrete distribution, as has been used in the current literature. This is more realistic for most markers and thus allows for a more precise design and analysis of clinical trial data. It also allows us to determine the effect of a range of cutpoints on the performance of various designs. For a newly developed marker or assay, the cutpoint has often not been determined precisely. This formulation also allows us to take into account marker prevalence in the patient population by shifting the underlying marker distribution. Finally, although the results are stated for a single continuous marker, the same strategy holds for a linear combination potentially based on two or more biological markers. For instance, the continuous marker could be a linear combination of gene expression measurements.
The large effect on power we have observed due to differences in treatment efficacy as a function of marker values and fraction of selected marker-positive patients highlights the need for a thorough investigation of properties before committing to a specific design and initiating a phase III study with targeted agents. If the actual underlying scenario (marker response distribution) is known, it is easy to decide on the most appropriate trial design using our results. In reality, however, the true underlying marker response distribution is often unknown and we have to consider several possibilities. We suggest some general guidelines.
In general, the targeted design performs the best in all scenarios with an underlying true predictive marker. There is only one exception, which is in the case of a prognostic marker with constant odds ratios between treatment arms (scenario 5) when the targeted design has less power than the randomize-all design, but only for the extreme marker values when the cutpoint is shifted such that most patients are marker-negative. In addition, more patients still need to be assessed for their marker status compared with the randomize-all and the strategy designs. If the new treatment can also help marker-negative patients, there is also the question of whether the targeted design is appropriate. The strategy design tends to be inefficient in comparing the efficacy difference of two treatments as patients in different randomized arms are treated with the same therapy. The randomize-all design performs as well, or in most cases, better than the strategy design except for the hypothetical total interaction model on scenario 4, in which the overall treatment effect is null. We thus recommend using the randomize-all design over the strategy design except for cases in which the actual strategy hypothesis is of greater interest than the efficacy hypothesis.
We recommend using the targeted design if it is known with little uncertainty that the new treatment does not help all patients to some degree, if the marker prevalence (indicating patients helped by the new therapy) is small, and if the cutpoint of marker-positive and marker-negative patients is relatively well established. If the cutpoint is not yet well established, the power of the study can be severely compromised. Likewise, if only the most extreme marker values are classified as marker-positive, but if the treatment is more broadly effective, then some patients who are classified as marker-negative will not get randomized even though they would have benefited from the new treatment.
Scenario 3 is a very likely scenario. Here, the treatment works better for M+ subjects but also benefits M- subjects, for instance, to a lesser extent. Even if one pathway of action is well understood for M+ patients, there is always the possibility that the new agent works via a different pathway for the M- patient. This has recently been observed in the case of Her-2 overexpression in breast cancer, there is still the possibility that the new therapy under investigation works through other pathways not yet investigated (3). If there is the possibility that the new treatment helps marker-negative patients, that the cutpoint determining marker status has not yet been well established, and if the marker prevalence is large enough to make the study effective, we recommend using the randomize-all design with the power adjusted for multiple comparisons such that both the overall and the targeted hypothesis can be tested. Our results show that if there is an underlying predictive marker and if the cutpoint determining marker status is not too far off the correct cutpoint, the targeted hypothesis and the overall hypothesis (with split α level) achieve similar power as the overall hypothesis tested at α = 0.05 and thus both hypotheses can be tested with only a modest increase in sample size compared with testing the overall hypothesis alone in the randomize-all design (Fig. 6). In addition, we found that even in the case of extreme (large or small) marker prevalence, both the targeted and the overall hypotheses (with split α level) achieve comparable power as the overall hypothesis tested at α = 0.05, and again, both hypotheses can be tested with only a modest increase in sample size compared with testing the overall hypothesis only in the randomize-all design.
Acknowledgments
Grant support: NIH, grant CA090998.
Appendix A: Simulations and Model Parameters
We used the following underlying parameters. The log-transformed marker values X were simulated using X ~ N (μ = 0.5, σ2 = 0.52). The response distribution to the log-transformed marker values of the two treatments, j=1,2, for the five scenarios were simulated assuming a logit link with the following function:
where νM+(c) = ∫x>cf (x)dx is the fraction of marker-positive patients. The actual parameters used for the five scenarios are summarized in Table 1. In scenario 2, x transforms to x′ = (x-0.5)+.
Table 1.
Model parameters used in simulation studies
| Scenario | a01 | a11 | a02 | a12 |
|---|---|---|---|---|
| 1 | 0 | 0 | 1 | 0 |
| 2 | 0 | 0 | 0 | 4 |
| 3 | 0 | 0 | 0 | 2 |
| 4 | 0 | 0 | -2 | 4 |
| 5 | -3 | 4 | -2 | 4 |
Footnotes
Disclosure of Potential Conflicts of Interest No potential conflicts of interest were disclosed.
References
- 1.Shepherd FA, Pereira J, Ciuleanu TE, et al. Erlotinib in previously treated non-small-cell lung cancer. N Engl J Med. 2005;353:123–32. doi: 10.1056/NEJMoa050753. [DOI] [PubMed] [Google Scholar]
- 2.Hirsch FR, Varella-Garcia M, Bunn PA, et al. Epidermal growth factor receptor in non-small-cell lung carcinomas: correlation between gene copy number and protein expression and impact on prognosis. J Clin Oncol. 2003;21:3798–807. doi: 10.1200/JCO.2003.11.069. [DOI] [PubMed] [Google Scholar]
- 3.Menendez JA, Mehmi I, Lupu R. Trastuzumab in combination with heregulin-activated Her-2 (erbB-2) triggers a receptor-enhanced chemosensitivity effect in the absence of Her-2 overexpression. J Clin Oncol. 2006;24:3735–46. doi: 10.1200/JCO.2005.04.3489. [DOI] [PubMed] [Google Scholar]
- 4.Heinrich MC, Corless CL, Demetri GD, et al. Kinase mutations and imatinib response in patients with metastatic gastrointestinal stromal tumor. J Clin Oncol. 2003;21:4342–9. doi: 10.1200/JCO.2003.04.190. [DOI] [PubMed] [Google Scholar]
- 5.Hoering A, Crowley J. Clinical trial designs for multiple myeloma. Clin Adv Hematol. 2007;5:309–16. [PubMed] [Google Scholar]
- 6.Sargent DJ, Conley BA, Allegra C, Collette L. Clinical trial designs for predictive marker validation in cancer treatment trials. J Clin Oncol. 2005;9:2020–7. doi: 10.1200/JCO.2005.01.112. [DOI] [PubMed] [Google Scholar]
- 7.Jiang W, Freidlin B, Simon R. Biomarker-adaptive threshold design: a procedure for evaluating treatment with possible biomarker-defined subset effect. J Natl Cancer Inst. 2007;99:1036–43. doi: 10.1093/jnci/djm022. [DOI] [PubMed] [Google Scholar]
- 8.Simon R, Maitournam A. Evaluating the efficiency of targeted designs for randomized clinical trials. Clin Cancer Res. 2004;10:6759–63. doi: 10.1158/1078-0432.CCR-04-0496. [DOI] [PubMed] [Google Scholar]
- 9.Freidlin B, Simon R. Adaptive signature design: and adaptive clinical trial design for generating and prospectively testing a gene expression signature for sensitive patients. Clin Cancer Res. 2005;11:7872–8. doi: 10.1158/1078-0432.CCR-05-0605. [DOI] [PubMed] [Google Scholar]
- 10.Hayes DF, Trock B, Harris AL. Assessing the clinical impact of prognostic factors: when is statistically significant clinically useful? Breast Cancer Res Treat. 1998;52:305–19. doi: 10.1023/a:1006197805041. [DOI] [PubMed] [Google Scholar]
- 11.Sargent D, Allegra C. Issues in clinical trial design for tumor marker studies. Semin Oncol. 2002;29:222–30. doi: 10.1053/sonc.2002.32898. [DOI] [PubMed] [Google Scholar]
- 12.Cobo M, Isla D, Massuti B, et al. Customizing cisplatin based on quantitative excision repair cross-complementing 1mRNA expression: a phase III trial in non – small-cell lung cancer. J Clin Oncol. 2007;25:2747–54. doi: 10.1200/JCO.2006.09.7915. [DOI] [PubMed] [Google Scholar]