Abstract
Here, we have studied two parameters critical to process control in mammalian cell culture; dissolved oxygen (dO2) and pH, measured with fluorescent sensors thus allowing the study of the metabolic state of cells in culture without removing or damaging cells during cultivation. Two cell lines, namely, NS0 and CHO were batch-grown in 24-well plates at different serum concentrations with the sensors implemented in the bottom of each well. The data showed a good relationship between the dO2 and pH data obtained from fluorescent probes and the growth and death characteristics of cells. The method has provided a high throughput on-line multi-parametric analysis of mammalian cell cellular activity.
Keywords: Fluorescent sensor, pH, Dissolved oxygen, Cell culture, High throughput system
Introduction
Techniques for monitoring of cell proliferation and viability are crucial to the success of mammalian cell culture processes. Advances in optics and electronics have made optical sensors commercially available for the monitoring of such processes (Harms et al. 2002). Specifically, real-time monitoring is advantageous for assessing growth rate, the state of bioreactions, and to obtain early indications of catastrophic events such as contamination or cessation of growth. Many procedures have been previously suggested such as laser turbidity (Konstantinov et al. 1992), oxygen uptake rate (OUR), dielectric spectroscopy (Ducommun et al. 2001), NIR spectroscopy (Arnold et al. 2003), flow injection flow cytometry (Zhao et al. 1999), and optical microscopic imaging (Joeris et al. 2002).
Automated instruments have been successfully used for off line monitoring of cell growth and viability such as the Microcyte (Harding et al. 2000), Nucleocounter (Shah et al. 2006) and Guava PCA (Mukwena et al. 2003). All these methods, though useful to monitor individual operations, analysing one sample at each time are not easy to implement into a high throughput process involving hundreds of samples assayed frequently or continuously.
A monitoring strategy based on direct measurements of the two major operational parameters, dissolved oxygen and pH, which provides information on both growth and cellular metabolism, may circumvent the problem with low throughput monitoring. The rate of cellular growth and metabolism of protein synthesis are strongly dependent on medium dO2 and pH (Miller et al. 1988; Schmid et al. 1990; Ozturk and Palsson 1990). The direct measurements of these two parameters have also the advantages of continuous recording of metabolic changes in a drug discovery—or process development programmes where hundreds of experiments need to be carried out simultaneously to matrix all potential variables and to reach an optimized manufacturing process.
DO2 and pH levels are good indicators of cell growth. Oxygen is necessary for animal cell respiration and would decrease with increasing biomass while lactic acid is given off as a by-product of cell metabolism, lowering the pH of the media (Hanson et al. 2007). For cells in the growth phase of batch culture, we might expect a steady but rapid lowering of pH and oxygen levels reflecting the increase in total biomass and cellular metabolism. DO2 and pH levels may also provide information about the onset of apoptosis, since both inhibition of oxygen utilisation and acidification has shown an association with cell death in culture (Simpson et al. 1997; Perani et al. 1998).
In this work, we report the use of disposable non-invasive on-line optical detection probes for monitoring of pH and oxygen concentration in cell cultures. One of the most important advantages of optical-chemical probes is that they are non-interfering and non-destructive to cells. Optical-chemical sensing is also fast—the cell properties can be measured continuously during cell growth, and there is no delay between measurement and results. They also can be easily miniaturized with high precision and low cost (Ge et al. 2003; Harms et al. 2002). This allows measurement of the entire culture duration, batch or continuous, with no sampling required. It is unclear, however, whether measurement of oxygen and pH can accurately and reliably predict cell number and viability. As oxygen and pH sensors are an indirect method of measuring cell viability, the results will require interpretation, and are not as clear-cut as direct measurement. However, in a closed system it is expected that the increasing cell growth and biomass associated with increasing cellular metabolism would result in nutrient and oxygen depletion as well as in decrease in pH due to the release of ammonia and lactic acid.
Materials and methods
The SensorDish reader
The SensorDish reader (PreSens Precision Sensing GmbH, Regensburg, Germany) is a 24 well-plate device consisting of a sterile sensor plate (MTP plates), which is placed on top of the optical sensor dish reader attached to a laptop through a controller device recording the signals from the plates. At the bottom of each unit is the fluorescent metal complex, which is affected by the pH or dissolved oxygen levels in the well plate. The metal complex acts as the optode—an optical-chemical sensor which is immobilized in the middle of each well. This metal complex is activated by an LED acting as an excitation light source and a photodiode, which works as the light detector. It should also be noted that the pH and dO2 sensor plates are chemically different, and not interchangeable. Since the measurement is sensitive to light—all measurements are taken in the dark, inside the incubator.
Cultivation of CHO and NS0 in MTPs
Chinese hamster ovary (CHO) cells (ECCAC, Porton, UK) and mouse-myeloma derived NS0 6A1 cells (kindly provided by Lonza Biologics, UK) were maintained in DMEM/F12 supplemented with different serum (FBS) concentrations (5%, 2.5%, 1% and 0%). CHO culture was supplemented with 4 mM UltraGlutamine (l-Alanine-l-Glutamine dipeptide) (Lonza, UK). NS0 is a suspended cell line, which does not require chemical detachment from the well like the adherent CHO cell line. The cells were plated at a volume of 1.0 mL per well with an initial density of 2 × 10⁵ cells/mL in PreSens 24 well plates for separate oxygen and pH on-line readings. In parallel, two separate plates were set up for cell number and viability measurements. Daily samples were removed for cell count and viability from each well using the NucleoCounter (ChemoMetec A/S, Denmark). CHO cells were detached with Accutase™ (Sigma Aldrich, UK). All the plates were put in a 37 °C incubator, and a humid atmosphere was maintained by filling the base of the well plates with water. The pH and dO2 sensor dishes (HydroDish® and Oxodish®) were placed on the sensor dish reader in the incubator, and the logging software activated.
The sensor dish software provided a continuous visual display of current and past pH and dO2 data. The software was set to take readings of both dO2 and pH at 10 min intervals. The dO2 and pH readings did not require further intervention after the initial cell subculture for the total culture duration of 168 h.
Results and discussion
Batch cultures of CHO and NS0
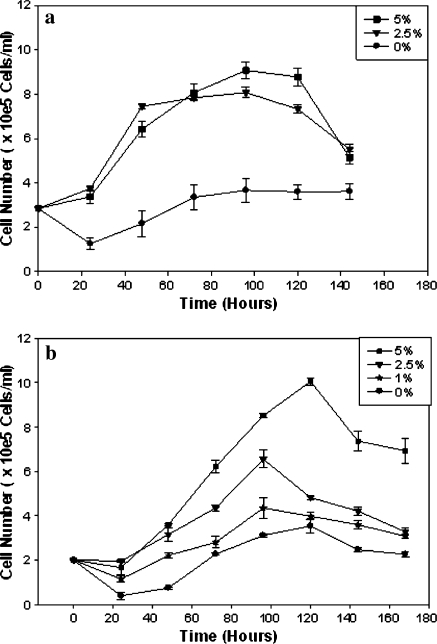
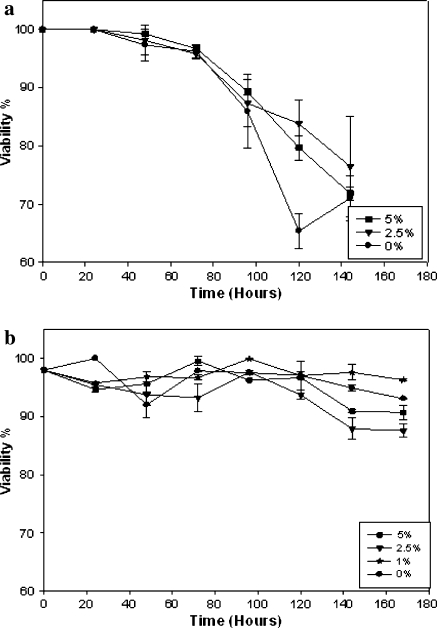
The growth curves of CHO and NS0 cells grown in the presence of different concentrations of FCS are presented in Fig. 1. Viable cell density and cell growth rates increased with increasing percentage of FCS, showing both stoichiometric and kinetic limitation by substrate in both cell lines. However, there was significant difference between the two cell lines in the percentage of viability. Whereas NS0 cells showed the typical viability curves of gradual decline with time, the viability of CHO cells remained largely unaffected during the cultivation period reflecting the intrinsic difference between the two cell lines in their culture longevity (Fig. 2).
Fig. 1.
Cell numbers in batch cultures of cell lines. (a) Different serum concentrations (5%, 2.5%, 1% and 0%) tested for NS0 cell cultures. (b) Different serum concentrations (5%, 2.5%, 1% and 0%) tested for CHO cell line
Fig. 2.
Viability in batch cultures of cell lines. (a) Different serum concentrations (5%, 2.5%, 1% and 0%) tested for NS0 cell cultures. (b) Different serum concentrations (5%, 2.5%, 1% and 0%) tested for CHO cell cultures
Oxygen data
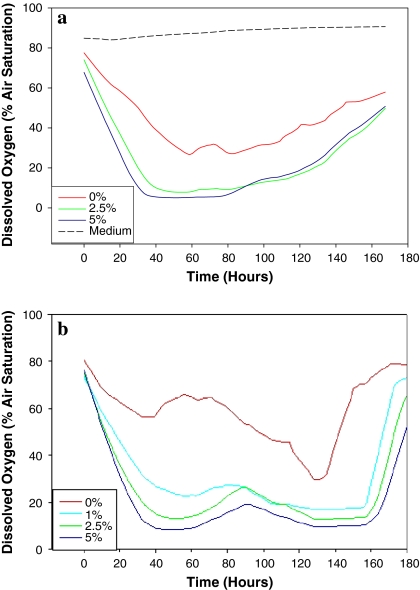
It was clear from the plot of the oxygen data that serum concentration had significant effect on the oxygen readings (Fig. 3). The measurement shows a FCS concentration dependent decrease of dO2 level during the first 2 days of cultivation. Thereafter, a steady small increase with time was noted in all three cultures indicating the slow down of growth rate and deterioration of physiological activity as well as the increasing rate of cell death. It was clear that the higher level and lower rate of dissolved oxygen in the 0% FCS culture were caused by the inability of the cells to grow and maintain normal oxygen requiring cellular activity. Interestingly, the changes in dO2 level showed two distinct kinetics; a rapid decrease during the first 2–3 days followed by a small but steady increase for the rest of culture duration. If we presume that the oxygen dissolving rate was constant during the culture duration then the result clearly showed that in addition to cell number the changing respiration rate was a significant factor affecting dO2 level.
Fig. 3.
Dissolved Oxygen readings using the Sensor Dish Reader. (a) NS0 cell line grown in batch culture of different serum concentrations (5%, 2.5%, 1% and 0%) tested for NS0 cell cultures. (b) CHO cell line grown in batch culture at different serum concentrations (5%, 2.5%, 1% and 0%)
The behaviour of CHO cells was slightly different to that of the NS0 cells. A slight rise was detected during the exponential growth phase of all cultures, this was rather small, and suggested a short period of inhibition of respiratory rate occurring before the cell number was peaked. This may be due to the semi-synchronised cell distribution in batch culture in that cells are mostly in G1 phase of the cell cycle, and that these cells have a lower O2 uptake rate in comparison to the S and G2 cells Leelavatcharamas et al. (1996).
It is worth noting that this temporary rise in dO2 level is not related to the steady continuous rise at the end of both CHO and NS0 cultures where the death rate was high and the transfer rate of oxygen from the gas phase into the media exceeded the cells consumption rate. As the cells died due to lack of nutrients, the dO2 level steadily climbed.
pH data
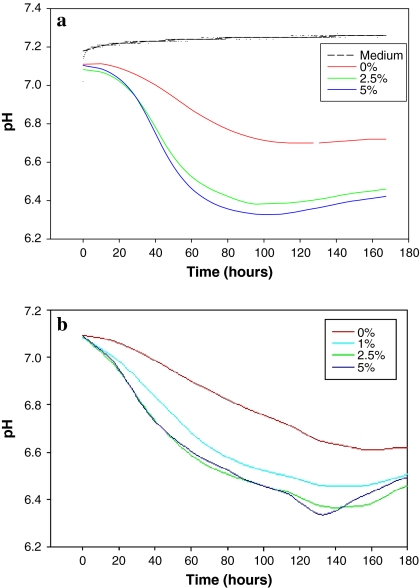
Generally the trend of changes in pH readings (Fig. 4) was similar to that of dO2. However, significant differences were noted. pH changes in the early stage of the culture (i.e. during the lag phase) were negligible, although the difference between FCS cultures was clear throughout the culture duration. This was followed by a rapid decline in pH until after 60 h of cultivation when no more changes could be observed. The difference between cultures with different serum concentrations was similar to that of dO2 and in agreement with the cell number plots of the batch cultures. It is interesting to note that the rate of acidification seems to correlate with growth in that at the point of maximum cell number (96 h) pH values dropped to 6.3, 6.4 and 6.75 for 5%, 2.5% and 0% FCS supplemented cultures, respectively. A similar trend but to a lesser extent was observed with the CHO cell cultures. At 96 h, the pH values were 6.48, 6.48, 6.57 and 6.75 for 5%, 2.5%, 1% and 0% FCS supplemented cultures, respectively. It is not clear as to why there was no difference in the acidification rate between the 5% and 2.5% cultures despite the observed differences in cell numbers. It may be that the pH values, and to some extent, the dO2 values, are reduced at relatively similar rates when cells are proliferating and such reduction is inhibited when growth is severely affected by the lack of essential nutrients and/or growth factors. Clearly cells with low growth rate would have a lower cell respiration and medium acidification rates. Although the trends were similar, the relative changes in dO2 and pH values did not coincide exactly with each other. The dO2 level was an earlier indicator of metabolism and growth rates. Whereas on average 50% reduction in dO2 level occurred in NS0 and CHO cultures within the first 24 h, the pH values dropped by only 3% (0.15 unit) within the same period.
Fig. 4.
pH readings using the Sensor Dish Reader. (a) NS0 cell line grown in batch culture of different serum concentrations (5%, 2.5%, 1% and 0%) tested for NS0 cell cultures. (b) CHO cell line grown in batch culture of different serum concentration (5%, 2.5%, 1% and 0%)
On examining the figures for significant trends, distinct patterns were noticed for the dissolved oxygen and pH levels, compared to the changing cell count. The oxygen data seems to divide into distinct phases, mirroring the growth phases of the cells themselves. The falling oxygen level at the beginning of the experiment indicates the cells are in the lag and early exponential phase—their respiratory machinery is activated in response to the ideal environment, and are consuming oxygen at high level in relation to the transfer rate of oxygen from the gas phase into the media. The cell growth phase, where the cells grow exponentially due to cell division, is marked by an equilibrium, where oxygen consumption is at the same rate as diffusion into the media. The exponential and stationary growth phases are marked by constant spikes in the oxygen readings, representing cells changing their metabolism in response to using up nutrients in the media. A clear steady increase in dO2 level marks the transition to the stationary and death phases in NS0 cultures, where cells start to die. However, such an increase in dO2 level did not happen in CHO cells until the cultures are well into the death phase.
Conclusion
A reliable high throughput on line monitoring technique contributes to the success of bioproduction processes and drug discovery programmes. The integrated, high throughput continuous monitoring of pH and dO2 by optical sensors can be considered as being reliable and feasible. Reliable monitoring, both in batch and during the feeding or manipulation of culture, complements and may replace the use of existing monitors. The rapid response of optical sensors to altering pH and oxygen levels, together with further threshold data, will allow rapid and accurate identification of the state of bioreactions. Multiparametric analysis can give quantitative data on specific target molecules that would allow for automated, kinetic reading and storing of quantitative phenotypic data directly into computer databases amenable to bioinformatics analysis. With this system it will be possible to fully automate a multiple cell analytical system and generate a good correlation with measurements obtained by a fully automated online image analytical system of cell number via light microscope.
Acknowledgment
This work is funded by a Science Foundation Ireland PI award.
References
- Arnold SA, Crowley J, Woods N, Harvey LM, McNeil B (2003) In-situ near infrared spectroscopy to monitor key analytes in mammalian cell cultivation. Biotechnol Bioeng 84:13–19. doi:10.1002/bit.10738 [DOI] [PubMed]
- Ducommun P, Kadouri A, Von Stockar U, Marison IW (2001) On-line determination of animal cell concentration in two industrial high-density culture processes by dielectric spectroscopy. Biotechnol Bioeng 77:316–323. doi:10.1002/bit.1197 [DOI] [PubMed]
- Ge X, Hanson M, Shen H, Kostov Y, Brorson KA, Frey DD et al (2003) Validation of an optical sensor-bases high-throughput bioreactor system for mammalian cell culture. J Biotechnol 122:293–306. doi:10.1016/j.jbiotec.2005.12.009 [DOI] [PubMed]
- Hanson MA, Ge X, Kostov Y, Brorson KA, Moreira AR, Rao G (2007) Comparisons of optical pH and dissolved oxygen sensors with traditional electrochemical probes during mammalian cell culture. Biotechnol Bioeng 9:833–841. doi:10.1002/bit.21320 [DOI] [PubMed]
- Harding CL, Lloyd DR, McFarlane CM, Al-Rubeai M (2000) Using the microcyte flow cytometer to monitor cell number, viability, and apoptosis in mammalian cell culture. Biotechnol Prog 16:800–802. doi:10.1021/bp0000813 [DOI] [PubMed]
- Harms P, Kostov Y, Rao G (2002) Bioprocess monitoring. Curr Opin Biotechnol 13:124–127. doi:10.1016/S0958-1669(02)00295-1 [DOI] [PubMed]
- Joeris K, Frerichs J-G, Konstantinov K, Scheper T (2002) In-situ microscopy: online process monitoring of mammalian cell cultures. Cytotechnology 38:129–134. doi:10.1023/A:1021170502775 [DOI] [PMC free article] [PubMed]
- Konstantinov KB, Pambayun R, Matanguihan R, Yoshida T, Perusich CM, Hu W-S (1992) On-line monitoring of hybridoma cell growth using a laser turbidity sensor. Biotechnol Bioeng 40:1337–1342. doi:10.1002/bit.260401107 [DOI] [PubMed]
- Leelavatcharamas V, Emery AN, Al-Rubeai M (1996) Monitoring the proliferative capacity of cultured animal cells by cell cycle analysis. In: Al-Rubeai M, Emery AN (eds) Flow cytometry applications in cell culture. Marcel Dekker Inc., New York, p 1
- Miller WM, Blanch HW, Wilke CR (1988) A kinetic analysis of hybridoma growth and metabolism in batch and continuous suspension culture: effect of nutrient concentration, dilution rate, and pH. Biotechnol Bioeng 32:947–965. doi:10.1002/bit.260320803 [DOI] [PubMed]
- Mukwena NT, Veraitch F, Al-Rubeai M, Goix P (2003) At-line monitoring of cell cultures: rapid cytometric evaluation of cellular physiology. Guava Technologies. Application note. http://www.gelifesciences.co.jp/technologies/cellular_science/pdf/at_line_monitor.pdf
- Perani A, Singh RP, Chauhan R, Al-Rubeai M (1998) Variable functions of bcl-2 in mediating bioreactor stress-induced apoptosis in hybridoma cells. Cytotechnology 28:177–188. doi:10.1023/A:1008002319400 [DOI] [PMC free article] [PubMed]
- Ozturk SS, Palsson BO (1990) Effects of dissolved oxygen on hybridoma cell growth, metabolism, and antibody production kinetics in continuous culture. Biotechnol Prog 6:437–446. doi:10.1021/bp00006a006 [DOI] [PubMed]
- Shah D, Naciri M, Clee P, Al-Rubeai M (2006) NucleoCounter—an efficient technique for the determination of cell number and viability in animal cell culture processes. Cytotechnology 51:39–44. doi:10.1007/s10616-006-9012-9 [DOI] [PMC free article] [PubMed]
- Schmid G, Blanch HW, Wilke CR (1990) Hybridoma growth, metabolism, and product formation in HEPES-buffered medium: II. Effect of pH. Biotechnol Lett 12:633–638. doi:10.1007/BF01088185 [DOI]
- Simpson NH, Milner AE, Al-Rubeai M (1997) Prevention of hybridoma cell death by bcl-2 during sub-optimal culture conditions. Biotechnol Bioeng 54:1–16. doi:10.1002/(SICI)1097-0290(19970405)54:1<1::AID-BIT1>3.0.CO;2-K [DOI] [PubMed]
- Zhao R, Natarajan A, Srienc F (1999) A flow injection flow cytometry system for on-line monitoring of bioreactors. Biotechnol Bioeng 62:609–617. doi:10.1002/(SICI)1097-0290(19990305)62:5<609::AID-BIT13>3.0.CO;2-C [DOI] [PubMed]


