

Abstract
Although cerebral amyloid deposition may precede cognitive impairment by decades, the relationship between amyloid deposition and longitudinal change in neuronal function has not been studied. The aim of this paper is to determine whether nondemented individuals with high and low amyloid burden show different patterns of longitudinal regional cerebral blood flow (rCBF) changes in the years preceding measurement of amyloid deposition.
Methods
Twenty-eight nondemented participants (mean (SD) age at [11C] PIB 82.5(4.8) yrs; 6 mildly impaired) from the Baltimore Longitudinal Study of Aging underwent yearly resting-state [15O]H2O PET scans for up to 8 years. [11C]PIB images of amyloid deposition were acquired on average 10.8(0.8) years after the first CBF scan. [11C]PIB distribution volume ratios (DVR) of regions of interest were estimated by fitting a reference tissue model to the measured time activity curves. Based on mean cortical DVR, participants were divided into high and low [11C]PIB retention groups. Differences in longitudinal rCBF changes between high and low [11C]PIB groups were investigated by voxel-based analysis.
Results
Longitudinal rCBF changes differed significantly between high (n=10) and low (n=18) [11C]PIB groups (p<=0.001). Greater longitudinal decreases in rCBF in the high [11C]PIB group were seen in right anterior/mid cingulate, right supramarginal gyrus, left thalamus and midbrain bilaterally relative to the low group. Greater increases in rCBF over time in the high [11C]PIB group were found in left medial and inferior frontal gyri, right precuneus, left inferior parietal lobule, and the left postcentral gyrus.
Conclusion
In this group of nondemented older adults, those with high [11C]PIB show greater longitudinal declines in rCBF in certain areas, representing regions with greater decrements in neuronal function. Greater longitudinal increases in rCBF are also observed in those with higher amyloid load and may represent an attempt to preserve neuronal function in these regions.
Keywords: PIB, CBF, Longitudinal, Positron Emission Tomography, Aging
Introduction
The development of in vivo amyloid imaging agents provides the opportunity to investigate prospective changes in amyloid deposition as a potential early marker of cognitive impairment and Alzheimer disease (AD) (1). Imaging studies have shown increased amyloid deposition in patients with AD and in some individuals with mild cognitive impairment (MCI), a condition thought to represent a transition between normal aging and AD (2). Studies of nondemented individuals focus on the ability of [11C]PIB and other amyloid imaging agents to discriminate individuals who will and will not progress to AD (1, 3-6). One challenge in the use of amyloid imaging in early identification of individuals at risk for cognitive impairment and AD is the fact that as many as 10-30% of individuals who are clinically normal on cognitive testing show amyloid deposition in imaging (3) and post-mortem studies (7, 8).
Evaluation of neuronal activity, using [15O]H2O, in conjunction with imaging of amyloid deposition might help clarify the significance of amyloid deposition in nondemented older adults. In view of Buckner et al.’s (9) suggestion that default brain activity in young adulthood may affect amyloid deposition later in life, in this study we evaluated changes in resting-state regional cerebral blood flow (rCBF) that occur during the decade before measurement of amyloid deposition in older nondemented individuals. Such examination is not only important for improved understanding of the longitudinal pathophysiological relationship between rCBF and amyloid deposition but also because of potential clinical implications, as joint analysis of rCBF and [11C]PIB data may provide more diagnostic information than a single method alone.
In this study, we investigated whether nondemented individuals with high and low amyloid deposition, measured by [11C]PIB PET evaluation, show different patterns of longitudinal change in regional cerebral blood flow (rCBF) in the years preceding the amyloid measurement. As β-amyloid is associated with decreased resting rCBF in animal models (10), we hypothesized that individuals with higher amyloid deposition detected by [11C] PIB would exhibit different patterns of longitudinal rCBF change than those individuals with lower amyloid deposition. We predicted that the longitudinal changes in rCBF in subjects with high [11C]PIB retention would involve regions that show decreases in rCBF in nondemented individuals who eventually progress to AD. These regions would include anterior and posterior cingulate, insula, middle and superior frontal and superior temporal regions as well as caudate nucleus and thalamus (11). In addition, we expected that at least some of the areas of change in longitudinal rCBF would spatially overlap with regions of known high [11C] PIB retention as vessel narrowing and subsequent hypoperfusion related to amyloid angiopathy may occur in some regions of [11C]PIB retention (12).
Materials and Methods
Study Participants
Data from 28 nondemented participants (6 with Clinical Dementia Rating (CDR)(13) Score = 0.5) from the neuroimaging substudy (14) of the Baltimore Longitudinal Study of Aging (BLSA) who underwent both CBF and [11C]PIB studies were included in the study. Based on the degree of amyloid deposition as determined by the mean cortical DVR described below, participants were divided into groups with high [11C]PIB retention and low [11C]PIB retention. Ten individuals (7 males and 3 females, mean (SD) age 81.96 (4.26) years at PIB study) comprised the high [11C]PIB retention group while 18 individuals (6 males and 12 females, mean (SD) age 82.82 (5.11) had low [11C]PIB retention. High and low [11C]PIB retention groups did not differ significantly with respect to age, sex, race, and education (Table 1). All participants underwent neuropsychological evaluation in conjunction with each neuroimaging visit. The CDR scale, typically informant-based, was administered in conjunction with the [11C]PIB imaging study and was previously administered in conjunction with rCBF studies when participants scored 3 or greater on the Blessed-Information-Memory-Concentration (15) test. Cognitive status was determined by consensus diagnosis according to established procedures (8, 16). A consensus diagnosis of MCI required progressive memory impairment without functional loss in activities of daily living (2). Informed consent was obtained from each participant before each study. Institutional IRB approval was obtained for the study.
TABLE 1.
Demographic and Clinical Characteristics.
| Entire group | High [11C]PIB retention group | Low [11C]PIB retention group | Differences Between High vs. Low PIB Groups | |
|---|---|---|---|---|
| Number of Participants | 28 | 10 | 18 | |
| CBF Studies/Participant | 8.5 ± 0.7 (7-9) | 8.5 ± 0.7 (7-9) | 8.5 ± 0.7 (7-9) | ns |
| Age at [11C]PIB study | 82.5 ± 4.77 | 81.96 ± 4.29 | 82.83 ± 5.11 | ns |
| Age range at [11C]PIB study | (75-92) | (77-90) | (75 - 92) | |
| Sex (M/F) | 19/9 | 7/3 | 6/12 | ns§ |
| Handedness (R/L) | 27/1 | 10/0 | 17/1 | ns§ |
| Race (White/African American) | 26/2 | 10/0 | 16/2 | ns§ |
| Education (years) | 17.2 ± 2.5 | 17 ± 2.6 | 17.3 ± 2.5 | ns |
| MMSE at the time of [11C] PIB study * | 28.4 ± 1.77 | 27.78 ± 2.17 | 28.96 ± 1.5 | ns |
| White matter disease burden† | 2.21 ± 1.37 | 1.7 ± 0.82 | 2.5 ± 1.54 | ns∥ |
| CDR status (# with CDR=0.5) at the time of [11C]PIB study | 6/28 | 5/10 | 1/18 | p=0.01§ |
| Diagosis of MCI at the time of [11C]PIB study | 1/28 | 1/10 | 0/18 | ns§ |
| Mean cortical DVR‡ | 1.26.±0.26 (1.00-1.80) | 1.57± 0.15 (1.37-1.80) | 1.09+0.10 (1.00-1.29) | p<0.001 |
Results expressed as mean ± SD (range). Unless otherwise noted, based on t-tests for independent samples.
Fisher’s exact test for independence
Exact Wilcoxon two-sample test
MMSE results from one individual (CDR=0) unavailable due to severe hearing impairment.
White matter ratings used the 10 point scale, ranging from 0 (normal) to 9 (thick rind of periventricular white matter disease together with marked subcortical disease), from the Cardiovascular Health Study (37, 38)
Mean cortical DVR across orbital frontal, prefrontal superior frontal, lateral temporal, occipital, parietal, anterior cingulate and posterior cingulate regions.
[11C]PIB: Pittsburgh Compound B; CBF: Cerebral Blood Flow; CDR: Clinical Dementia Rating Scale; MMSE: Mini-Mental Status Examination; MCI: mild cognitive impairment; DVR: distribution volume ratio; ns: nonsignificant
[15O] H2O Studies
[15O]H2O studies were performed annually for up to 9 assessments over an 8-year follow-up. During each imaging session, a resting PET scan was performed during which the participants were instructed to keep their eyes open and focused on a computer screen covered by a black cloth. Scans were acquired on a GE 4096+ scanner with 15 slices of axial resolution of 6.5 mm FWHM and 9 cm axial field of view (FOV). The superior-most portions of parietal cortex were not evaluated due to the limited axial FOV. Images were obtained for 60 seconds once the total radioactivity counts in brain reached threshold levels. A transmission scan in 2D mode utilizing a Ge-68 rotating source was used for attenuation correction. [15O] H2O PET studies were not adjusted for partial volume effects due to increased variance associated with correction of relatively lower resolution CBF images. A total of 238 CBF scans from 28 participants was available for analysis; 15 CBF scans were not available. The mean (SD) number of scans per participant was 8.5 (0.7; range 7-9). There were no significant differences between the proportions of unavailable studies for high and low [11C]PIB retention groups (χ2; p=1.0).
[11C] PIB Studies
Dynamic [11C]PIB PET studies were performed on average 10.8 (0.8SD) years after the first and 2.8 (0.8SD) years after the last CBF scan as part of the BLSA neuroimaging study. Studies were performed on a GE Advance scanner in 3D mode, and 37 time frames (90 min) were obtained at rest. The PET scanning started immediately after intravenous bolus injection of a mean (SD) 14.3 (1) mCi [11C] PIB with a mean(SD) specific activity of 4.13 (1.5; range 0.98 to 6.73) Ci/μmol. Participants were fitted with a thermoplastic mask for PET imaging to minimize motion during scanning. Transmission scans in 2D mode were used for attenuation correction of the emission scans. Dynamic images were reconstructed using filtered back projection with a ramp filter (image size 128×128, pixel size 2×2 mm, slice thickness 4.25 mm), yielding a spatial resolution of about 4.5mm FWHM at the center of field of view. We did not perform partial volume correction on the PIB images, but the partial volume effect was minimized by excluding edges of tissue in definition of volumes of interest. In view of the high noise level of voxel-based kinetics, the benefits of partial volume correction of PIB images remain uncertain (17).
MRI–Based Region of Interest Definition
Spoiled gradient recalled MRI scans (124 slices, image matrix 256×256, pixel size 0.93×0.93mm, slice thickness 1.5 mm) were coregistered to the mean of the first 20 min dynamic PET images for each participant using the mutual information method in the Statistical Parametric Mapping software (SPM2; Wellcome Department of Cognitive Neurology, London, England). In addition to cerebellum, which was used as a reference region, fifteen ROI’s (1:caudate; 2:putamen; 3: thalamus; 4: lateral temporal; 5:mesial temporal; 6:orbital frontal; 7:prefrontal; 8:occipital; 9: superior frontal; 10: parietal; 11:anterior cingulate; 12: posterior cingulate; 13:pons; 14: midbrain; 15: white matter) were manually drawn on the coregistered MRIs (18).
Quantification of Distribution Volume Ratios (DVRs) and Definition of High and Low [11C]PIB Retention Groups
The DVRs of regions of interest (ROIs) were estimated by simultaneous fitting of a reference tissue model to the 15 measured ROI time activity curves (19). In addition, DVR images were generated for voxel-wise analysis (17, 19). The mean cortical DVR was calculated by averaging DVR values from orbitofrontal, prefrontal, superior frontal, parietal, lateral temporal, occipital, and anterior and posterior cingulate regions. The mean cortical DVR was used to form groups rather than used as a continuous variable due to the possibility that associations with rCBF change would not be uniform across the range of cortical DVR values, e.g. no relationships may be evident in individuals with low PIB values. To separate individuals into two groups, we employed 2 group K-mean cluster analysis in SAS 9.1 (SAS Institute, Inc. Cary, NC).
SPM Analysis of CBF Scans
Using SPM2, PET CBF scans were realigned, spatially normalized into standard stereotactic space and smoothed using a Gaussian filter of 12, 12, and 12 mm in the x, y, and z planes, respectively. To control for variability in global flow, rCBF values at each voxel were ratio-adjusted to the mean global flow of 50 ml/100g/min for each image. The image data were analyzed using voxel-by-voxel comparisons to assess differences in linear rCBF changes between the high and low [11C]PIB groups over time across all data points. Group × time interactions of linear changes in rCBF were computed, covarying for sex and the time between the last rCBF study and [11C]PIB study. Significant effects for each contrast were based on the magnitude (p≤0.001) and spatial extent (>200 mm3) of differences between groups.
Spatial Distribution of Differences in rCBF and [11C]PIB for High versus Low [11C]PIB Groups
Using SPM2, [11C] PIB parametric DVR images were spatially normalized and smoothed using a Gaussian filter of 8, 8, and 8 mm in the x, y, and z planes. A two-group t-test was used to assess differences between the high and low PIB retention groups. Significant effects were based on magnitude (p<=0.001) and spatial extent (>200 mm3). For graphical illustration, significant differences in longitudinal rCBF change between the high and low [11C]PIB retention groups were superimposed on t–maps of differences in amyloid deposition between the high and low PIB groups using the Amide software v.3 (20). To determine whether regions showing significant group differences in rCBF change overlap with those showing differences in amyloid deposition, a restricted search analysis was performed limited to regions showing significant group differences in rCBF (mask threshold p=0.05).
Results
Study Participants
High and low PIB retention groups were similar with respect to age and other demographic characteristics and did not differ significantly in white matter signal abnormalities on MRI. Compared to the low [11C]PIB retention group, the high [11C]PIB group showed a non-significant trend for lower scores on the Mini-Mental Status Exam (MMSE). In addition, mean CDR scores were higher in the high compared to low [11C]PIB retention group (Table1). At the time of the [11C] PIB study, the high [11C] PIB retention group included only one individual (CDR= 0.5) who met consensus criteria for MCI. The remainder of the high [11C] PIB group included four individuals with CDR=0.5 who did not yet meet consensus criteria for MCI and five individuals with CDR=0. Four of the five CDR = 0.5 individuals received their initial CDR=0.5 during imaging visits prior to the [11C] PIB PET study but none of the 4 progressed to CDR > 0.5 during follow-up. During the 8 years of CBF imaging, none of the participants in either group developed central nervous system disease (stroke, epilepsy, brain tumor, Parkinson’s disease or severe cardiac disease [myocardial infarction, coronary artery disease requiring angioplasty or bypass surgery]).
Cluster Analysis of the Mean Cortical DVR
To separate individuals into two groups, we employed 2 group K-mean cluster analysis and used a cubic clustering criterion (CCC) to test for uniformity within the data. This analysis identified two clusters separated at approximately 1.3 DVR, characterized by CCC of 0.547 which indicates that they represent potential clusters (Figure 1). Based on the cluster analysis, 10 participants were assigned to the high [11C]PIB retention group while 18 participants were assigned to the low [11C]PIB retention group. Significantly more participants in the high [11C]PIB retention group had CDR=0.5 at the time of the [11C]PIB study as compared to the low [11C]PIB retention group (p=0.0126) (Table 1). Only one participant in the low [11C]PIB retention group had a CDR score of 0.5 with CDR sum of the boxes of 0.5. Individuals in the high [11C]PIB retention group with CDR = 0.5 had very mild cognitive impairment (mean CDR sum of boxes = 1.5 (0.5), maximum sum of boxes = 2).
FIGURE 1.
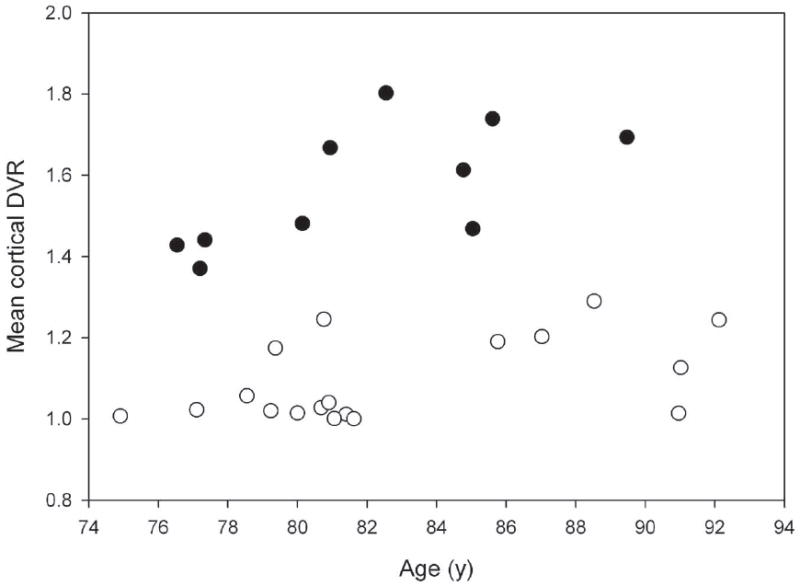
Scatterplot of the association between age and mean cortical DVR. Using 2 group K-mean cluster analysis, two clusters of individuals were identified -- one with higher [11C]PIB retention and another with lower [11C]PIB retention -- as determined by mean cortical DVR.
Longitudinal Changes in High and Low [11C]PIB Retention Groups
Longitudinal increases and decreases in rCBF differed significantly between high and low [11C]PIB retention groups (p ≤ 0.001, >200 mm3 spatial extent). Greater increases over time in rCBF in the high relative to low [11C]PIB group were seen in the left medial frontal (BA 10) and left inferior frontal gyri (BA 45/46), right precuneus (BA 7), left inferior parietal lobule (BA 40), and left postcentral gyrus (BA 43). Greater decreases in rCBF over time in the high [11C]PIB group as compared to low [11C]PIB group were found in right anterior/mid cingulate (BA 32/24), right supramarginal gyrus (BA 40), left thalamus and midbrain bilaterally (Table 2).
TABLE 2.
Differences in Longitudinal rCBF Changes in the High [11C]PIB Retention Group Relative to the Low [11C]PIB Retention Group.
| Region (Brodmann Area) | Coordinates | |||||
|---|---|---|---|---|---|---|
| Side | x | y | z | T-value | p-value (uncorr) | |
| HIGH vs. LOW [11C]PIB GROUPS: | ||||||
| Greater Linear Increases in rCBF | ||||||
| Precuneus (7) | R | 6 | -48 | 44 | 3.55 | <0.001 |
| Inferior parietal lobule (40) | L | -58 | -22 | 28 | 3.25 | 0.001 |
| Postcentral gyrus (43) | L | -46 | -12 | 22 | 3.58 | <0.001 |
| Medial frontal gyrus (10) | L | -8 | 50 | 14 | 3.60 | <0.001 |
| Inferior frontal gyrus (45/46) | L | -32 | 28 | 12 | 4.41 | <0.001 |
| Greater Linear Decreases in rCBF | ||||||
| Cingulate gyrus (32/24) | R | 16 | 22 | 28 | 4.51 | <0.001 |
| Supramarginal gyrus (40) | R | 48 | -52 | 34 | 3.01 | 0.001 |
| Thalamus | L | -2 | -14 | 14 | 3.74 | <0.001 |
| Midbrain | R | 4 | -24 | -8 | 3.18 | 0.001 |
| Midbrain | L | -6 | -18 | -2 | 3.12 | 0.001 |
[11C]PIB: Pittsburgh Compound B; rCBF: Regional Cerebral Blood Flow
Voxel-based differences in amyloid deposition between the high and low [11C]PIB retention groups are shown in Figure 2 in the lower row. The pattern of voxel-based differences in [11C]PIB retention between the groups is very similar to a map of [11C]PIB retention in a typical AD case. Superimposed on the voxel-based differences in [11C]PIB retention between the groups are regions of significant differences in longitudinal rCBF change between the groups. As confirmed by restricted search analysis, all regions, except brainstem and inferior thalamus, that show significant differences in longitudinal rCBF change between high and low [11C]PIB groups overlap with regions of greater amyloid retention in the high [11C] PIB group.
FIGURE 2.
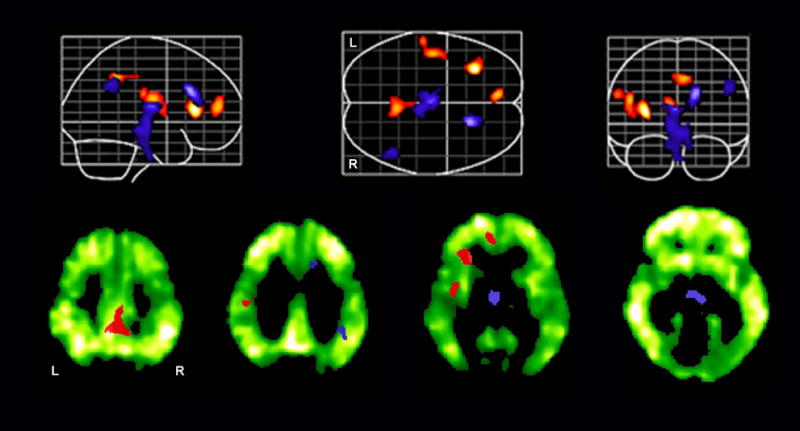
Longitudinal rCBF increases (red) and decreases (blue) over an 8 year interval in the group with high amyloid deposition as compared to the group with low amyloid deposition. In the lower row, differences in longitudinal rCBF changes are overlaid on selected axial images showing voxel-based differences in amyloid deposition between the high and low [11C]PIB groups.
Discussion
This evaluation of nondemented older adults demonstrates regionally specific differences in longitudinal rCBF changes over time between individuals with and without amyloid deposition. In the years preceding measurement of amyloid deposition, both greater increases and greater decreases over time are observed in specific brain regions when nondemented individuals with high cortical [11C]PIB retention are compared with those with low [11C]PIB retention. The spatial distribution of rCBF changes in the high PIB group occurs primarily in areas with known amyloid deposition; however, not all areas that have been documented previously to have high PIB retention show longitudinal rCBF changes. Differences in longitudinal rCBF change between the high and low [11C]PIB retention groups are seen in some structures that have altered rCBF in individuals with MCI who progress to AD (11, 21). Unlike these cross-sectional imaging studies, the high [11C]PIB retention group in our study is composed of a mix of normal elderly and individuals with CDR=0.5, of whom only one has a consensus diagnosis of MCI. These differences in sample characteristics may account for differences between our findings and those of studies of individuals with MCI who progress to AD.
Greater declines in rCBF over time in the high [11C]PIB retention group were found in the anterior cingulate gyrus extending to the right middle cingulate gyrus, the supramarginal gyrus, thalamus and midbrain relative to the low group. Decreased rCBF has been previously reported in anterior cingulate gyrus on SPECT imaging of individuals who converted to AD (22), and deficits in executive function, in which the anterior cingulate has been reported to play a role, are among those exhibited early in the course of AD (23). In addition to the greater longitudinal decrease in the anterior cingulate for the high [11C]PIB retention group, we also observed greater decreases over time for the high [11C]PIB group in supramarginal gyrus and thalamus. CBF decreases in the supramarginal gyrus have been observed previously in cross-sectional studies comparing individuals with AD to controls (24, 25) and in longitudinal follow–up of AD individuals (25). SPECT studies have also shown early involvement of the thalamus in AD (22). We also found greater longitudinal declines in midbrain rCBF in the high [11C]PIB group, indicating greater decreases in neural activity in this region. Interestingly, we did not observe significant group differences in longitudinal rCBF changes for the posterior cingulate gyrus, an area showing early decreases in rCBF (22, 25) and glucose metabolism (26) as well as increased amyloid deposition (27, 28) in individuals diagnosed with MCI and AD.
Greater decreases in longitudinal rCBF in those with high amyloid deposition may represent the inability to further offset neuronal insult or neuronal death, a process which is also associated with decreased FDG activity in areas with high [11C]PIB deposition (1, 28, 29). In addition to focal decreases in neural activity, several other mechanisms either alone or in combination may explain decreases in CBF. These include compromise of the lumina of small vessels due to amyloid deposition itself and/or vasoconstrictive properties of endothelin-1, a molecule formed during interaction of Aβ with the receptor for advanced glycation end products (RAGE) (30); decreased synaptic integration (31); decreased choline acetyltransferase activity as an individual progresses toward AD (32); degeneration of indirect projections from the basal forebrain to cerebral microcirculation (33), and cell death due to amyloid toxicity (34).
In addition to greater longitudinal decreases in rCBF in some regions, we also found some regions that showed greater longitudinal increases in rCBF in those with higher amyloid load as compared to those with low amyloid load. These regions included inferior and medial frontal, postcentral and inferior parietal lobule regions, and the precuneus. All these regions with greater longitudinal rCBF increases also show greater amyloid deposition in the high [11C]PIB retention group in a voxel-based analysis. In one [11C]PIB PET study of nondemented individuals, the precuneus was reported to be the first region showing significant amyloid deposition (3). In addition to precuneus and posterior cingulate, the frontal regions have also shown pronounced PIB retention in prior studies (1, 4-6, 27, 28). Notably, these neocortical regions also demonstrate early amyloid deposition in pathological studies (7, 8).
While decline in neuronal function has been extensively documented especially once an individual has been diagnosed with AD; accumulating evidence indicates potential increases in regional brain activity in the very early stages of cognitive impairment. Relative increases in rCBF have been found in frontal regions in individuals who later progress to dementia compared to normal controls and individuals with MCI who remain stable(21). Functional MRI studies of individuals with mild cognitive impairment also indicate that initial increases in neuronal function early in the disease process (35). Moreover, neuropathological studies of cognitively intact individuals whose postmortem findings are consistent with AD show hypertrophy of neuronal nuclei, nucleoli, and cell bodies in several brain regions as compared to controls (36). These changes, which may be a marker of the brain’s resistance to the effects of amyloid deposition, would likely be associated with increased rCBF in view of increased metabolic demands. Although the concurrent relationship between rCBF and amyloid deposition has not yet been reported, our findings of greater longitudinal increase in rCBF in some brain regions of individuals with increased amyloid load is consistent with these other observations of increased neuronal activity in individuals with no or early mild cognitive impairment.
While the specific mechanisms related to these longitudinal changes in rCBF remain unclear, either amyloid deposition itself or one of the pathophysiological processes associated with amyloid deposition may play a role in the observed changes. One possible explanation for the pattern of greater longitudinal increases and decreases in rCBF in association with amyloid deposition may be that greater decreases in rCBF across time represent a response to neuronal insult which subsequently leads to neuronal death whereas greater longitudinal increases in rCBF represent an attempt to preserve neuronal function despite an increase in amyloid load. These increases in rCBF, possibly representing neuronal plasticity changes, may play a role in the maintenance of cognitive function until such processes are overcome by increasing pathophysiology.
CONCLUSIONS
We demonstrate that the pattern of longitudinal rCBF changes in those with high [11C]PIB retention differs from those with low [11C]PIB retention. In this group of nondemented older adults, those with high [11C]PIB deposition show a decline in rCBF over the previous years, probably reflecting decrements in neuronal function. However, in the same group, there is also a greater increase in rCBF over time seen in other areas, suggesting that compensatory mechanisms aimed at preserving brain function are invoked in the setting of amyloid deposition. The spatial distribution of these changes corresponds to regions typically showing high amyloid deposition; however, not all areas of known amyloid deposition show changes in rCBF. Concurrent evaluation of longitudinal changes in rCBF and amyloid deposition in relation to changes in cognitive status will be required to investigate in detail the interplay between CBF and amyloid deposition and their possible clinical implications. Further development, refinement and application of different physiologic and molecular probes, in concert with longitudinal and perhaps more focused and refined clinical observations, will bring us closer to understanding the pathophysiology of MCI/AD and may aid in determining which individuals at risk for AD are most likely to progress to disease.
Acknowledgments
We thank the staff of the PET facility at Johns Hopkins University and the neuroimaging staff of the NIA for their assistance. This research was supported by the Intramural Research Program of the NIH, National Institute on Aging as well as N01-AG-3-2124 and K24 DA00412 (DFW).
Funding: This research was supported by the Intramural Research Program of the National Institutes of Health, National Institute on Aging and the National Institutes of Health (N01-AG-3-2124 and K24 DA00412 to DFW).
Footnotes
Disclosure Statement: GE Healthcare holds a license agreement with the University of Pittsburgh based on the PIB technology described in this manuscript. Drs. Klunk and Mathis are co-inventors of PIB and, as such, have a financial interest in this license agreement. All other authors confirm that there are no conflicts of interest with regard to this work.
References
- 1.Klunk WE, Engler H, Nordberg A, et al. Imaging brain amyloid in Alzheimer’s disease with Pittsburgh Compound-B. Ann Neurol. 2004 Mar;55(3):306–319. doi: 10.1002/ana.20009. [DOI] [PubMed] [Google Scholar]
- 2.Petersen RC, Morris JC. Mild cognitive impairment as a clinical entity and treatment target. Arch Neurology. 2005 Jul;62(7):1160–1163. doi: 10.1001/archneur.62.7.1160. discussion 1167. [DOI] [PubMed] [Google Scholar]
- 3.Mintun MA, Larossa GN, Sheline YI, et al. [11C]PIB in a nondemented population: potential antecedent marker of Alzheimer disease. Neurology. 2006 Aug 8;67(3):446–452. doi: 10.1212/01.wnl.0000228230.26044.a4. [DOI] [PubMed] [Google Scholar]
- 4.Rowe CC, Ng S, Ackermann U, et al. Imaging {beta}-amyloid burden in aging and dementia. 2007;68:1718–1725. doi: 10.1212/01.wnl.0000261919.22630.ea. [DOI] [PubMed] [Google Scholar]
- 5.Kemppainen NM, Aalto S, Wilson IA, et al. PET amyloid ligand [11C]PIB uptake is increased in mild cognitive impairment. Neurology. 2007 May 8;68(19):1603–1606. doi: 10.1212/01.wnl.0000260969.94695.56. [DOI] [PubMed] [Google Scholar]
- 6.Forsberg A, Engler H, Almkvist O, et al. PET imaging of amyloid deposition in patients with mild cognitive impairment. Neurobiol Aging. 2007 May 10; doi: 10.1016/j.neurobiolaging.2007.03.029. [DOI] [PubMed] [Google Scholar]
- 7.Galvin JE, Powlishta KK, Wilkins K, et al. Predictors of preclinical Alzheimer disease and dementia: a clinicopathologic study. Arch Neurology. 2005 May;62(5):758–765. doi: 10.1001/archneur.62.5.758. [DOI] [PubMed] [Google Scholar]
- 8.Driscoll I, Resnick SM, Troncoso JC, An Y, O’Brien R, Zonderman AB. Impact of Alzheimer’s pathology on cognitive trajectories in nondemented elderly. Ann Neurol. 2006 Dec;60(6):688–695. doi: 10.1002/ana.21031. [DOI] [PubMed] [Google Scholar]
- 9.Buckner RL, Snyder AZ, Shannon BJ, et al. Molecular, structural, and functional characterization of Alzheimer’s disease: evidence for a relationship between default activity, amyloid, and memory. J Neurosci. 2005 Aug 24;25(34):7709–7717. doi: 10.1523/JNEUROSCI.2177-05.2005. [DOI] [PMC free article] [PubMed] [Google Scholar]
- 10.Niwa K, Carlson GA, Iadecola C. Exogenous A beta1-40 reproduces cerebrovascular alterations resulting from amyloid precursor protein overexpression in mice. J Cereb Blood Flow Metab. 2000 Dec;20(12):1659–1668. doi: 10.1097/00004647-200012000-00005. [DOI] [PubMed] [Google Scholar]
- 11.Johnson KA, Moran EK, Becker JA, Blacker D, Fischman AJ, Albert MS. Single photon emission computed tomography perfusion differences in mild cognitive impairment. Journal Neurol Neurosurg Psychiatry. 2007 Mar;78(3):240–247. doi: 10.1136/jnnp.2006.096800. [DOI] [PMC free article] [PubMed] [Google Scholar]
- 12.Bacskai BJ, Frosch MP, Freeman SH, et al. Molecular imaging with pittsburgh compound B confirmed at autopsy: a case report. Arch Neurol. 2007 Mar;64(3):431–434. doi: 10.1001/archneur.64.3.431. [DOI] [PubMed] [Google Scholar]
- 13.Morris JC. The Clinical Dementia Rating (CDR): current version and scoring rules. Neurology. 1993 Nov;43(11):2412–2414. doi: 10.1212/wnl.43.11.2412-a. [DOI] [PubMed] [Google Scholar]
- 14.Resnick SM, Goldszal AF, Davatzikos C, et al. One-year age changes in MRI brain volumes in older adults. Cereb Cortex. 2000 May;10(5):464–472. doi: 10.1093/cercor/10.5.464. [DOI] [PubMed] [Google Scholar]
- 15.Blessed G, Tomlinson BE, Roth M. The association between quantitative measures of dementia and of senile change in the cerebral grey matter of elderly subjects. Br J Psychiatry. 1968 Jul;114(512):797–811. doi: 10.1192/bjp.114.512.797. [DOI] [PubMed] [Google Scholar]
- 16.Kawas C, Gray S, Brookmeyer R, Fozard J, Zonderman A. Age-specific incidence rates of Alzheimer’s disease: the Baltimore Longitudinal Study of Aging. Neurology. 2000 Jun 13;54(11):2072–2077. doi: 10.1212/wnl.54.11.2072. [DOI] [PubMed] [Google Scholar]
- 17.Zhou Y, Endres CJ, Brasic JR, Huang SC, Wong DF. Linear regression with spatial constraint to generate parametric images of ligand-receptor dynamic PET studies with a simplified reference tissue model. Neuroimage. 2003 Apr;18(4):975–989. doi: 10.1016/s1053-8119(03)00017-x. [DOI] [PubMed] [Google Scholar]
- 18.Price JC, Klunk WE, Lopresti BJ, et al. Kinetic modeling of amyloid binding in humans using PET imaging and Pittsburgh Compound-B. J Cereb Blood Flow Metab. 2005 Nov;25(11):1528–1547. doi: 10.1038/sj.jcbfm.9600146. [DOI] [PubMed] [Google Scholar]
- 19.Zhou Y, Resnick SM, Ye W, et al. Using a reference tissue model with spatial constraint to quantify [(11)C]Pittsburgh compound B PET for early diagnosis of Alzheimer’s disease. Neuroimage. 2007 Jun;36(2):298–312. doi: 10.1016/j.neuroimage.2007.03.004. [DOI] [PMC free article] [PubMed] [Google Scholar]
- 20.Loening AM, Gambhir SS. AMIDE: a free software tool for multimodality medical image analysis. Mol Imaging. 2003 Jul;2(3):131–137. doi: 10.1162/15353500200303133. [DOI] [PubMed] [Google Scholar]
- 21.Huang C, Wahlund LO, Almkvist O, et al. Voxel- and VOI-based analysis of SPECT CBF in relation to clinical and psychological heterogeneity of mild cognitive impairment. Neuroimage. 2003 Jul;19(3):1137–1144. doi: 10.1016/s1053-8119(03)00168-x. [DOI] [PubMed] [Google Scholar]
- 22.Johnson KA, Jones K, Holman BL, et al. Preclinical prediction of Alzheimer’s disease using SPECT. Neurology. 1998 Jun;50(6):1563–1571. doi: 10.1212/wnl.50.6.1563. [DOI] [PubMed] [Google Scholar]
- 23.Perry RJ, Hodges JR. Attention and executive deficits in Alzheimer’s disease. A critical review. Brain. 1999 Mar;122(Pt 3):383–404. doi: 10.1093/brain/122.3.383. [DOI] [PubMed] [Google Scholar]
- 24.Scarmeas N, Habeck CG, Zarahn E, et al. Covariance PET patterns in early Alzheimer’s disease and subjects with cognitive impairment but no dementia: utility in group discrimination and correlations with functional performance. Neuroimage. 2004 Sep;23(1):35–45. doi: 10.1016/j.neuroimage.2004.04.032. [DOI] [PMC free article] [PubMed] [Google Scholar]
- 25.Kogure D, Matsuda H, Ohnishi T, et al. Longitudinal evaluation of early Alzheimer’s disease using brain perfusion SPECT. J Nucl Med. 2000 Jul;41(7):1155–1162. [PubMed] [Google Scholar]
- 26.Minoshima S, Giordani B, Berent S, Frey KA, Foster NL, Kuhl DE. Metabolic reduction in the posterior cingulate cortex in very early Alzheimer’s disease. Ann Neurol. 1997 Jul;42(1):85–94. doi: 10.1002/ana.410420114. [DOI] [PubMed] [Google Scholar]
- 27.Kemppainen NM, Aalto S, Wilson IA, et al. Voxel-based analysis of PET amyloid ligand [11C]PIB uptake in Alzheimer disease. Neurology. 2006 Nov 14;67(9):1575–1580. doi: 10.1212/01.wnl.0000240117.55680.0a. [DOI] [PubMed] [Google Scholar]
- 28.Edison P, Archer HA, Hinz R, et al. Amyloid, hypometabolism, and cognition in Alzheimer disease: an [11C]PIB and [18F]FDG PET study. Neurology. 2007 Feb 13;68(7):501–508. doi: 10.1212/01.wnl.0000244749.20056.d4. [DOI] [PubMed] [Google Scholar]
- 29.Engler H, Forsberg A, Almkvist O, et al. Two-year follow-up of amyloid deposition in patients with Alzheimer’s disease. Brain. 2006 Jul 19; doi: 10.1093/brain/awl178. [DOI] [PubMed] [Google Scholar]
- 30.Deane R, Du Yan S, Submamaryan RK, et al. RAGE mediates amyloid-beta peptide transport across the blood-brain barrier and accumulation in brain. Nat Med. 2003 Jul;9(7):907–913. doi: 10.1038/nm890. [DOI] [PubMed] [Google Scholar]
- 31.Stern EA, Bacskai BJ, Hickey GA, Attenello FJ, Lombardo JA, Hyman BT. Cortical synaptic integration in vivo is disrupted by amyloid-beta plaques. J Neurosci. 2004 May 12;24(19):4535–4540. doi: 10.1523/JNEUROSCI.0462-04.2004. [DOI] [PMC free article] [PubMed] [Google Scholar]
- 32.DeKosky ST, Ikonomovic MD, Styren SD, et al. Upregulation of choline acetyltransferase activity in hippocampus and frontal cortex of elderly subjects with mild cognitive impairment. Ann Neurol. 2002 Feb;51(2):145–155. doi: 10.1002/ana.10069. [DOI] [PubMed] [Google Scholar]
- 33.Tong XK, Hamel E. Regional cholinergic denervation of cortical microvessels and nitric oxide synthase-containing neurons in Alzheimer’s disease. Neuroscience. 1999;92(1):163–175. doi: 10.1016/s0306-4522(98)00750-7. [DOI] [PubMed] [Google Scholar]
- 34.Nakamura S, Murayama N, Noshita T, Annoura H, Ohno T. Progressive brain dysfunction following intracerebroventricular infusion of beta(1-42)-amyloid peptide. Brain Res. 2001 Sep 7;912(2):128–136. doi: 10.1016/s0006-8993(01)02704-4. [DOI] [PubMed] [Google Scholar]
- 35.Dickerson BC, Sperling RA. Functional abnormalities of the medial temporal lobe memory system in mild cognitive impairment and Alzheimer’s disease: Insights from functional MRI studies. Neuropsychologia. 2007 Dec 8; doi: 10.1016/j.neuropsychologia.2007.11.030. [DOI] [PMC free article] [PubMed] [Google Scholar]
- 36.Iacono D, O’Brien R, Resnick SM, Zonderman AB, Pletnikova O, Rudow G, An Y, West MJ, Crain B, Troncoso JC. Neuronal Hypertrophy in Asymptomatic Alzheimer’s Disease. Journal Neuropathol Exp Neurol. doi: 10.1097/NEN.0b013e3181772794. In Press. [DOI] [PMC free article] [PubMed] [Google Scholar]
- 37.Manolio TA, Kronmal RA, Burke GL, et al. Magnetic resonance abnormalities and cardiovascular disease in older adults. The Cardiovascular Health Study. Stroke. 1994 Feb;25(2):318–327. doi: 10.1161/01.str.25.2.318. [DOI] [PubMed] [Google Scholar]
- 38.Kraut MA, Beason-Held LL, Elkins WD, Resnick SM. The impact of magnetic resonance imaging-detected white matter hyperintensities on longitudinal changes in regional cerebral blood flow. J Cereb Blood Flow Metab. 2008 Jan;28(1):190–7. doi: 10.1038/sj.jcbfm.9600512. [DOI] [PubMed] [Google Scholar]