Abstract
Volume renderings from magnetic resonance imaging data can be created and displayed in real-time with user interactivity. This can provide continuous 3D feedback to assist in guiding an interventional procedure. A system is presented which can produce real-time volume renderings from 2D multi-slice or 3D MR pulse sequences. Imaging frame rates up to 30 per second have been demonstrated with a latency of approximately one-third of a second, depending on the image matrix size. Several interactive capabilities have been implemented to enhance visualization such as cut planes, individual channel scaling and color highlighting, view sharing, saturation preparation, complex subtraction, gating control, and choice of alpha blending or MIP rendering. The system is described and some interventional application examples are shown. To view movies of some of the examples, enter the following address into a web browser: http://nhlbi.nih.gov/labs/papers/lce/guttman/rtvolmri/index/htm.
Keywords: Real-time; Volume; 3D; Interventional; Catheterization; MRI, Magnetic resonance imaging
INTRODUCTION
Volume renderings of 3D magnetic resonance imaging (MRI) data have been viewed offline by many researchers and practitioners to gain understanding of complex anatomical shapes and motion.[1-6] For example, maximum intensity projections (MIPs) through stacks of 2D images are utilized in magnetic resonance angiography (MRA) to emphasize the vessel lumen enhanced with a contrast agent.[4] When the projection direction is rotated, the observer appreciates the three-dimensional morphology of the enhanced vessels from different views. Non-real-time, offline rendering is sufficient for this noninvasive diagnostic technique. Invasive cardiovascular applications, such as catheterization, angioplasty, and stenting require real-time image feedback during catheter navigation, placement of the treatment device, and application of treatment. Low latency feedback is essential in these applications for manual control of the catheter and rapid response to complications. Currently, these clinical procedures are guided by x-ray angiography, which provides excellent spatial and temporal resolution of radio-opaque devices and contrast agent. However, this imaging modality exposes the patient to potentially harmful iodinated contrast agent, and both the patient and medical team to radiation, while offering only summation projection views and negligible soft tissue contrast. Thus, there is motivation to develop real-time MRI techniques for guiding these types of procedures.
Current real-time MRI techniques provide views of single or multiple 2D slices,[7-9] or projections.[10-13] Single slice display suffers from loss of information when the device or anatomy of interest leaves the imaging plane, requiring the user to adjust the slice location. Projection or thick slice imaging doesn't suffer from this problem, but anatomical details become blurred or obscured by other objects in the projection direction. This is often overcome by reducing the image content using background suppression and highlighting structures of interest with a T1-shortening contrast agent[11-13] or an interventional coil.[10,14] Display of multiple, thin 2D slices in separate windows may be inconvenient to the viewer, who must look around rapidly at the different slices to find one containing the detail of interest. This work demonstrates how rapidly acquired 2D slices may be volume rendered in real-time and displayed in the magnet room.[15] Volume rendering consolidates the multi-slice information into one display window while preserving many structural details otherwise lost in projection imaging. These advantages may facilitate the manipulation of an interventional device under MRI guidance.
METHODS
Equipment
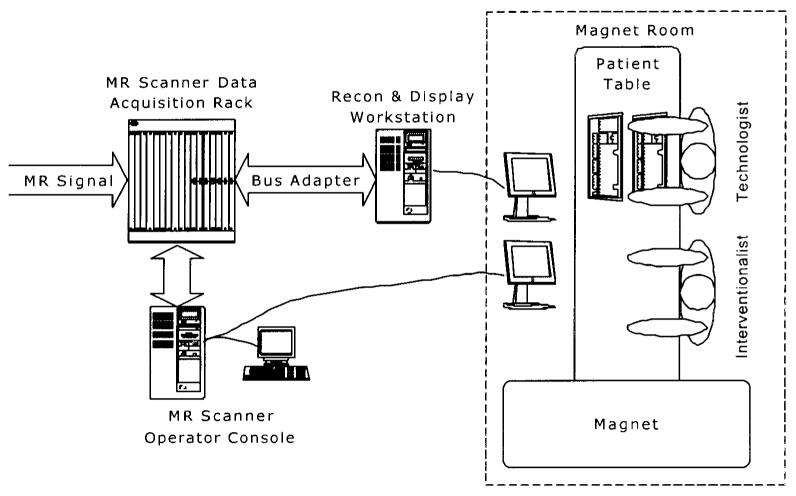
The system configuration shown in Fig. 1 is similar to that described in Ref. [7], in which an alternative subsystem is provided for image reconstruction, display, and user interaction. The MR scanner is a Signa 1.5 T CV/i (GE Medical Systems, Waukesha, WI) with gradients having a peak magnitude of 40 mT/m and slew rates of 150 mT/m/msec. MR signal was received using a 4-element phased array coil. For active catheter applications, the signal from the catheter coil replaced that from one of the surface coils. The digitized MR data is extracted from the scanner using a bus adapter (SBS Technologies, Mansfield, MA), which provides an 8 MB/sec link between the VME bus in the data acquisition rack of the scanner and the PCI bus of a workstation (Onyx RE/2, 4 CPUs, Silicon Graphics, Mountain View, CA). Using video splitters, the graphics from both the scanner and workstation are displayed in the magnet room on MR compatible LCD monitors (Aydin Displays, Horsham, PA). Personnel in the magnet room interacted with the scanner and workstation through a keyboard and mouse or trackball placed on the patient table (Fig. 2).
Figure 1.
Configuration of MRI system for producing real-time volume renderings.
Figure 2.
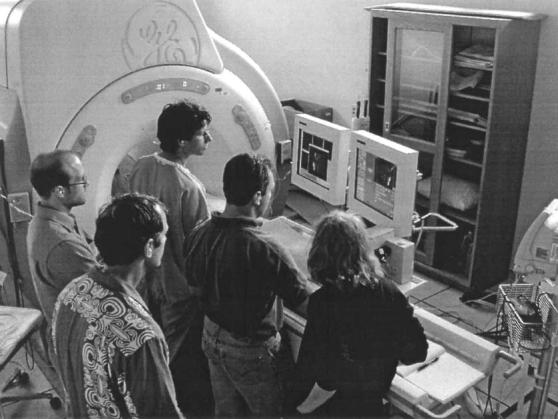
Usage of the real-time volume rendering system in an intervention experiment. Two monitors were used, displaying a replication of the scanner console on the right, and the real-time volume rendering on the left.
The MR scanner was programmed to execute the pulse sequence and indicate when raw data for a slice was ready by sending a signal through the bus adapter. The workstation, on the other side of the bus adapter, ran a multi-threaded program to respond to signals from the scanner, and handle the tasks of data transfer, image reconstruction, graphical display, and user interaction.
Image Generation
The system can generate real-time volume renderings from either 2D multi-slice or 3D acquisitions, and we will describe the former here. Streams of 2D multi-slice data were produced using a fast gradient-recalled echo-train (FGRE-ET) sequence.[16,17] Raw data were acquired for the image reconstruction of a given slice before advancing to the next slice. Depending on the desired trade-off between frame rate and image quality, 1–4 echoes per excitation were used. The pulse sequence program could optionally run FGRE, RF-spoiled gradient recalled echo (SPGR) or steady-state free precession (SSFP a.k.a. FISP).[18] The number of slices, initial slice orientation, and other standard MR imaging parameters were specified using the scanner's user interface. During the scan, the imaging plane could be adjusted interactively using the scanner's real-time interface, i-Drive®. The following custom pulse sequence parameters could be controlled interactively during the scan with a single button press:
Enable or disable ECG gating.
Enable or disable view sharing. During view sharing, acquisitions alternate between the even and odd phase-encoding views.
Reconstructions are performed at twice the imaging rate using the most recently acquired sets of even and odd views.
Enable or disable saturation preparation to execute before the start of each slice acquisition. This was typically a nonselective 908 pulse followed by gradient spoiling, but the user could alternatively prescribe a spatially or chemically selective saturation pulse.
For contrast-enhanced imaging, Gd-DTPA (Magnevist, Berlex, Montville, NJ) was used as a T1-shortening agent. To visualize injections of the agent, the signal from background tissues was suppressed with magnetization preparation using a nonselective 90° saturation pulse immediately prior to the acquisition of each image.
When imaging with SSFP, an α/2 pulse was played at time TR/2 before the first excitation to prepare the magnetization for steady-state imaging, as described in Ref. [19]. After the last view was collected for a given slice, an a pulse followed by a −α/2 pulse at time TR/2 later was used to store the steady-state magnetization longitudinally;[20] a gradient spoiler pulse was then used to de-phase any remaining transverse magnetization. A nonselective background suppression sequence was executed, if that option was enabled, and imaging continued at the next slice location starting with the α/2 preparation sequence as above. Although not perfect, this simple method provided effective background suppression and multiple-slice imaging without adding significant image artifact or time penalty.
Data Acquisition, Image Reconstruction, and Display
The scanner sampled, filtered, and stored the MR signal sensed by the receiver coils in standard fashion. A process running on one of the scanner computers sent a signal to the workstation via the bus adapter when data acquisition was complete. Upon receipt of the signal from the scanner, the data and relevant information were transferred from the scanner and stored in a buffer. Prior to FFT, raw data was zero-padded up to 192 in the frequency encoding axis and 192 × phaseFOV in the phase encoding axis, where phaseFOV < 1 for a rectangular field-of-view. Fast Fourier transforms were performed using the FFTw library (fftw.org). Images were reconstructed using a separate process thread (POSIX standard, IEEE) for each receiver channel, increasing throughput on the multi-CPU workstation. Multiple channel data were combined into a single magnitude image for display. The user interface, written using the OpenGL Utility Toolkit (GLUT, opengl.org), was used to provide interactive controls such as channel scaling (gain adjustment for each channel). The user could also choose to color-highlight one of the channels (e.g., to highlight an interventional coil as described in Refs. [14,25]), in which case we defined the image color at a given pixel location as follows:
| (1) |
where r, g, b, α are the red, green, blue, and alpha values for the color pixel; h is the magnitude value from the channel to be highlighted; and p is the magnitude sum from the other channels. Both h and p are previously scaled for brightness and limited to the range [0, 1]. This method produces a red highlight and can be modified easily to use any color. The alpha value is a translucency factor, clamped to the range [0, 1], where 0 is transparent and 1 is opaque. Constants cα, and α0 are set by the user to adjust the overall translucency of the objects within the volume.
Immediately after each image reconstruction, the volume rendering was updated using the Volumizer and OpenGL libraries (Silicon Graphics and opengl.org). The volume data was stored in a 3D texture map, and the subregion corresponding to the newly acquired slice was loaded with the new image data. The Volumizer library utilizes trilinear interpolation to polygonize the volume data and render the volume in layers from back to front using a predefined blend function, such as alpha blending or MIP. Alpha blending weights each new layer by scalar α and the existing display buffer contents by 1 – α. This linear combination imparts a translucency effect to the objects within the volume. MIP, which selects the maximum of the new layer and display buffer contents, regardless of a, was used to visualize injections of contrast agent during background suppression.
During real-time imaging, the user interface allowed modification of any pulse sequence parameter listed above as well as the following reconstruction and display parameters:
Rotate or translate the volume rendering. This allowed viewing from different angles to enhance the appreciation of 3D structures.
Switch between alpha blending and MIP rendering methods. Different rendering methods were more effective when using certain imaging modes.
Individually scale the signal from each receiver channel and color-highlight a selected channel. This was used to enhance the visualization of an interventional coil.
Display images in reverse-video, where bright image pixels are mapped to dark display pixels, and vice versa. Especially when combined with MIP rendering, this mode enhanced visualization of dark objects.
Adjust image brightness.
Turn on or off saving image data to files. Both raw data and fully reconstructed images (with optional scaling and color enhancement) were streamed to files for subsequent review.
Create, translate, rotate or delete cut planes. This feature was used to cut away bulk tissue, revealing otherwise embedded structures. It also allowed visualization of a surface oblique to the slice planes.
Turn on or off complex subtraction imaging,[21] or define a new fixed reference. The reference image could be fixed in time, or dynamic (to approximate a time derivative). This was used to enhance visualization of changes in tissue contrast.
Experiments
In vivo experiments were performed to demonstrate some uses of the real-time volume rendering system. All experiments were performed using protocols approved by the NHLBI Animal Care and Use Committee. Figure 3 shows single frames of a multiple-slice real-time imaging stream of an MRI-guided trans-thoracic myocardial injection. The left ventricle (LV) myocardium of 4 miniswine were injected with 1 mL of 0.03 mM Gd-DTPA. Injectate was delivered through a 0.65-mm diameter titanium needle (Daum Corp., Chicago, IL) inserted through the chest wall during axial real-time MR imaging.[22] SSFP imaging was used to guide needle placement (not shown) and SPGR was used to visualize the injections. SPGR imaging parameters were: GE cardiac phased-array 4-element coil, 90° water saturation preparation, 20-msec inversion time (TI), 20° flip angle, two echoes per excitation, 340 × 260mm2FOV, 256 × 96 matrix, 62.5 KHz bandwidth, 8 mm slice thickness. An ECG signal triggered the acquisition of four adjacent axial slices. View sharing, where even and odd echoes were acquired during alternating heartbeats, was used to increase the number of slices per heartbeat. The bolus injection was seen in slices 3 and 4, while different segments of the needle were seen as a signal void penetrating the chest wall in slices 1, 2, and 3. Figure 4 shows the slices consolidated into a volume rendering. MIP was used, which highlights the Gd-DTPA injection, but obscured the view of the needle embedded in the bright adipose tissue through the chest wall. The 3D dynamic morphology of the bolus was observed in real-time, growing in size during the injection and then slowly spreading and fading in intensity. Visualization of the bolus was enhanced using cut planes (Fig. 4c) to remove the fatty chest wall from the rendering, which would otherwise obscure the injection site while rotating the MIP. The morphology of the bolus in the myocardium could then be viewed from the side, but with lower spatial resolution. Multiple bolus injections were attempted in each pig, the success of which was limited by clogging of the injection tube. All successful injections were well visualized in the real-time volume renderings using background suppression.
Figure 3.
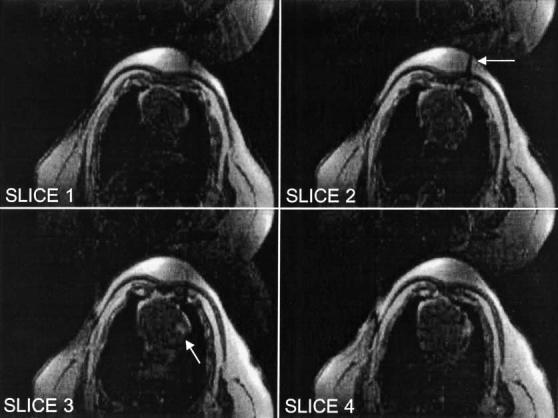
Trans-thoracic myocardial injection of Gd-DTPA. Background suppression was enabled in these FGRE images. The needle is visible penetrating the chest wall in slice 2 (arrow). The bolus of Gd-DTPA is visible injected into the LV myocardium in slices 3 (arrow) and 4.
Figure 4.
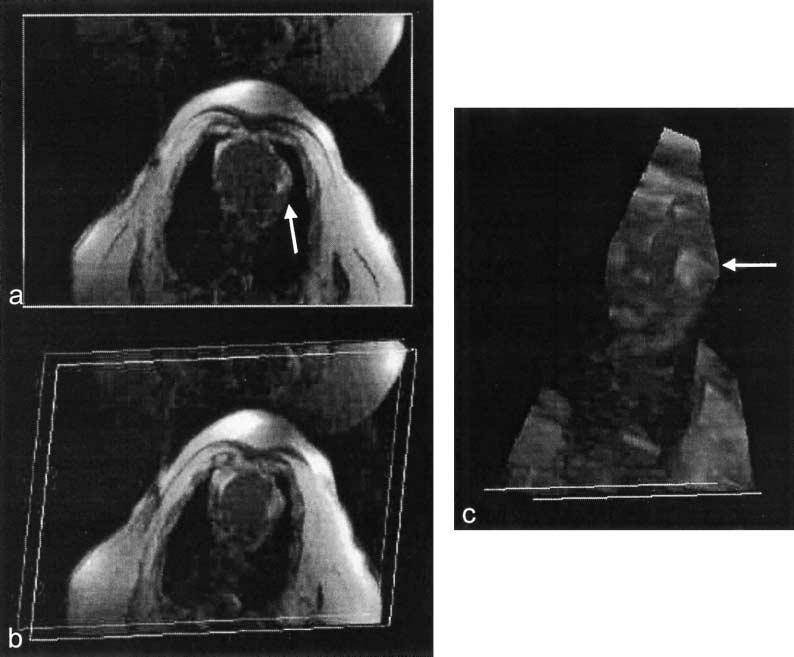
Volume renderings of myocardial injection. MIP was used to highlight the injection of Gd-DTPA (arrow). (a) Axial slice view. (b) Volume was rotated to view from a different angle. (c) Chest wall was removed using cut planes to enable an unobstructed view of the injection site.
Renal angiography was tested in three miniswine using interactive control of background suppression. A trans-femoral guiding catheter was inserted into a renal artery under x-ray fluoroscopy. Background suppression was enabled during real-time MR imaging (Figs. 5 and 6, time b). Gd-DTPA was then injected, and was seen in the renal artery at time c, slice 1. Kidney enhancement was then seen in all slices, time d, followed by venous outflow at time e. Structures of interest were seen in each slice of Fig. 5, requiring the viewer to scan the different display windows while performing the procedure. In contrast, all the structures of interest were seen in a single window using the volume rendering shown in Fig. 6. Imaging parameters were the same as that for the transthoracic injection except for the following: three slices, 1 echo per excitation, no view sharing, and no ECG gating. Visualization of the injection was unsuccessful in one attempt due to poor underlying image quality.
Figure 5.
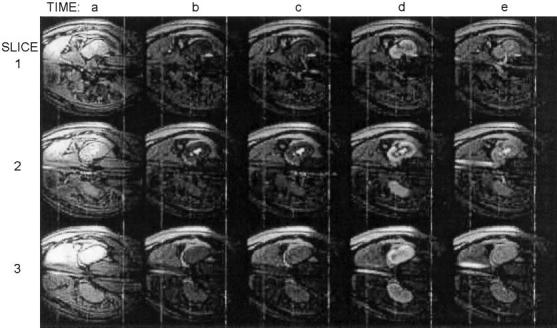
Images from a 3-slice renal angiography example. Background suppression was activated at time b. A Gd-DTPA injection is visible entering the kidney via the renal artery at time c in slice 1. The kidney is enhanced at time d. At time e, contrast agent is visible exiting the kidney via the renal vein (slice 1) and inferior vena cava (slices 2 and 3).
Figure 6.
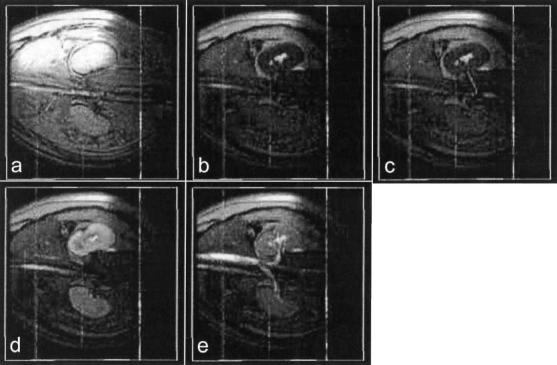
Volume renderings of the renal angiography example using MIP. Time frames a–e are the same as in Fig. 5. Renal artery, kidney, renal vein, aorta, and vena cava are all visible in the renderings.
A passive trans-femoral LV guiding catheter was advanced into the LV cavity of two miniswine under real-time volumetric MR image guidance. The signal void created by the catheter was visible as it passed from the aorta, through the aortic valve into the LV (Fig. 7). None of the individual 2D slices showed the full length of the catheter since it traversed from one slice plane to another (Fig. 7a). In a volume rendering with alpha blending (Fig. 7b), the entire length of the catheter was visible. A MIP would have obscured the catheter embedded in the bright surrounding tissue, but a MIP through reverse-video provided an alternate method of viewing the catheter (Fig. 7c). This mode suppresses the myocardium and blood, but may be useful for intermittent verification of catheter location or orientation. The imaging parameters were: FGRE, ECG gated, three slices, 256 × 128 matrix, four echoes per excitation, 320 × 240 mm2FOV, NEX (i.e., k-space coverage in the phase-encoding direction). Catheter navigation into the LV was successful in all attempts. However, finding image planes containing the dark lumen of the passive catheter was sometimes difficult, and it was decided to continue the study using active devices (those which receive MR signal).
Figure 7.
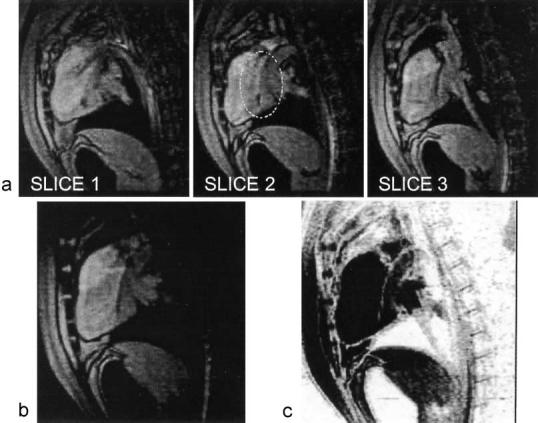
A passive guiding catheter in the LV creates a visible signal void. (a) Three slices with different portions of the catheter visible in each slice. Only the tip is visible in slice 1, and a portion is missing in slice 2 (circled) which is seen in slice 3. (b) Volume rendering of the same with alpha blending. The entire portion of the catheter around the aortic arch into the LV cavity is visible. (c) The catheter is also visible in reverse-video, through which an MIP is shown.
Active MR devices provide enhanced visualization of device position, orientation, and surrounding tissue.[23,24] We show an example from a series of endomyocardial injection experiments in healthy swine, details of which are described in Ref. [25]. A coaxial trans-femoral guiding catheter, which was modified to receive MR signal (Boston Scientific, Plymouth, MN), was used to navigate up the aorta and into the LV cavity (Fig. 8) under the guidance of real-time multi-slice SSFP MRI. We used a custom-designed set of four independent high-impedance surface coils (Nova Medical, Wakefield, MA), three of which were placed on the chest of the supine pig. The fourth coil was disconnected and its channel used to receive signal from the catheter. Imaging parameters were: 128 × 96 matrix, one echo per excitation, 320 × 240 mm2FOV, NEX, 7 mm slice thickness, TR = 4.4 msec. The imaging sequence was not gated, running continuously at approximately four frames per second. Channel scaling and color highlighting was used to facilitate visualization of the catheter.
Figure 8.
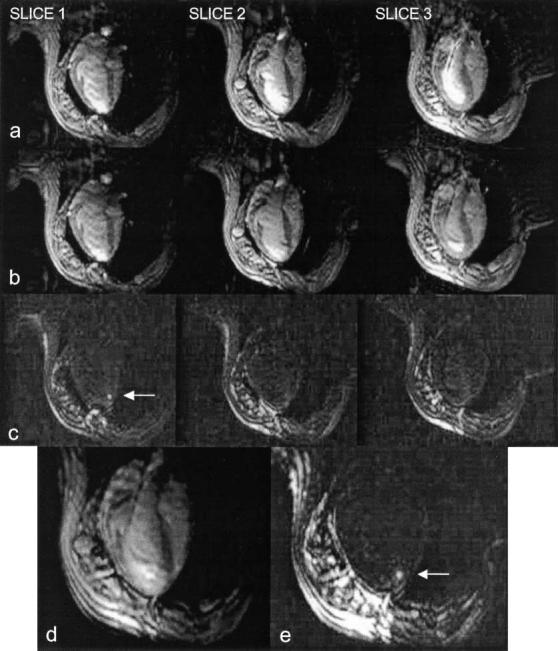
MR-guided myocardial injection. (a) Three slices shown without color enhancement. Signal from active guiding catheter is amplified and combined with surface coil signals. (b) Same slices shown with color enhancement. Injection catheter tip is apparently in slice 2 and the distal portion of the guiding catheter in the LV is seen most clearly in slice 3. (c) With background suppression enabled, the endomyocardial injection (arrow) is actually seen in slice 1, not where tip was observed. (d, e) Entire length of guiding catheter, tip of injection catheter (with alpha blending) and injection site (with background suppression and MIP, arrow) are seen in the volume rendering.
After maneuvering the guiding catheter to rest the tip against the myocardial wall of the apical septum, a flexible MR-compatible needle (Stilletto, Boston Scientific) was advanced through the catheter and extended beyond the tip, penetrating the myocardium by spring-activated needle deployment. The length of the catheter was visible in slice 3 of Fig. 8b except for the tip, which was apparently in slice 2. A button was then pressed to enable background suppression using the method described above, and 1 mL of 30 mM Gd-DTPA was injected into the myocardium. The Gd-DTPA bolus was clearly visible in slice 1 of Fig. 8c, not in slice 2 as was expected. In the volume rendering, the entire length of the catheter was visible in Fig. 8d, and the injected bolus was visible in Fig. 8c with background suppression and MIP enabled.
DISCUSSION
Real-time volume renderings were shown to be useful for interventional MR imaging when structures of interest are distributed across multiple slices. An advantage over separate slice display is that the physician can find a structure of interest without having to glance at several viewing windows. Visualizing anatomical structures and devices with real-time 3D feedback may also assist in device manipulation during an interventional procedure. Success of the volumetric visualization was dependent predominantly on the underlying image quality.
During navigation with passive or active devices, we found that alpha blending is preferable to MIP, which promotes the brightest objects and can obscure more subtle details. However, this characteristic makes MIP most effective during background suppression while visualizing a T1-shortening contrast agent. The mapping that transforms pixel values to alpha values is important in determining the visibility of subtle details, as well as suppressing the darkest pixels and background noise. Mappings other than the one given in Eq. (1), as well as interactive control, will be evaluated.
Color highlighting facilitated localization of an active catheter. Not only did it provide useful feedback during navigation through vessels, but it allowed differentiation between the bright signals from the catheter and the LV cavity blood pool during SSFP imaging. Even in situations where the catheter was near, but not in, the selected slice (e.g., Fig. 8, slice 1), no evidence of the catheter was seen without highlighting (Fig. 8a). With highlighting, some color from the catheter signal was clearly observed (Fig. 8b). This feature made it easier to maneuver the catheter into the imaging plane or vice versa. X-ray angiography was available in the same room as the MRI for all of the catheterization experiments, and was used the first time because we assumed that it would be necessary. However, a comfort level was quickly reached and subsequent catheterizations were performed entirely under real-time MRI guidance.
“Real-time imaging” means high frame rate and low latency (the latter often omitted when the term is misused), presenting images of dynamic events as they occur. Exactly what rates and latencies are acceptable for image guided interventional procedures depend greatly on the nature of the task being performed and the image content, and have not been estimated for the types of procedures we are investigating. Our goal was that the free-running frame rate of the reconstruction and volume rendering system always exceeds the rate at which the scanner produces image data, and that the latency does not exceed one-fourth of a second. We estimate the system latency at one-third of a second and hope to reduce this with code optimization. The free-running frame rate is determined by allowing the system to continuously process previously acquired data. For the matrix sizes used in the data presented here, the free-running frame rate ranges from 17 images per second for scans with a 256 × 128 matrix to 37 images per second for scans with a 128 × 96 matrix. This will certainly increase using faster CPU technology with a limit of 60 frames per second, which is the refresh rate of typical LCD monitors.
We have described acquisition and volume rendering of many slices per heartbeat in a previous report.[15] However, the volume renderings we show in this work consist of a small number of slices (3 or 4). One reason for this is to minimize the impact on temporal resolution, which is reduced by increasing the number of slices. Another reason to keep the slice count low is that in our experience, when a volume rendering with much depth is presented on the display, the first action taken by the user is to cut away data. It was more practical to acquire a small number of slices, trying to place the center slice on the structure of interest and allowing the other slices to “bracket” the structure. This allowed visualization of the portions of the structure located outside of the central slice, but without adding extra data which may only obscure structures of interest.
Stair-stepping artifact is seen on the chest wall in the volume rendering of Fig. 8d (lower left region of the picture). This occurs when viewing a structure (a layer of fat in this case) whose position changes by a distance greater than its thickness is successive slices, and is exacerbated by the relatively poor through-plane spatial resolution of 2D MR images. However, this was not a significant limitation in our experience, and the artifact can be reduced by using thinner slices, or a “filling” or surface-rendering algorithm. Solutions such as these come with other costs, but will be investigated.
Longitudinal storage of SSFP magnetization between image acquisitions proved to be quite effective when doing multi-slice imaging and/or background suppression. We wanted to take advantage of the increased SNR with SSFP, but had some concerns about disruption of steady-state magnetization when using these techniques. We observed no substantial image artifacts during our experiments and can recommend the use of longitudinal storage when continuous excitations cannot be performed. There was also concern about how well Gd-DTPA would be visualized using SSFP since the steady-state signal is weighted by T2/ T1 rather than T1.[18] However, the background suppression increases the T1 weighting and the Gd-DTPA was always well visualized. In fact, for most of the myocardial injections we have performed, the bolus was clearly visible even with no background suppression.
3D perception is much improved when viewing the images in real-time and when the user can rotate the object to obtain different viewing angles. This is in part ascribed to our innate ability to recognize and track patterns over time, to separate stationary patterns from those that are in motion, and to filter temporal noise (discussed in Ref. [26]). Real-time interactive 3D imaging allowed the user to observe the catheter shape, orientation, and position relative to the LV cavity and myocardium better than when viewing single 2D images.*
CONCLUSION
Real-time volume renderings in MRI are possible on a clinical MR scanner with custom modifications. Combined with interactive features such as individual channel color highlighting, nonselective saturation preparation, and selection of rendering method, some interventional procedures will benefit from real-time 3D feedback in the magnet room; especially those procedures that track devices or structures through multiple slices.
ACKNOWLEDGMENTS
The authors are thankful for assistance from J. Andrew Derbyshire, Meiyappan Solaiyappan, Richard Thompson, Dana Peters, Joni Taylor, and Diana Lancaster.
Footnotes
Some movie clips from the experiments presented herein can be viewed at the following internet address: http://nhlbi.nih.gov/labs/papers/lce/guttmanm/rtvolmri/index.htm.
REFERENCES
- 1.Bomans M, Hohne KH, Laub G, Pommert A, Tiede U. Improvement of 3D Acquisition and Visualization in MRI. Magn. Reson. Imaging. 1991;9(4):597–609. doi: 10.1016/0730-725x(91)90048-q. [DOI] [PubMed] [Google Scholar]
- 2.Hu X, Alperin N, Levin DN, Tan KK, Mengeot M. Visualization of MR Angiographic Data with Segmentation and Volume-Rendering Techniques. J. Magn. Reson. Imaging. 1991;1(5):539–546. doi: 10.1002/jmri.1880010506. [DOI] [PubMed] [Google Scholar]
- 3.Meier RA, Marianacci EB, Costello P, Fitzpatrick PJ, Hartnell GG. 3D Image Reconstruction of Right Subclavian Artery Aneurysms. J. Comput. Assisted Tomogr. 1993;17(6):887–890. doi: 10.1097/00004728-199311000-00008. [DOI] [PubMed] [Google Scholar]
- 4.Goldfarb JW, Edelman RR. Coronary Arteries: Breath-Hold, Gadolinium-Enhanced, Three-Dimensional MR Angiography. Radiology. 1998;206:830–834. doi: 10.1148/radiology.206.3.9494509. [DOI] [PubMed] [Google Scholar]
- 5.Solaiyappan M, Poston T, Heng PA, McVeigh ER, Guttman MA, Zerhouni EA. Interactive Visualization for Rapid Noninvasive Cardiac Assessment. Computer. 1996;29:55–62. [Google Scholar]
- 6.Okuda S, Kikinis R, Geva T, Chung T, Dumanil H, Powell AJ. 3D-Shaded Surface Rendering of Gadolinium-Enhanced MR Angiography in Congenital Heart Disease. Pediatr. Radiol. 2000;30(8):540–545. doi: 10.1007/s002470000243. [DOI] [PubMed] [Google Scholar]
- 7.Kerr AB, Pauly JM, Hu BS, Li KC, Hardy CJ, Meyer CH, Macovski A, Nishimura DG. Real-Time Interactive MRI on a Conventional Scanner. Magn. Reson. Med. 1997;38(3):355–367. doi: 10.1002/mrm.1910380303. [DOI] [PubMed] [Google Scholar]
- 8.Nayak KS, Pauly JM, Nishimura DG, Hu BS. Rapid Ventricular Assessment Using Real-Time Interactive Multislice MRI. Magn. Reson. Med. 2001;45:371–375. doi: 10.1002/1522-2594(200103)45:3<371::aid-mrm1048>3.0.co;2-z. [DOI] [PubMed] [Google Scholar]
- 9.Bornstedt A, Nagel E, Schalla S, Schnackenburg B, Klein C, Fleck E. Multi-slice Dynamic Imaging: Complete Functional Cardiac MR Examination Within 15 Seconds. J. Magn. Reson. Imaging. 2001;14:300–305. doi: 10.1002/jmri.1186. [DOI] [PubMed] [Google Scholar]
- 10.Ladd ME, Quick HH, Debatin JF. Interventional MRA and Intravascular Imaging. J. Magn. Reson. Imaging. 2000;12(4):534–546. doi: 10.1002/1522-2586(200010)12:4<534::aid-jmri4>3.0.co;2-q. [DOI] [PubMed] [Google Scholar]
- 11.Serfaty JM, Atalar E, Declerck J, Karmakar P, Quick HH, Shunk KA, Heldman AW, Yang X. Real-Time Projection MR Angiography: Feasibility Study. Radiology. 2000;217:290–295. doi: 10.1148/radiology.217.1.r00se42290. [DOI] [PubMed] [Google Scholar]
- 12.Bos C, Bakker CJG, Viergever MA. Background Suppression Using Magnetization Preparation for Contrast-Enhanced MR Projection Angiography. Magn. Reson. Med. 2001;46:78–87. doi: 10.1002/mrm.1162. [DOI] [PubMed] [Google Scholar]
- 13.Omary RA, Unal O, Koscielski DS, Frayne R, Korosec FR, Mistretta CA, Strother CM, Grist TM. Real-Time MR Imaging-Guided Passive Catheter Tracking with Use of Gadolinium-Filled Catheters. J. Vasc. Interv. Radiol. 2000;11(8):1079–1085. doi: 10.1016/s1051-0443(07)61343-8. [DOI] [PubMed] [Google Scholar]
- 14.Serfaty JM, Yang X, Aksit P, Quick HH, Solaiyappan M, Atalar E. Toward MRI-Guided Coronary Catheterization: Visualization of Guiding Catheters, Guidewires and Anatomy in Real-Time. J. Magn. Reson. Imaging. 2000;12:590–594. doi: 10.1002/1522-2586(200010)12:4<590::aid-jmri11>3.0.co;2-3. [DOI] [PubMed] [Google Scholar]
- 15.Guttman MA, Sorger JM, McVeigh ER. Real-Time Volumetric MR Imaging; Proceedings of the ISMRM; Glasgow. 2001. p. 598. [Google Scholar]
- 16.Reeder SB, Atalar EA, Faranesh AZ, McVeigh ER. Multi-echo Segmented k-Space Imaging: An Optimized Hybrid Sequence for Ultra-fast Cardiac Imaging. Magn. Reson. Med. 1999;41(2):375–385. doi: 10.1002/(sici)1522-2594(199902)41:2<375::aid-mrm23>3.0.co;2-z. [DOI] [PMC free article] [PubMed] [Google Scholar]
- 17.Epstein FH, Wolff SD, Arai AE. Segmented k-Space Fast Cardiac Imaging Using an Echo-Train Readout. Magn. Reson. Med. 1999;41:609–613. doi: 10.1002/(sici)1522-2594(199903)41:3<609::aid-mrm25>3.0.co;2-2. [DOI] [PubMed] [Google Scholar]
- 18.Oppelt A, Graumann R, Barfuß H, Fischer H, Hartl W, Scajor W. FISP—A New Fast MRI Sequence. Electromedica. 1986;54(1):15–18. [Google Scholar]
- 19.Deimlink M, Heid O. Magnetization Prepared True FISP Imaging; Proceedings of the ISMRM; 1994. p. 495. [Google Scholar]
- 20.Scheffler K, Heid O, Hennig J. Magnetization Preparation During the Steady State: Fat Saturated 3D True FISP. Magn. Reson. Med. 2001;45:1075–1080. doi: 10.1002/mrm.1142. [DOI] [PubMed] [Google Scholar]
- 21.Wang Y, Johnston DL, Breen JF, Huston J, III, Jack CR, Julsrud PR, Kiely MJ, King BF, Riederer SL, Ehman RL. Dynamic MR Digital Subtraction Angiography Using Contrast Enhancement, Fast Data Acquisition and Complex Subtraction. Magn. Reson. Med. 1996;36:551–556. doi: 10.1002/mrm.1910360408. [DOI] [PubMed] [Google Scholar]
- 22.Sorger JM, Guttman MA, Wassmuth R, McVeigh ER. Real Time MRI Guided Drug Delivery; Proceedings of the ISMRM; Glasgow. 2001. p. 2187. [Google Scholar]
- 23.Dumoulin CL, Souza SP, Darrow RD. Real-Time Position Monitoring of Invasive Devices Using Magnetic Resonance. Magn. Reson. Med. 1993;29(3):411–415. doi: 10.1002/mrm.1910290322. [DOI] [PubMed] [Google Scholar]
- 24.Lardo AC. Real-Time Magnetic Resonance Imaging: Diagnostic and Interventional Applications. Pediatr. Cardiol. 2000;21(1):80–98. doi: 10.1007/s002469910010. [DOI] [PubMed] [Google Scholar]
- 25.Lederman RJ, Guttman MA, Peters DC, Thompson RB, Sorger JM, Dick AJ, Raman VK, McVeigh ER. Catheter-Based Endomyocardial Injection with Real-Time Magnetic Resonance Imaging. Circulation. 2002;105(11):1282–1284. doi: 10.1161/01.CIR.0000012425.71261.FC. [DOI] [PMC free article] [PubMed] [Google Scholar]
- 26.Guttman MA, McVeigh ER. Techniques for Fast Stereoscopic MR Imaging. Magn. Reson. Med. 2001;46(2):317–323. doi: 10.1002/mrm.1194. [DOI] [PMC free article] [PubMed] [Google Scholar]


