

Abstract
Background
Although deep brain stimulation of the subthalamic nucleus (STN DBS) in Parkinson disease (PD) improves motor function, it has variable effects on working memory (WM) and response inhibition (RI) performance. The purpose of this study was to determine the neural correlates of STN DBS-induced variability in cognitive performance.
Methods
We measured bilateral STN DBS-induced blood flow changes (PET and [15O]-water on one day) in the supplementary motor area (SMA), dorsolateral prefrontal cortex (DLPFC), anterior cingulate cortex (ACC), and right inferior frontal cortex (rIFC) as well as in exploratory ROIs defined by published meta-analyses. STN DBS-induced WM and RI changes (Spatial Delayed Response and Go-No-Go on the next day) were measured in 24 PD participants. On both days, participants withheld PD medications overnight and conditions (OFF v. ON) were administered in a counterbalanced, double-blind manner.
Results
As predicted, STN DBS-induced DLPFC blood flow change correlated with change in WM, but not RI performance. Furthermore, ACC blood flow change correlated with change in RI but not WM performance. For both relationships, increased blood flow related to decreased cognitive performance in response to STN DBS. Of the exploratory regions, only blood flow changes in DLPFC and ACC were correlated with performance.
Conclusions
These results demonstrate that variability in the effects of STN DBS on cognitive performance relates to STN DBS-induced cortical blood flow changes in DLPFC and ACC. This relationship highlights the need to further understand the factors that mediate the variability in neural and cognitive response to STN DBS.
Keywords: Parkinson disease, deep brain stimulation, working memory, response inhibition, PET
Deep brain stimulation of the subthalamic nucleus (STN DBS) provides effective treatment of the motor symptoms for many individuals with Parkinson disease (PD) (Limousin et al., 1995). However, recent work suggests that STN DBS has a more variable effect on cognitive functioning (Voon, Kubu, Krack, Houeto, & Troster, 2006) and may even negatively affect select cognitive processes, especially cognitive control (Temel, Blokland, Steinbusch, & Visser-Vandewalle, 2005). In fact, a recent review of the literature revealed that approximately 41% of individuals with STN DBS experience cognitive problems (Temel et al., 2006). Cognitive dysfunction in non-demented individuals with PD is common (30–70%) (Green et al., 2002); can significantly decrease perceived quality of life (Schrag, Jahanshahi, & Quinn, 2000); can impair functional ability in work and home environments (Weintraub, Moberg, Duda, Katz, & Stern, 2004); and is a relatively common effect of STN DBS (Temel et al., 2006). To further optimize this therapeutic technique, it is important to determine the mechanisms that produce the variability in cognitive effects of STN DBS. This information may also provide new insights into basal ganglia-thalamocortical pathway involvement in cognitive control.
Although the role of the prefrontal cortex (PFC) in cognitive control processes has been emphasized, the STN also may contribute to cognitive control systems (Baunez et al., 2001; Chudasama, Baunez, & Robbins, 2003; Nakano, Kayahara, Tsutsumi, & Ushiro, 2000) through its connections to the PFC (Alexander, Crutcher, & DeLong, 1990; Alexander, DeLong, & Strick, 1986). According to the most commonly accepted models of frontal-striatal circuitry (Alexander et al., 1990; Alexander et al., 1986; Middleton & Strick, 2000), basal ganglia output directly targets prefrontal cortex including the dorsolateral prefrontal cortex (DLPFC) and the anterior cingulate cortex (ACC), and the STN plays an important role in these circuits (Temel et al., 2005). Recent evidence also suggests that the right inferior frontal cortex (rIFC) connects to STN via the “hyperdirect” pathway (Aron, Behrens, Smith, Frank, & Poldrack, 2007). These prefrontal regions are centrally involved in cognitive control. For example, working memory (WM) processes rely on the DLPFC (Braver et al., 1997; Goldman-Rakic, 1990; Wager & Smith, 2003), whereas performance on response inhibition (RI) tasks is often associated with the ACC and the rIFC (Aron, Robbins, & Poldrack, 2004; Barch et al., 2001; Botvinick, Nystrom, Fissell, Carter, & Cohen, 1999; Braver, Barch, Gray, Molfese, & Snyder, 2001; Konishi et al., 1999; Menon, Adleman, White, Glover, & Reiss, 2001; Nee, Wager, & Jonides, 2007; Wager et al., 2005). A functional role of the STN in these cognitive control processes is supported by the effects of lesions of the STN in animals, specifically demonstrating poor cognitive control and impaired ability to inhibit responses under conditions of strong conflict (Baunez et al., 2001; Baunez, Nieoullon, & Amalric, 1995; Baunez & Robbins, 1997; Temel et al., 2005).
However, STN DBS has variable effects on tasks that rely on cognitive control (Voon et al., 2006; Temel et al., 2005) whereas those that do not depend heavily on cognitive control (e.g., non-declarative memory, decision-making, visuomotor sequencing, and language) appear to be relatively unaffected by STN DBS (Funkiewiez et al., 2004; Halbig et al., 2004; Morrison et al., 2004a). Two aspects of cognitive control that have contradictory findings across studies are WM and RI performance. STN DBS has been demonstrated to improve performance (Pillon et al., 2000a; van den Wildenberg et al., 2006), impair performance (Dujardin, Defebvre, Krystkowiak, Blond, & Destee, 2001; Hershey et al., 2004; Witt et al., 2004), or have no significant effect on cognitive control performance (Morrison et al., 2004).
The variability in STN DBS responses across studies may, in part, reflect methodological differences. The most obvious difference across studies is the use of different cognitive tasks. However, other methodological limitations also may contribute to these discrepancies. For example, small sample size limits confidence in some findings (N < 15; c.f., Jahanshahi et al., 2000; Schroeder et al., 2002; Schroeder et al., 2003). Medication (i.e., levodopa) effects may have confounded several previous investigations (c.f., Pillon et al., 2000b; Trepanier, Kumar, Lozano, Lang, & Saint-Cyr, 2000; Witt et al., 2004) since levodopa has its own variable effects on cognition (Cools, 2006), making it difficult to isolate the specific effects and mechanisms of STN stimulation. Other studies focused on the surgical effects of STN DBS rather than the direct manipulation of only stimulation (c.f., Saint-Cyr, Trepanier, Kumar, Lozano, & Lang, 2000; Trepanier et al., 2000).
Although methodological differences may have contributed to some of the discrepancies across studies, other factors must explain variability of STN DBS-induced cognitive effects across individuals within a study. Clarification of these other factors requires an understanding of the neurophysiological mechanisms of STN DBS which still remain unclear. The most commonly proposed mechanisms of STN DBS are that it 1) blocks local neuronal activity (“conduction block”), 2) excites local inhibitory afferent neurons to reduce neuronal output, or 3) directly excites output neurons (Montgomery, Jr. & Baker, 2000; Perlmutter & Mink, 2006). In support of the latter mechanism, PET studies have revealed that STN stimulation increases subcortical while decreasing cortical blood flow (Hershey et al., 2003; Schroeder et al., 2003), suggesting that stimulation increases STN output leading to increased thalamic inhibition of cortical activity (Hershey et al., 2003). Furthermore, PET studies have demonstrated that STN DBS increased blood flow or glucose metabolism in both the thalamus as well as areas of the frontal, temporal, and parietal cortex (Hilker et al., 2004; Trost et al., 2006). Additional PET studies have also been conducted with the inclusion of motor or cognitive tasks during PET scanning (Schroeder et al., 2002; Strafella, Dagher, & Sadikot, 2003). Interestingly, STN stimulation was reported to decrease activation in the ACC during a response inhibition (Stroop) task and the decreased activity in the ACC correlated with decreases in Stroop interference performance (Schroeder et al., 2002). However, because these studies assessed the effects of stimulation on blood flow changes during a cognitive task, it is impossible to separate the effects of stimulation from the effects of the cognitive task on blood flow (Schroeder et al., 2002; Strafella et al., 2003). Thus, these studies have limited ability to determine the neurophysiologic underpinnings of STN DBS’s effects on cognitive control.
Therefore, the purpose of the present study was to investigate the possible neural correlates of STN DBS induced variability in cognitive control, focusing on the relationships between STN DBS blood flow responses in cortical areas and WM and RI performance. To address this issue, we correlated regional PET blood flow change with WM and RI change induced by STN DBS in people with PD. We predicted that DBS-induced blood flow changes in the DLPFC would be associated with DBS-induced changes in WM performance, whereas DBS-induced blood flow changes in the ACC would be related to RI performance. Based on the growing evidence that the rIFC is important for successful RI performance, we also explored DBS-induced blood flow changes in the rIFC as another possible neural correlate of STN DBS induced changes in RI performance. We also examined stimulation-induced blood flow changes in the supplementary motor area (SMA). Although we expected stimulation-induced changes in blood flow in the SMA, we did not expect any specific relationship between blood flow in the SMA and cognitive performance. Thus, the SMA region served as a “control” to guard against the possibility of a more global relationship between blood flow and cognitive performance. Finally, we also included exploratory analyses of additional ROIs based on meta-analyses of the GNG task (Nee et al., 2007) and working memory (Wager et al., 2003) to explore relevant task-related regions more widely. Importantly, we measured the effects of stimulation on blood flow and cognitive functioning separately, without the confound of medication, thus focusing exclusively on the effects of stimulation.
Materials and Methods
Participants
Twenty-nine individuals with PD and previously implanted bilateral STN stimulators were studied. Each met the diagnostic criteria for clinically definite PD (Racette, Rundle, Parsian, & Perlmutter, 1999). Exclusionary criteria included a history of neurological events or diagnoses other than PD, or dementia on clinical exam prior to surgery. The surgical implantation of stimulators (Medtronic model 3389 DBS leads) targeted STN with a technique that combines conventional stereotactic planning using formulas with reference to the anterior-posterior commissural line, visual targeting on T2 weighted magnetic resonance imaging (MRI), frame-based targeting using computerized methods (Medtronic STEALTH STATION, Framelink IV) and microelectrode recording (Tabbal et al., 2007). The degree of subsequent clinical benefit achieved by stimulation, as measured by change in UPDRS motor subscore 3 (mean improvement in total UPDRS motor scores was 52%, (SD = 14); paired t-test OFF versus ON, t(22)= 9.8, p < .001), is comparable to other centers. Participants had to be at least 2 months post-STN stimulator implantation to allow time for programming to achieve optimal clinical benefit for each individual. All participants except 3 were taking levodopa/carbidopa daily and 19 were taking other PD medications (e.g. amantadine, pergolide, pramipexole, or entacapone). All participants except two were right handed. This study was approved by the Institutional Review Board and the Radioactive Drug Research Committee at Washington University School of Medicine and all participants gave informed consent.
Data from the 29 PD participants who had adequate PET scans were examined. However, one participant was excluded for being an outlier (>2.5 SDs from the mean) on blood flow change in the ACC region, and 4 participants were excluded for having invalid GNG data due to tremor. On average, the remaining 24 participants with valid PET and cognitive data (10 female, 14 male) were 61.7 years old (SD = 9.2), had been diagnosed with PD for 12.8 years (SD = 4.7) and were tested 8.7 months (SD = 5.9) following STN stimulator implantation.
Overview of protocol
Participants were assessed on two consecutive days. On each study day, participants refrained from taking any PD medications for at least 12 hours prior to testing and were tested with both stimulators off (OFF condition) and with both stimulators on (ON condition). Order of stimulation condition was counterbalanced across participants and both participants and examiners were blind to condition. On the first study day participants had PET scans with STN DBS either ON or OFF and on the second day had cognitive testing and UPDRS motor ratings under the same STN DBS conditions.
PET Scans
PET scans were performed at least 42 minutes after change of the stimulator settings. Participants were scanned on the Siemens/CTI ECAT EXACT HR 47 tomograph (Wienhard et al., 1994) in 2D acquisition mode with a 15 cm axial field of view, 3.125 mm center to center slice separation and simultaneous collection of 47 slices. A 20 gauge plastic catheter was placed in an antecubital vein for [15O]-water injection. The participant was positioned in the PET scanner using cross laser lines and a Polyform mask. The mask was marked on the participant’s face to detect any change in the head position relative to the mask. Attenuation was measured using three rotating rod sources of 68Ge/68Ga. During each scan lights were dimmed and the room was quiet while participants kept their eyes closed. About 50 mCi of [15O]-water was injected intravenously as a bolus followed by two minutes of data acquisition. Each participant had as many as six separate PET scans in each study block. The scans were 14 minutes apart to permit adequate radioactive decay. After the first block, the participant was removed from the scanner to change settings. A second attenuation scan and a second set of six PET scans were done at least 42 minutes after the settings change.
The entire study was recorded with two video cameras; one camera recorded the head and the other recorded the body during the PET scans. Videos were reviewed to exclude possible movement during data acquisition. In addition, surface EMG electrodes over bilateral biceps, wrist flexors, quads and gastroc muscles were used to detect any muscle activation without visible movement. EMG signals were amplified at a gain of 2000 and filtered on line with a band pass of 10Hz–1000 kHz. The EMG signals were monitored on line and stored on computer using a CED micro 1401 interface (Cambridge Electronic Design). Codes were inserted into the data stream to coincide with the onset and offset of each scan. Any observed movement, loud noise, etc was remarked with a separate code.
Cognitive Testing
Spatial Delayed Response (SDR) Task
The SDR task is an experimentally derived working memory task (Hershey, Craft, Glauser, & Hale, 1998) that has been closely linked to lateral prefrontal cortex functioning in animals and humans (Funahashi, Bruce, & Goldman-Rakic, 1989; Funahashi, Bruce, & Goldman-Rakic, 1993; Funahashi, Chafee, & Goldman-Rakic, 1993; Goldman-Rakic, Funahashi, & Bruce, 1990; Luciana, Depue, Arbisi, & Leon, 1992). A central fixation cross appeared on a computer screen placed approximately 40 cm away from the participant. While fixated, either one or two cues (each 1 cm in diameter) appeared for 150 msec in any of 32 possible unmarked locations at an 11.5 cm radius from the central fixation. A delay period (5 or 15 sec) was then imposed. During the delay, participants performed a continuous performance task (CPT) in which a series of geometric shapes (triangle, square and diamond) appeared in place of the fixation cross (1000 msec duration, 750–1250 msec inter-trial interval). Participants pressed the spacebar whenever the diamond shape appeared. After the delay, the fixation cue returned, and participants pointed on the computer screen where they remembered seeing the cue(s). Responses were measured in X and Y coordinates and compared to the actual location of the cue. Delay trials and trials with no mnemonic load (cue-present trials) were presented in random order. On the cue-present trials the cue (dot) was present during the response phase. This set of trials gave an indication of participants’ pointing accuracy. Mean error in mm (distance between recall and actual target) was calculated for each participant for each type of trial. There were either one or two cues to be remembered on each trial. In the two-cue condition, both locations were presented simultaneously, and in the recall phase, participants pointed to both locations, in any order desired. Forty experimental trials were presented, 20 with only one cue presented and 20 with two cues presented. Trials were blocked by number of cues and the order of blocks was counterbalanced across participants. Participants performed 4 cue-present trials and 8 test trials per delay (i.e., 16 cue-absent trials) for each block.
Go-No-Go (GNG) Task
The GNG task assessed the ability to inhibit a prepotent response under conditions of low or high prepotent response strength (Barch et al., 2001; Braver et al., 2001; Casey et al., 1997), and requires active cognitive control processes such as conflict monitoring. This task involved monitoring a visual display while single uppercase letters were presented one at a time interspersed with the number “5” (250 msec duration, 1000 msec intertrial interval). In this task, participants were instructed to push a target response button at the occurrence of every letter but to withhold a response when the number “5” was presented. Target frequency (percent of trials where a button press was required, e.g. letters) was manipulated in a blocked fashion. There were two levels of target frequency (medium = 50%; high = 83%). The high target frequency block is designed to produce a strong prepotent response (e.g. press the button) so is more challenging for response inhibition skills. One block at each frequency level was performed with the order randomly determined for each participant. Each block contained 150 trials. Reaction times and accuracy rates were recorded.
Analyses
PET Scans
PET emission scans were reconstructed using filtered back projection and measured attenuation. Only the initial 40 seconds of the data after the arrival of the radioactive water in the brain were analyzed for each scan. Images were smoothed with a three dimensional Gaussian filter to a final resolution of 16 mm full width at half maximum. All images were coregistered to the initial emission image (Woods, Cherry, & Mazziota, 1992). The two transmission images from each participant were coregistered to each other and averaged. This average attenuation image was resliced to match each emission image and new attenuation corrections were forward projected. All emission scans were reconstructed a final time using these coregistered, averaged attenuation corrections. The new PET images were coregistered and resliced to a standard mean blood flow image in Talairach atlas (Talairach & Tournoux, 1988) space with 12-parameter fit. Individual images were normalized using mean whole brain counts and masked to include only the voxels in common among all scans. Scans were excluded from further analyses if the patient had tremor, other movements or sustained substantial EMG activity above background noise within the 40 seconds of data acquisition. Participants’ data were retained for analysis if they had at least one usable scan per condition.
Based on the functional neuroimaging evidence that the DLPFC is involved in working memory processes and that the ACC and rIFC are involved in response inhibition, these regions of interest (ROIs) were specifically chosen. The ROIs were defined on the basis of previous fMRI results with similar versions of the SDR (Leung, Gore, & Goldman-Rakic, 2002) and GNG (Braver et al., 2001) tasks. A 10.4 mm diameter (equivalent to the width of five voxels) sphere was placed on coordinates for left and right DLPFC (Talairach coordinates of −34, 44, 27 and 34, 44, 27, respectively; (Leung et al., 2002)) a midline anterior cingulate cortex region (Talairach coordinates of 3, 19, 35; (Braver et al., 2001)), and the right IFC (Talairach coordinates of 41, 16, 19 (Konishi et al., 1999)). See Figure 1 for illustration of the location of these coordinates. Mean blood flow within each sphere was obtained for each participant’s OFF and ON average blood flow image, averaging across left and right DLPFC. In addition, as a “control” region, we also extracted the mean blood flow in the SMA for each participant’s OFF and ON average blood flow image. Percent change in blood flow from OFF to ON conditions was calculated as the dependent measure.
Figure 1.
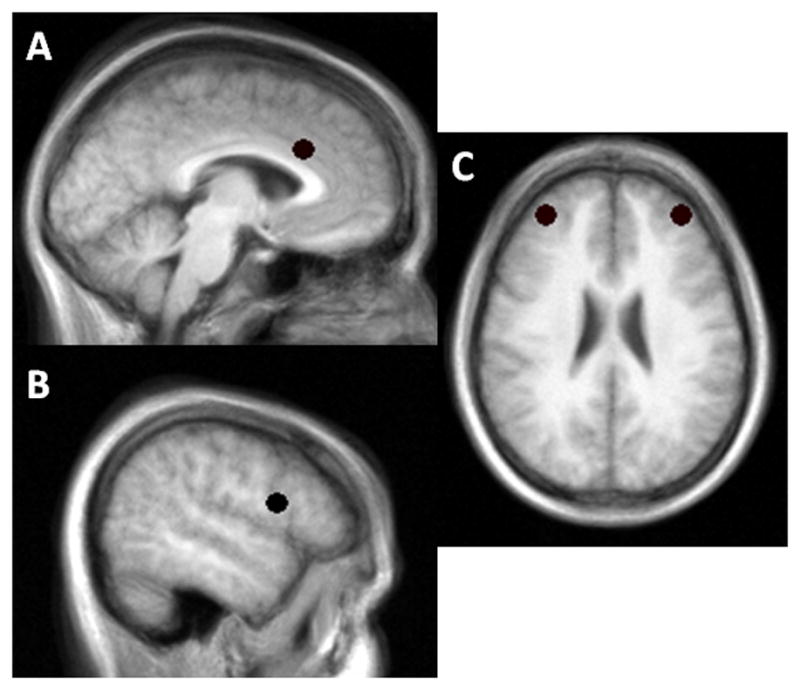
Locations of the (A) anterior cingulate cortex (ACC), (B) right inferior frontal cortex (rIFC), and (C) dorsolateral prefrontal cortex (DLPFC) regions of interest. A 10.4mm sphere was placed on these locations.
Additional ROIs were chosen for exploratory analyses based on recent meta-analyses of responses to the GNG task (Nee et al., 2007) and working memory tasks (Wager et al., 2003). These meta-analyses were chosen based on their focus on tasks similar to ours (e.g. the GNG task; Nee et al., 2007) and use of healthy adults (Nee et al., 2007; Wager & Smith 2003) rather than a specific clinical population (e.g., schizophrenia; c.f., Van Snellenberg, Torres, & Thornton, 2006). Similar to the a priori ROIs, a 10.4 mm diameter sphere was placed on the coordinates provided in these meta-analyses (see Table 1 & 2; coordinates were originally reported in MNI space, which were converted to Talairach atlas space using M. Brett’s mni2tal program; http://www.mrc-cbu.cam.ac.uk/Imaging/). Mean blood flow within each sphere was obtained for each participant’s OFF and ON average blood flow image; percent change in blood flow from OFF to ON conditions was calculated as the dependent measure. Due to the exploratory nature of these ROIs, they were analyzed in the same manner as the a priori ROIs (see below) and without correction for multiple comparisons.
Table 1.
Exploratory ROIs based on Nee et al., (2007) meta-analysis of the GNG task.
| Region | BA | X | Y | Z |
|---|---|---|---|---|
| Right DLPFC/IFC | 9/46/13/45 | 42 | 22 | 21 |
| Left DLPFC | 9/46 | −40 | 33 | 30 |
| Right angular gyrus | 39/40 | 42 | −60 | 34 |
| ACC | 6/32 | 0 | 10 | 49 |
| Left middle frontal gyrus | 10 | −36 | 38 | 17 |
| Left ACC | 32/8 | −2 | 27 | 37 |
| Left DLPFC | 9 | −44 | 11 | 34 |
| Right inferior occipital gyrus | 19/18 | 38 | −82 | −4 |
| Right middle occipital gyrus | 18/19 | 32 | −74 | −5 |
Note. Coordinates reported in Talairach space. BA = Broadmann area; DLPFC = dorsolateral prefrontal cortex; IFC = inferior frontal cortex; ACC = anterior cingulate cortex.
Table 2.
Exploratory ROIs based on Wager & Smith (2003) meta-analysis of working memory.
| Region | BA | X | Y | Z |
|---|---|---|---|---|
| Left IFC | 46 | −33 | 32 | 9 |
| Left DLPFC | 6 | −43 | 4 | 34 |
| Left parietal cortex | 39 | −31 | −57 | 38 |
| Right IFC | 46 | 33 | 31 | 10 |
| Right Cerebellum | 37 | 32 | −48 | −14 |
| Left Cerebellum | 37 | −44 | −51 | −10 |
| Right parietal cortex | 7 | 28 | −54 | 40 |
| Left thalamus | −14 | −11 | 3 | |
| Dorsomedial PFC | 6 | −1 | 7 | 48 |
| Occipital Cortex | 18 | 4 | −78 | 8 |
| Right DLPFC | 6 | 38 | 0 | 30 |
Note: Coordinates reported in Talairach space. BA = Broadmann area; IFC = inferior frontal cortex; DLPFC = dorsolateral prefrontal cortex; ACC = anterior cingulate cortex; PFC = prefrontal cortex.
Effects of stimulation
To determine the effects of STN stimulation on blood flow and cognitive control, one sample t-tests were performed for change in blood flow (for the a priori and exploratory ROIs) and change in performance on the SDR and GNG tasks. To simplify analyses and thus reduce the number of correlations performed, correlational analyses focused on the more difficult conditions of both tasks previously found to be more sensitive to the effects of STN DBS (Hershey et al., 2004). For the SDR, this was the 2 cue condition; for the GNG, this was a discriminability measure (Pr; [target accuracy − (1 − nontarget accuracy)]) from the high demand condition. Of note, both of these measures are based on performance accuracy and are not dependent on motor speed, thus reducing the potential influence of motor symptoms (e.g., bradykinesia) on cognitive performance. Significance level was set at p < .05.
Cognitive and PET correlations
Percent change in SDR and GNG performance from bilateral OFF to bilateral ON conditions was calculated for each measure and correlated (Pearson r) with blood flow change in the a priori ROIs, DLPFC, ACC, rIFC, and SMA, as well as the exploratory ROIs. To determine the strength of these correlations, potential confounding variables were included as covariates in hierarchical linear regression models. For these models, change in task performance was the dependent variable, and age, disease severity (measured by off medication, off stimulation UPDRS score), and finally change in regional blood flow were entered in a hierarchical fashion. The unique relationship between blood flow and task performance change (R2 change), after effects of age and disease severity were removed, was tested for significance. Significance for all analyses was set at p < .05.
Results
Cognitive Performance
For the SDR task of working memory, there was a significant main effect of task difficulty (F(1,22) = 32.77, p <.001) but not a significant main effect of stimulation (p = .67) or interaction between task difficulty and stimulation (p = .84). Similarly, for the GNG task of response inhibition, there was a main effect of task difficulty (F(1,23) = 35.61, p <.001), but no significant effect of stimulation (p = .30) or interaction between task difficulty and stimulation condition (p = .13). See Table 3 for descriptive statistics of task performance. Based on the effects of task difficulty and previous evidence that the more difficult conditions of both of these tasks are most likely to be affected by stimulation (Hershey et al., 2004), subsequent analyses focused on the more difficult condition of each task.
Table 3.
Cognitive control performance across stimulation conditions (OFF v. ON).
| Stimulation Condition
|
||
|---|---|---|
| Bilateral OFF | Bilateral ON | |
| SDR Task | ||
| One Cue Error | 18.06 (6.77) | 18.02 (5.02) |
| Two Cue Error | 23.05 (5.85) | 23.28 (5.19) |
| GNG Task | ||
| Medium Frequency RT | 525.31 (100.37) | 498.43 (67.86) |
| High Frequency RT | 486.09 (98.31) | 439.50 (80.87) |
| Medium Frequency Pr | 0.84 (0.17) | 0.84 (0.17) |
| High Frequency Pr | 0.75 (0.18) | 0.71 (0.20) |
Note. Values shown as mean (SD). SDR error in mm. Pr = discriminability index.
RT = response time in msec.
Effects of stimulation
As expected, stimulation significantly improved motor symptoms (UPDRS: t(23) = 8.76, p < .001). In contrast, there were no significant differences in blood flow in the selected regions or cognitive performance between the ON and OFF stimulation conditions. See Table 4 for descriptive statistics of PET blood flow values for the a priori ROIs. Changes in blood flow (DLPFC: −1.49 (SD = 9.55); ACC: 0.07 (SD = 2.94); rIFC: −0.62 (SD = 3.72); SMA: −0.56 (SD = 2.53)) and changes in cognitive performance (SDR: 4.92 (SD = 20.37); GNG: −5.32 (SD = 22.19)) were not significantly different from zero (all ps > .24). However, the trend was for impaired performance on both cognitive tasks with STN DBS ON.
Table 4.
Relationship between blood flow in a priori ROIs and cognitive performance.
| Region | OFF stim rCBF | ON stim rCBF | GNG | SDR |
|---|---|---|---|---|
| SMA | 1303.99 (69.02) | 1296.15 (68.58) | r = .02 | r = −.31 |
| rIFC | 1209.35 (76.83) | 1239.67 (77.34) | r = −.10 | r = −.05, |
| DLPFC | 923.48 (57.60) | 915.78 (66.90) | r = −.16 | r = .52 ** |
| ACC | 1367.93 (87.24) | 1367.45 (73.12) | r = −.44 * | r = .14 |
Note. SMA = supplemental motor area; rIFC = right inferior frontal cortex; DLPFC = dorsolateral prefrontal cortex; ACC = anterior cingulate cortex;
= p < .05;
= p < .01.
Cognitive and PET correlations
There were no significant relationships between stimulation-induced changes in regional blood flow; blood flow changes in the SMA was not related to blood flow changes in the DLPFC, ACC, or rIFC (all ps >.17) and there were no significant relationship among blood flow changes in the DLPFC, ACC, or rIFC (all ps > .10). Similarly, stimulation-induced changes on SDR performance did not correlate with changes in GNG performance (p = .30).
In support of our hypothesis, change in DLFPC blood flow correlated with change in SDR performance (r = .52, p = .009), but not GNG performance (r = −.16, p = .45). Also as predicted, change in ACC blood flow correlated with change in GNG performance (r = −.44, p = .03), but not SDR performance (r = .14, p = .52). Both of these significant relationships indicated that impaired performance was related to increases in blood flow with stimulation, whereas improved performance was related to decreases in blood flow with stimulation (See Figure 2 A & B). The correlations between blood flow changes in DLPFC and ACC and changes in cognitive performance remained significant even after covarying change in UPDRS motor score, age and disease severity (partial correlations, ps <.038). Furthermore, hierarchical linear regression analyses demonstrated that, after controlling for UPDRS motor score, age, and disease severity, stimulation-induced blood flow changes significantly predicted stimulation-induced cognitive performance changes (SDR and DLPFC, R2 = .24, F(1,20) = 6.6, p = .018; GNG and ACC change, R2 = .20, F(1,20) = 5.1, p = .035).
Figure 2.

Scatterplots showing the significant correlations between (A) change in DLPFC blood flow and change in WM, as indicated by SDR errors (larger numbers reflect decreased performance with stimulation), and (B) change in ACC blood flow and change in RI, as indicated by GNG discriminability (larger numbers reflect improved performance with stimulation). Both correlations indicate that stimulation-induced decreased cognitive control performance is associated with stimulation-induced increased blood flow responses.
Although our primary hypotheses were supported, our secondary analyses revealed that there was no relationship between stimulation-induced changes in rIFC and stimulation-induced changes in cognitive control performance (SDR: p = .81; GNG: p = .65). As anticipated, stimulation-induced changes in SMA blood flow were not correlated with stimulation-induced changes in cognitive performance (SDR: p = .14; GNG: p = .94).
Exploratory ROIs
Across both sets of exploratory ROIs (i.e., those from Nee et al., 2007 and those from Wager & Smith 2003), stimulation induced a significant blood flow change (t(23) = 2.32, p = .03) only in the left thalamus (Talairach coordinates of −14, −11, 3, from Wager & Smith, 2003). Change in blood flow was not significantly different from zero in any of the other ROIs (all ps > .11). Furthermore, there were limited relationships between stimulation induced blood flow changes for the exploratory ROIs and stimulation induced cognitive control performance. Specifically, stimulation-induced blood flow changes in the left DLPFC (Talairach coordinates of −40, 33, 30, from Nee et al., 2007) was significantly correlated with stimulation-induced changes in SDR performance (r = .53, p =.008) and there was a trend level relationship between stimulation induced rCBF changes in the left ACC (Talairach coordinates of −2, 27, 37, from Nee et al., 2007) and change in GNG performance (r(24) = −.38, p = .07). There was no significant relationship between cognitive performance and rCBF changes in any of the other ROIs (all ps > .16). Of note, the left DLPFC and left ACC exploratory ROIs were adjacent to, but not overlapping with, the a priori defined ROIs.
Discussion
Despite the beneficial effects of STN DBS on the motor symptoms of PD, the effects on cognition are highly variable. The present study demonstrates that STN DBS-induced change in WM performance is associated with change in regional blood flow in the DLPFC, while change in RI task performance is associated with change in regional blood flow in the ACC. These correlations were specific and as predicted. In fact, the exploratory ROI analyses provide converging evidence and further support the specificity of these relationships. The results are consistent with frontal-striatal circuitry and the neurophysiological effects of STN DBS as well as the functional role of these areas in cognitive control. These relationships were not due to participant characteristics such as age, motor symptom severity, or motor benefit from STN DBS. In addition, the results indicate an inverse relationship between regional blood flow and cognitive control as measured by both tasks; STN DBS-induced increases in regional blood flow were associated with decreased cognitive control, whereas STN DBS-induced decreases in regional blood flow were associated with increased cognitive control performance. However, the factor(s) contributing to the variability in responses to STN stimulation, which may mediate the relationship between blood flow changes and cognitive control, are yet to be determined.
The key finding of the present study is that the stimulation-induced change in cognitive control performance was inversely related to the stimulation-induced change in regional blood flow in the DLPFC and ACC. Importantly, the relationship between cognitive control and regional blood flow changes was not limited to just the degree of change, but also the direction. Participants with stimulation-induced decline in cognitive control performance demonstrated stimulation-induced increased blood flow in the relevant cortical regions whereas participants with improved cognitive control performance had reduced rCBF in these same regions (see Figure 2). The specific relationships between blood flow change in the DLPFC with WM and blood flow change in ACC with RI performance further support the notion that these areas are important for cognitive control (Braver et al., 2001; Leung et al., 2002).
Despite the evidence from other studies demonstrating that rIFC is involved in response inhibition, our exploratory analysis of DBS-induced blood flow responses in this area did not indicate any relationship with stimulation-induced changes in GNG performance. Similarly, stimulation induced blood flow changes in the majority of the exploratory ROIs from the meta-analyses were not related to stimulation-induced changes in cognitive performance. Several possible reasons may explain these negative finding. First, methodological differences may account for our seemingly discrepant findings. For example, the majority of the research demonstrating involvement of the rIFC in response inhibition has utilized the Stop Signal Task (c.f., Aron & Poldrack, 2006), which requires the inhibition of an already initiated response, whereas the GNG task in the present study requires the inhibition of a prepotent (but not yet initiated) response. In fact, there is even evidence for differences in cortical activation based on the specific GNG task that is used (Simmonds, Pekar, & Mostofsky, 2008). A second possibility may relate to individual or group differences. The participants in the current study were primarily older adults, who may rely on slightly different functional neuroanatomy for response inhibition and working memory (c.f., Jennings, van der Veen, & Meltzer, 2006; Nielson, Langenecker, & Garavan, 2002). Finally, and most likely, it is highly probable that the rIFC and other areas are involved in response inhibition and working memory, but that they do not mediate the stimulation-induced changes in cognitive performance. The DLPFC and ACC, however, are specific targets of frontal-striatal circuits (Alexander et al., 1990; Alexander et al., 1986; Middleton et al., 2000), demonstrate altered rCBF with STN stimulation (Sestini et al., 2002), and are also involved in WM and RI performance.
Several caveats regarding this study should be noted. Our main findings are based upon correlational analyses and do not prove causal relationships between the STN DBS-induced changes in blood flow and cognitive control performance. However, this type of analysis does provide meaningful information. If the STN DBS-induced behavioral change depends on functional modifications of basal ganglia-prefrontal circuits that can be measured by cortical blood flow changes, then these changes should be correlated. Our findings support this interpretation and are consistent with a potential causal relationship. Although we failed to confirm a significant STN DBS-induced impairment of cognitive control, these results fit with the high degree of variability in cognitive and blood flow responses to STN DBS across studies (Burn & Troster, 2004; Takeshita et al., 2005; Temel et al., 2005; Voon et al., 2006),. In this study, the mean change in cognitive response to STN stimulation was in the direction of impairment but did not reach statistical significance due to the high variability across participants. In fact, this variability across participants permitted us to identify significant correlations between changes in behavioral performance and blood flow response to STN DBS. The factors driving these differing individual responses have not yet been identified nor have their mechanisms of action been delineated, thus requiring further investigation.
A change in blood flow could reflect alterations in interneuronal activity within these regions (DLPFC or ACC), changes in input from distant pathways such as the basal ganglia-thalamo-cortical circuits, or both, since regional blood flow changes reflect neuronal activity in target synaptic fields. Therefore, measurements of stimulation-induced blood flow changes permit insight into possible underlying mechanisms (Hershey & Mink, 2006). Some have hypothesized that STN DBS forces “regularization” of irregular STN output leading to improved motor performance in people with PD (Vitek, 2002). Although regularization of STN output may improve motor function, a forced regular rate of firing may interfere with the phasic burst firing related to cognitive control processes (Funahashi et al., 1989; Kropotov & Etlinger, 1999; Schultz, 1997). Our findings support this idea. Stimulation-induced increased input or interneuronal activity in DLPFC or ACC could override the firing patterns that support optimal cognitive control functioning. Likewise, reduced input or interneuronal activity in these prefrontal regions could reflect decreased competition or noise thereby permitting firing patterns underlying cognitive function to operate more optimally. The crucial next step is to identify the factor(s) that determine the neurophysiological response to STN DBS as this may also mediate the cognitive response to STN stimulation.
It is possible that stimulation variables, such as the precise location of the active electrode contact, the extent of the field of stimulation (Morrison et al., 2004b; Smeding et al., 2007; Temel et al., 2006) or patient variables, such as degree of dopaminergic denervation (Foster, Black, Antenor-Dorsey, Perlmutter, & Hershey, 2007; Hershey et al., 2007) could modulate cognitive control as well as the direction and degree of change in associated prefrontal cortical blood flow. For example, without direct visual identification of electrode contacts within the brain, uncertainty remains regarding their precise location and the spatial extent of the effects of stimulation, both of which may contribute to STN DBS effects (Temel et al., 2005). The frequency, voltage, and amplitude of STN stimulation also could influence cortical functioning (Strafella et al., 2003; Temel et al., 2005). Future studies that incorporate the exact location of contacts as well as stimulation variables, including the degree and strength of current spread, may be useful in understanding the physiological characteristics of the anatomical pathways underlying the cognitive effects of stimulation.
Acknowledgments
Supported by: the Greater St. Louis Chapter of the American Parkinson Disease Association (APDA), NIH (NS41248; NS41509; DA07261; NS057105), APDA Advanced Center for PD Research at Washington University, and the Barnes-Jewish Hospital Foundation (Elliot Stein Family Fund and Jack Buck Fund for PD Research). We also thank an anonymous reviewer for suggesting the exploratory analyses.
Footnotes
Disclosure: Dr. Karimi received partial fellowship funding from Medtronic, Inc., the manufacturer of the implanted stimulators; no other authors have any conflicts of interest to disclose.
Publisher's Disclaimer: This is a PDF file of an unedited manuscript that has been accepted for publication. As a service to our customers we are providing this early version of the manuscript. The manuscript will undergo copyediting, typesetting, and review of the resulting proof before it is published in its final citable form. Please note that during the production process errors may be discovered which could affect the content, and all legal disclaimers that apply to the journal pertain.
Reference List
- Alexander GE, Crutcher M, DeLong M. Basal ganglia-thalamo-cortical circuits: Parallel substrates for motor, oculomotor, “prefrontal,” and “limbic” functions. Progress in Brain Research. 1990;85:119–146. [PubMed] [Google Scholar]
- Alexander GE, DeLong MR, Strick PL. Parallel organization of functionally segregated circuits linking basal ganglia and cortex. Annu Rev Neurosci. 1986;9:357–381. doi: 10.1146/annurev.ne.09.030186.002041. [DOI] [PubMed] [Google Scholar]
- Aron AR, Behrens TE, Smith S, Frank MJ, Poldrack RA. Triangulating a cognitive control network using diffusion-weighted magnetic resonance imaging (MRI) and functional MRI. Journal of Neuroscience. 2007;27:3743–3752. doi: 10.1523/JNEUROSCI.0519-07.2007. [DOI] [PMC free article] [PubMed] [Google Scholar]
- Aron AR, Poldrack RA. Cortical and subcortical contributions to Stop signal response inhibition: role of the subthalamic nucleus. Journal of Neuroscience. 2006;26:2424–2433. doi: 10.1523/JNEUROSCI.4682-05.2006. [DOI] [PMC free article] [PubMed] [Google Scholar]
- Aron AR, Robbins TW, Poldrack RA. Inhibition and the right inferior frontal cortex. Trends Cogn Sci. 2004;8:170–177. doi: 10.1016/j.tics.2004.02.010. [DOI] [PubMed] [Google Scholar]
- Barch DM, Braver TS, Akbudak E, Conturo TE, Ollinger JM, Synder AZ. Anterior cingulate cortex and response conflict: effects of response modality and processing domain. Cerebral Cortex. 2001;11:837–848. doi: 10.1093/cercor/11.9.837. [DOI] [PubMed] [Google Scholar]
- Baunez C, Humby T, Eagle DM, Ryan LJ, Dunnett SB, Robbins TW. Effects of STN lesions on simple vs choice reaction time tasks in the rat: preserved motor readiness, but impaired response selection. Eur J Neurosci. 2001;13:1609–1616. doi: 10.1046/j.0953-816x.2001.01521.x. [DOI] [PubMed] [Google Scholar]
- Baunez C, Nieoullon A, Amalric M. In a rat model of parkinsonism, lesions of the subthalamic nucleus reverse increases of reaction time but induce a dramatic premature responding deficit. Journal of Neuroscience. 1995;15:6531–6541. doi: 10.1523/JNEUROSCI.15-10-06531.1995. [DOI] [PMC free article] [PubMed] [Google Scholar]
- Baunez C, Robbins TW. Bilateral lesions of the subthalamic nucleus induce multiple deficits in an attentional task in rats. Eur J Neurosci. 1997;9:2086–2099. doi: 10.1111/j.1460-9568.1997.tb01376.x. [DOI] [PubMed] [Google Scholar]
- Botvinick M, Nystrom LE, Fissell K, Carter CS, Cohen JD. Conflict monitoring versus selection-for-action in anterior cingulate cortex. Nature. 1999;402:179–181. doi: 10.1038/46035. [DOI] [PubMed] [Google Scholar]
- Braver TS, Barch DM, Gray JR, Molfese DL, Snyder AZ. Anterior cingulate cortex and response conflict: effects of frequency, inhibition, and errors. Cerebral Cortex. 2001;11:825–836. doi: 10.1093/cercor/11.9.825. [DOI] [PubMed] [Google Scholar]
- Braver TS, Cohen JD, Nystrom LE, Jonides J, Smith EE, Noll DC. A parametric study of prefrontal cortex involvement in human working memory. Neuroimage. 1997;5:49–62. doi: 10.1006/nimg.1996.0247. [DOI] [PubMed] [Google Scholar]
- Burn DJ, Troster AI. Neuropsychiatric complications of medical and surgical therapies for Parkinson’s disease. Journal of Geriatric Psychiatry and Neurology. 2004;17:172–180. doi: 10.1177/0891988704267466. [DOI] [PubMed] [Google Scholar]
- Casey BJ, Trainor RJ, Orendi JL, Schubert AB, Nystrom LE, Giedd JN, et al. A developmental functional MRI study of prefrontal activation during performance of a Go-No-Go task. Journal of Cognitive Neuroscience. 1997;9:835–847. doi: 10.1162/jocn.1997.9.6.835. [DOI] [PubMed] [Google Scholar]
- Chudasama Y, Baunez C, Robbins TW. Functional disconnection of the medial prefrontal cortex and subthalamic nucleus in attentional performance: evidence for corticosubthalamic interaction. Journal of Neuroscience. 2003;23:5477–5485. doi: 10.1523/JNEUROSCI.23-13-05477.2003. [DOI] [PMC free article] [PubMed] [Google Scholar]
- Cools R. Dopaminergic modulation of cognitive function-implications for L-DOPA treatment in Parkinson’s disease. Neurosci Biobehav Rev. 2006;30:1–23. doi: 10.1016/j.neubiorev.2005.03.024. [DOI] [PubMed] [Google Scholar]
- Dujardin K, Defebvre L, Krystkowiak P, Blond S, Destee A. Influence of chronic bilateral stimulation of the subthalamic nucleus on cognitive function in Parkinson’s disease. J Neurol. 2001;248:603–611. doi: 10.1007/s004150170139. [DOI] [PubMed] [Google Scholar]
- Foster ER, Black KJ, Antenor-Dorsey JA, Perlmutter JS, Hershey T. Motor asymmetry and substantia nigra volume are related to spatial delayed response performance in Parkinson disease. Brain Cogn. 2007 doi: 10.1016/j.bandc.2007.10.002. [DOI] [PMC free article] [PubMed] [Google Scholar]
- Funahashi S, Bruce CJ, Goldman-Rakic PS. Mnemonic coding of visual space in the monkey’s dorsolateral prefrontal cortex. Journal of Neurophysiology. 1989;61:331–349. doi: 10.1152/jn.1989.61.2.331. [DOI] [PubMed] [Google Scholar]
- Funahashi S, Bruce CJ, Goldman-Rakic PS. Dorsolateral prefrontal lesions and oculomotor delayed-response performance: evidence for mnemonic “scotomas”. Journal of Neuroscience. 1993;13:1479–1497. doi: 10.1523/JNEUROSCI.13-04-01479.1993. [DOI] [PMC free article] [PubMed] [Google Scholar]
- Funahashi S, Chafee MV, Goldman-Rakic PS. Prefrontal neuronal activity in rhesus monkeys performing a delayed anti-saccade task. Nature. 1993;365:753–756. doi: 10.1038/365753a0. [DOI] [PubMed] [Google Scholar]
- Funkiewiez A, Ardouin C, Krack P, Dubois B, Benabid AL, Pollak P. Effects of levodopa and STN stimulation on decision making in Parkinson’s disease. Movement Disorders. 2004;19:S402–403. [Google Scholar]
- Goldman-Rakic PS. Cellular and circuit basis of working memory in prefrontal cortex of nonhuman primates. Progress in Brain Research. 1990;85:325–335. doi: 10.1016/s0079-6123(08)62688-6. [DOI] [PubMed] [Google Scholar]
- Goldman-Rakic PS, Funahashi S, Bruce CJ. Neocortical memory circuits. Cold Spring Harbor Symposia on Quantitative Biology. 1990;55:1025–1038. doi: 10.1101/sqb.1990.055.01.097. [DOI] [PubMed] [Google Scholar]
- Green J, McDonald WM, Vitek JL, Evatt M, Freeman A, Haber M, et al. Cognitive impairments in advanced PD without dementia. Neurology. 2002;59:1320–1324. doi: 10.1212/01.wnl.0000031426.21683.e2. [DOI] [PubMed] [Google Scholar]
- Halbig TD, Gruber D, Kopp UA, Scherer P, Schneider GH, Trottenberg T, et al. Subthalamic stimulation differentially modulates declarative and nondeclarative memory. Neuroreport. 2004;15:539–543. doi: 10.1097/00001756-200403010-00031. [DOI] [PubMed] [Google Scholar]
- Hershey T, Craft S, Glauser TA, Hale S. Short-term and long-term memory in early temporal lobe dysfunction. Neuropsychology. 1998;12:52–64. doi: 10.1037//0894-4105.12.1.52. [DOI] [PubMed] [Google Scholar]
- Hershey T, Mink JW. Using functional neuroimaging to study the brain’s response to deep brain stimulation. Neurology. 2006;66:1142–1143. doi: 10.1212/01.wnl.0000216425.34178.dd. [DOI] [PubMed] [Google Scholar]
- Hershey T, Revilla F, Wernle A, Schneider-Gibson P, Dowling J, Perlmutter JS. Stimulation of STN impairs aspects of cognitive control in PD. Neurology. 2004;62:1110–1114. doi: 10.1212/01.wnl.0000118202.19098.10. [DOI] [PubMed] [Google Scholar]
- Hershey T, Revilla FJ, Wernle A, McGee-Minnich L, Antenor JV, Videen TO, et al. Cortical and subcortical blood flow effects of subthalamic nucleus stimulation in PD. Neurology. 2003;61:816–821. doi: 10.1212/01.wnl.0000083991.81859.73. [DOI] [PubMed] [Google Scholar]
- Hershey T, Wu J, Weaver PM, Perantie DC, Karimi M, Tabbal SD, et al. Unilateral vs. bilateral STN DBS effects on working memory and motor function in Parkinson disease. Experimental Neurology. 2007 doi: 10.1016/j.expneurol.2007.11.011. [DOI] [PMC free article] [PubMed] [Google Scholar]
- Hilker R, Voges J, Weisenbach S, Kalbe E, Burghaus L, Ghaemi M, et al. Subthalamic nucleus stimulation restores glucose metabolism in associative and limbic cortices and in cerebellum: evidence from a FDG-PET study in advanced Parkinson’s disease. J Cereb Blood Flow Metab. 2004;24:7–16. doi: 10.1097/01.WCB.0000092831.44769.09. [DOI] [PubMed] [Google Scholar]
- Jahanshahi M, Ardouin CM, Brown RG, Rothwell JC, Obeso J, Albanese A, et al. The impact of deep brain stimulation on executive function in Parkinson’s disease. Brain. 2000;123(Pt 6):1142–1154. doi: 10.1093/brain/123.6.1142. [DOI] [PubMed] [Google Scholar]
- Jennings JR, van der Veen FM, Meltzer CC. Verbal and spatial working memory in older individuals: A positron emission tomography study. Brain Research. 2006;1092:177–189. doi: 10.1016/j.brainres.2006.03.077. [DOI] [PubMed] [Google Scholar]
- Konishi S, Nakajima K, Uchida I, Kikyo H, Kameyama M, Miyashita Y. Common inhibitory mechanism in human inferior prefrontal cortex revealed by event-related functional MRI. Brain. 1999;122(Pt 5):981–991. doi: 10.1093/brain/122.5.981. [DOI] [PubMed] [Google Scholar]
- Kropotov JD, Etlinger SC. Selection of actions in the basal ganglia-thalamocortical circuits: review and model. Int J Psychophysiol. 1999;31:197–217. doi: 10.1016/s0167-8760(98)00051-8. [DOI] [PubMed] [Google Scholar]
- Leung HC, Gore JC, Goldman-Rakic PS. Sustained mnemonic response in the human middle frontal gyrus during on-line storage of spatial memoranda. J Cogn Neurosci. 2002;14:659–671. doi: 10.1162/08989290260045882. [DOI] [PubMed] [Google Scholar]
- Limousin P, Pollak P, Benazzouz A, Hoffmann D, Broussolle E, Perret JE, et al. Bilateral subthalamic nucleus stimulation for severe Parkinson’s disease. Movement Disorders. 1995;10:672–674. doi: 10.1002/mds.870100523. [DOI] [PubMed] [Google Scholar]
- Luciana M, Depue RA, Arbisi P, Leon A. Facilitation of working memory in humans by a D2 dopamine receptor agonist. Journal of Cognitive Neuroscience. 1992;4:58–68. doi: 10.1162/jocn.1992.4.1.58. [DOI] [PubMed] [Google Scholar]
- Menon V, Adleman NE, White CD, Glover GH, Reiss AL. Error-related brain activation during a Go/NoGo response inhibition task. Human Brain Mapping. 2001;12:131–143. doi: 10.1002/1097-0193(200103)12:3<131::AID-HBM1010>3.0.CO;2-C. [DOI] [PMC free article] [PubMed] [Google Scholar]
- Middleton FA, Strick PL. Basal ganglia and cerebellar loops: motor and cognitive circuits. Brain Research Reviews. 2000;31:236–250. doi: 10.1016/s0165-0173(99)00040-5. [DOI] [PubMed] [Google Scholar]
- Montgomery EB, Jr, Baker KB. Mechanisms of deep brain stimulation and future technical developments. Neurol Res. 2000;22:259–266. doi: 10.1080/01616412.2000.11740668. [DOI] [PubMed] [Google Scholar]
- Morrison CE, Borod JC, Perrine K, Beric A, Brin MF, Rezai A, et al. Neuropsychological functioning following bilateral subthalamic nucleus stimulation in Parkinson’s disease. Arch Clin Neuropsychol. 2004a;19:165–181. doi: 10.1016/S0887-6177(03)00004-0. [DOI] [PubMed] [Google Scholar]
- Morrison CE, Borod JC, Perrine K, Beric A, Brin MF, Rezai A, et al. Neuropsychological functioning following bilateral subthalamic nucleus stimulation in Parkinson’s disease. Arch Clin Neuropsychol. 2004b;19:165–181. doi: 10.1016/S0887-6177(03)00004-0. [DOI] [PubMed] [Google Scholar]
- Nakano K, Kayahara T, Tsutsumi T, Ushiro H. Neural circuits and functional organization of the striatum. J Neurol. 2000;247(Suppl 5):V1–15. doi: 10.1007/pl00007778. [DOI] [PubMed] [Google Scholar]
- Nee DE, Wager TD, Jonides J. Interference resolution: Insights from a meta-analysis of neuroimaging tasks. Cognitive Affective & Behavioral Neuroscience. 2007;7:1–17. doi: 10.3758/cabn.7.1.1. [DOI] [PubMed] [Google Scholar]
- Nielson KA, Langenecker SA, Garavan H. Differences in the functional neuroanatomy of inhibitory control across the adult life span. Psychol Aging. 2002;17:56–71. doi: 10.1037//0882-7974.17.1.56. [DOI] [PubMed] [Google Scholar]
- Perlmutter JS, Mink JW. Deep brain stimulation. Annu Rev Neurosci. 2006;29:229–257. doi: 10.1146/annurev.neuro.29.051605.112824. [DOI] [PMC free article] [PubMed] [Google Scholar]
- Pillon B, Ardouin C, Damier P, Krack P, Houeto JL, Klinger H, et al. Bilateral DBS improves psychomotor speed and working memory in PD 2000a [Google Scholar]
- Pillon B, Ardouin C, Damier P, Krack P, Houeto JL, Klinger H, et al. Neuropsychological changes between “off” and “on” STN or GPi stimulation in Parkinson’s disease. Neurology. 2000b;55:411–418. doi: 10.1212/wnl.55.3.411. [DOI] [PubMed] [Google Scholar]
- Racette BA, Rundle M, Parsian A, Perlmutter JS. Evaluation of a screening questionnaire for genetic studies of Parkinson’s disease. American Journal of Medical Genetics. 1999;88:539–543. [PubMed] [Google Scholar]
- Saint-Cyr JA, Trepanier LL, Kumar R, Lozano AM, Lang AE. Neuropsychological consequences of chronic bilateral stimulation of the subthalamic nucleus in Parkinson’s disease. Brain. 2000;123(Pt 10):2091–2108. doi: 10.1093/brain/123.10.2091. [DOI] [PubMed] [Google Scholar]
- Schrag A, Jahanshahi M, Quinn N. What contributes to quality of life in patients with Parkinson’s disease? Journal of Neurology, Neurosurgery, and Psychiatry. 2000;69:308–312. doi: 10.1136/jnnp.69.3.308. [DOI] [PMC free article] [PubMed] [Google Scholar]
- Schroeder U, Kuehler A, Haslinger B, Erhard P, Fogel W, Tronnier VM, et al. Subthalamic nucleus stimulation affects striato-anterior cingulate cortex circuit in a response conflict task: a PET study. Brain. 2002;125:1995–2004. doi: 10.1093/brain/awf199. [DOI] [PubMed] [Google Scholar]
- Schroeder U, Kuehler A, Lange KW, Haslinger B, Tronnier VM, Krause M, et al. Subthalamic nucleus stimulation affects a frontotemporal network: a PET study. Annals of Neurology. 2003;54:445–450. doi: 10.1002/ana.10683. [DOI] [PubMed] [Google Scholar]
- Schultz W. Dopamine neurons and their role in reward mechanisms. Current Opinion in Neurobiology. 1997;7:191–197. doi: 10.1016/s0959-4388(97)80007-4. [DOI] [PubMed] [Google Scholar]
- Sestini S, Scotto di Luzio A, Ammannati F, De Cristofaro MTR, Passeri A, Martini S, et al. Changes in regional cerebral blood flow caused by deep-brain stimulation of the subthalamic nucleus in Parkinson’s disease. Journal of Nuclear Medicine. 2002;43:725–732. [PubMed] [Google Scholar]
- Simmonds DJ, Pekar JJ, Mostofsky SH. Meta-analysis of Go/No-go tasks demonstrating that fMRI activation associated with response inhibition is task-dependent. Neuropsychologia. 2008;46:224–232. doi: 10.1016/j.neuropsychologia.2007.07.015. [DOI] [PMC free article] [PubMed] [Google Scholar]
- Smeding HM, van den MP, Esselink RA, Schmand B, Schuurman PR, Speelman JD. Reversible cognitive decline after DBS STN in PD and displacement of electrodes. Neurology. 2007;68:1235–1236. doi: 10.1212/01.wnl.0000259067.68691.87. [DOI] [PubMed] [Google Scholar]
- Strafella AP, Dagher A, Sadikot AF. Cerebral blood flow changes induced by subthalamic stimulation in Parkinson’s disease. Neurology. 2003;60:1039–1042. doi: 10.1212/01.wnl.0000052691.48076.92. [DOI] [PubMed] [Google Scholar]
- Takeshita S, Kurisu K, Trop L, Arita K, Akimitsu T, Verhoeff NP. Effect of subthalamic stimulation on mood state in Parkinson’s disease: evaluation of previous facts and problems. Neurosurg Rev. 2005;28:179–186. doi: 10.1007/s10143-005-0387-4. [DOI] [PubMed] [Google Scholar]
- Talairach J, Tournoux P. Co-planar stereotaxic atlas of the human brain. New York: Theime Verlag; 1988. [Google Scholar]
- Temel Y, Blokland A, Steinbusch HW, Visser-Vandewalle V. The functional role of the subthalamic nucleus in cognitive and limbic circuits. Prog Neurobiol. 2005;76:393–413. doi: 10.1016/j.pneurobio.2005.09.005. [DOI] [PubMed] [Google Scholar]
- Temel Y, Kessels A, Tan S, Topdag A, Boon P, Visser-Vandewalle V. Behavioural changes after bilateral subthalamic stimulation in advanced Parkinson disease: a systematic review. Parkinsonism Relat Disord. 2006;12:265–272. doi: 10.1016/j.parkreldis.2006.01.004. [DOI] [PubMed] [Google Scholar]
- Trepanier LL, Kumar R, Lozano AM, Lang AE, Saint-Cyr JA. Neuropsychological outcome of GPi pallidotomy and GPi or STN deep brain stimulation in Parkinson’s disease. Brain and Cognition. 2000;42:324–347. doi: 10.1006/brcg.1999.1108. [DOI] [PubMed] [Google Scholar]
- Trost M, Su S, Su P, Yen RF, Tseng HM, Barnes A, et al. Network modulation by the subthalamic nucleus in the treatment of Parkinson’s disease. Neuroimage. 2006;31:301–307. doi: 10.1016/j.neuroimage.2005.12.024. [DOI] [PMC free article] [PubMed] [Google Scholar]
- van den Wildenberg WP, van Boxtel GJ, van der Molen MW, Bosch DA, Speelman JD, Brunia CH. Stimulation of the subthalamic region facilitates the selection and inhibition of motor responses in Parkinson’s disease. J Cogn Neurosci. 2006;18:626–636. doi: 10.1162/jocn.2006.18.4.626. [DOI] [PubMed] [Google Scholar]
- Van Snellenberg JX, Torres IJ, Thornton AE. Functional neuroimaging of working memory in schizophrenia: Task performance as a moderating variable. Neuropsychology. 2006;20:497–510. doi: 10.1037/0894-4105.20.5.497. [DOI] [PubMed] [Google Scholar]
- Vitek JL. Mechanisms of deep brain stimulation: Excitation or inhibition. Movement Disorders. 2002;17:S69–S72. doi: 10.1002/mds.10144. [DOI] [PubMed] [Google Scholar]
- Voon V, Kubu C, Krack P, Houeto JL, Troster AI. Deep brain stimulation: Neuropsychological and neuropsychiatric issues. Movement Disorders. 2006;21:S305–S327. doi: 10.1002/mds.20963. [DOI] [PubMed] [Google Scholar]
- Wager TD, Smith EE. Neuroimaging studies of working memory: a meta-analysis. Cogn Affect Behav Neurosci. 2003;3:255–274. doi: 10.3758/cabn.3.4.255. [DOI] [PubMed] [Google Scholar]
- Wager TD, Sylvester CYC, Lacey SC, Nee DE, Franklin M, Jonides J. Common and unique components of response inhibition revealed by fMRI. Neuroimage. 2005;27:323–340. doi: 10.1016/j.neuroimage.2005.01.054. [DOI] [PubMed] [Google Scholar]
- Weintraub D, Moberg PJ, Duda JE, Katz IR, Stern MB. Effect of psychiatric and other nonmotor symptoms on disability in Parkinson’s disease. J Am Geriatr Soc. 2004;52:784–788. doi: 10.1111/j.1532-5415.2004.52219.x. [DOI] [PubMed] [Google Scholar]
- Wienhard K, Dalhbom M, Eriksson L, Michel C, Bruckbauer T, Pietrzyk U, et al. The ECAT EXACT HR: performance of a new high resolution positron scanner. Journal of Computer Assisted Tomography. 1994;18:110–118. [PubMed] [Google Scholar]
- Witt K, Pulkowski U, Herzog J, Lorenz D, Hamel W, Deuschl G, et al. Deep brain stimulation of the subthalamic nucleus improves cognitive flexibility but impairs response inhibition in Parkinson disease. Archives of Neurology. 2004;61:697–700. doi: 10.1001/archneur.61.5.697. [DOI] [PubMed] [Google Scholar]
- Woods RP, Cherry SR, Mazziota JC. Rapid automated algorithm for aligning and reslicing PET images. Journal of Computer Assisted Tomography. 1992;16:620–633. doi: 10.1097/00004728-199207000-00024. [DOI] [PubMed] [Google Scholar]