

Abstract
Metaphase nucleolar organizer regions (NORs), one of four types of chromosome bands, are located on human acrocentric chromosomes. They contain r-chromatin, i.e., ribosomal genes complexed with proteins such as upstream binding factor and RNA polymerase I, which are argyrophilic NOR proteins. Immunocytochemical and cytochemical labelings of these proteins were used to reveal r-chromatin in situ and to investigate its spatial organization within NORs by confocal microscopy and by electron tomography. For each labeling, confocal microscopy revealed small and large double-spotted NORs and crescent-shaped NORs. Their internal three-dimensional (3D) organization was studied by using electron tomography on specifically silver-stained NORs. The 3D reconstructions allow us to conclude that the argyrophilic NOR proteins are grouped as a fiber of 60–80 nm in diameter that constitutes either one part of a turn or two or three turns of a helix within small and large double-spotted NORs, respectively. Within crescent-shaped NORs, virtual slices reveal that the fiber constitutes several longitudinally twisted loops, grouped as two helical 250- to 300-nm coils, each centered on a nonargyrophilic axis of condensed chromatin. We propose a model of the 3D organization of r-chromatin within elongated NORs, in which loops are twisted and bent to constitute one basic chromatid coil.
INTRODUCTION
The volumic organization of metaphase chromosomes is still enigmatic due to the overlap of four levels of chromatin packaging: the nucleosomes (11 nm in diameter), the nucleosome fiber (30 nm solenoidal structure), the loops (90 nm long, i.e., 75 kb long), and the coils (250 nm wide with an external diameter of 700 nm) (Manuelidis, 1990; Sumner, 1992; Saitoh and Laemmli, 1994; Woodcock and Horowitz, 1995). None of these structures can be detected in native metaphase chromosomes, either after single DNA staining in photonic microscopy (Saitoh and Laemmli, 1994) or in cryoelectron microscopy (McDowall et al., 1986). In contrast, some subregions appear when chromosomes are either isolated in hypotonic conditions or unfolded by partial extraction of histones. Indeed, it is in this manner that ultrastructural investigations have revealed different levels of chromatin three-dimensional (3D) organization. No consensual model has emerged from these studies and four models of metaphasic chromosome organization have been currently proposed: 1) the random fiber folding (Dupraw, 1966), 2) the helical coiling (Sedat and Manuelidis, 1977; Manuelidis, 1990), 3) the scaffold and loops arrangement (Paulson and Laemmli, 1977; Marsden and Laemmli, 1979; Sikorav and Jannink, 1994) and, 4) the radial loops and helical organization (Rattner and Lin, 1985; Adolph et al., 1986; Filipski et al., 1990; Saitoh and Laemmli, 1994).
In contrast, investigations performed at the optical level clearly demonstrate a longitudinal heterogeneity along the chromatids due to bands and interbands (Sumner, 1982, 1992, 1994; Manuelidis, 1990; Holmquist, 1992; Verma and Babu, 1995). Typically, banding techniques reveal four classes of bands (Sumner, 1994; Verma and Babu, 1995): heterochromatic bands (C-banding), euchromatic bands (G-, Q-, and R-bandings), kinetochores, and nucleolar organizer regions (NORs), all of which are characterized by several molecular and functional features (Sumner, 1982, 1990, 1994). The C-bands contain no genes but are composed of tandemly repeated satellite DNA. G- (or Q-) bands are composed of approximately 20% of the genes (except housekeeping genes) and are both AT-rich and late replicating. All housekeeping genes are found in R-bands, which are GC-rich and replicate early in S-phase. Kinetochores contain numerous proteins to which microtubules are linked at the level of centromeres (Brinkley et al., 1992). Finally, NORs are the sites where tandemly repeated rDNA genes, complexed with several nucleolar proteins, are segregated (Weisenberger and Scheer, 1995).
The work of Saitoh and Laemmli (1994), in which native chromosomes of Indian muntjac cells fixed in nonacidic conditions were examined by confocal microscopy, was the first to link the existence of bands to the structural organization of loops of chromatin fibers. A new scaffold–loop model was proposed in which different bands result in different folding patterns of an AT queue, identified as the chromosome scaffold to which small loops (in Q-bands) or large loops (in R-bands) of chromatin are linked. This work highlighted the organization of R-bands, among which is the R1 band (a NOR in Indian muntjac cells), but no study of the fine organization of the loops was possible due to the limited resolution of confocal microscopy and to the absence of a specific identification of the NORs.
In human cells, NORs can be specifically identified on acrocentric chromosomes at the optical and ultrastructural levels either by hybridizing in situ the ribosomal genes (Verma and Babu, 1995), immunolabeling for RNA polymerase I (RPI), upstream binding factor (UBF), and promoter selectivity factor 1 (SL1), which remain associated with rDNA genes during metaphase (Weisenberger and Scheer, 1995; Roussel et al., 1996) or the silver staining of the argyrophilic proteins of the NORs (Ag-NOR proteins; Goodpasture and Bloom, 1975; Howell, 1982; Ploton et al., 1982, 1986, 1987, 1994; Roussel and Hernandez-Verdun, 1994; Sumner, 1994; Verma and Babu, 1995; Thiry and Goessens, 1996).
Although the identification and numbering of NORs have been performed in numerous studies using these labels (Howell, 1982; Babu and Verma, 1985; Verma and Babu, 1995), nothing is known at the present time about the detailed 3D organization of the NORs. The aim of our study was to investigate both the external and internal 3D organization of metaphase NORs in both normal and cancerous human and murine cells by computing 3D reconstructions and 3D representations of specifically stained NORs within well-preserved cells observed both in confocal microscopy and in medium-voltage electron microscopy.
MATERIALS AND METHODS
This study was performed on various murine and human cancerous cell lines: L1210, Ehrlich cells, Friend cells, K562, HL60, KB, and normal stimulated lymphocytes. The results were similar for all of these cells and so data are only shown for K562, KB cells, Ehrlich cells, and normal lymphocytes.
Cell Culture
The human promyeloblastic K562 cells were grown in RPMI 1640 medium (Sigma, St. Louis, MO) supplemented with 10% (vol/vol) fetal calf serum. Human cancer KB cells were grown on coverslips placed in MEM (Sigma) supplemented with 10% fetal calf serum. Ehrlich cells (murine ascites tumor cells) were grown in a medium composed of 40% (vol/vol) NCTC 109, 40% (vol/vol) Hanks’ solution, and 20% fetal calf serum.
Chromosome Spreads
K562 cells or peripheral blood lymphocytes (2 × 10⁶ cells/ml) were cultured with Colcemid (0.5 μg/ml; Sigma) for 12 h. Mitotically arrested cells were treated for 10 min with a hypotonic solution (1:5 fetal calf serum:distilled water), centrifuged for 5 min, and fixed first in a 1:6:3 acetic acid:ethanol:chloroform mixture for 25 min and then in a 3:1 ethanol:acetic acid mixture for 40 min. Cells were pelleted, suspended in 3:1 ethanol:acetic acid mixture, and then spread on clean slides, which were dried overnight and kept at 4°C.
In Situ Hybridization
In situ hybridization was performed on pretreated slides (RNase at 100 μg/ml in 2× SSC) for 1 h at 37°C and pepsin (1 g/100 ml in 10 mM HCl) for 10 min at 37°C. Slides were then fixed (37% formaldehyde and 1 M MgCl2 in 10× PBS) for 10 min at room temperature and dehydrated in an ethanol series (50%, 70%, and 100%). The 28S rRNA gene probe (provided by Dr. R. Dirks, Leiden, The Netherlands), was labeled with digoxigenine by nick translation (plasmid plus insert). The probe was preheated in the hybridization mixture (50% formamide, single-stranded DNA at 10 μg/μl, 10% dextran sulfate, 0.1 M Na2HP04, 2× SSC, pH 7) for 5 min at 37°C, then denatured for 10 min at 72°C, and finally applied to the preheated slides (70°C). The slides were incubated at 37°C overnight. After hybridization, wash conditions were 4× SSC, 0.1% Tween for two 5-min periods at 42°C and 0.1× SSC for 5 min at 60°C. Slides were then blocked in 4× SSC, 0.05% Tween 20, 15% human serum for 1 h at 37° C. A mixture of equal amounts of sheep anti-digoxigenine-rhodamine (200 μg/ml), rabbit anti-sheep-rhodamine (1.5 mg/ml), and anti-rabbit-rhodamine (1.5 mg/ml), separately prepared and incubated with the blocking solution (30 min at 37°C), was applied to the slides during 30 min at 37°C. The slides were rinsed for three 15-min periods with 4× SSC, 0.1% Tween 20 at 37°C, stained with chromomycin A3, and mounted in an antifading agent (PPD-Dabco, Sigma, St. Louis, MO).
Ag-NOR Staining
After rehydration, NOR staining was performed as previously described (Ploton et al., 1986). Chromosome spreads or cells in culture were stained with a solution containing one volume of a 2% gelatin solution in 1% formic acid and two volumes of a 50% silver nitrate solution in distilled water. This solution was poured onto the slide and left for 10 min at 20°C in the dark. Slides were then washed several times in water, placed in a 5% thiosulfate solution for 5 min, washed, and stored in distilled water.
For DNA staining, the slides were dipped in a solution of propidium iodide (1 μg/ml in PBS) for 5 min (chromosomes) or in a solution of chromomycin A3 (100 μM in 150 mM MgCl2 in PBS) for 5 min (cells) in the dark, rinsed in PBS, and mounted in a 90% glycerol solution containing an antifading agent (Citifluor, Agar Scientific, Stansted, UK).
Quantitative Analysis of the Different Types of Silver-stained NOR Structures and of Their Repartition on Acrocentric Chromosomes (NOR-bearing Chromosomes)
This study was performed on a total of 4760 acrocentric chromosomes observed within 476 metaphase plates originating from 14 healthy patients (34 metaphase plates per patient). Metaphase chromosome spreads were obtained by standard techniques and silver-stained. After DNA staining with 4,6-diamidino-2-phenylindole, metaphase plates were imaged with a cooled charge-coupled device camera (C4880, Hamamatsu, Bridgewater, NJ). Then, a deconvolution algorithm was applied to each image as previously described (Monier et al., 1996) to highly improve the resolution of the 4,6-diamidino-2-phenylindole banding and to allow the precise identification of the NOR-bearing chromosomes (chromosomes 13, 14, 15, 21, and 22). For each pair of the five acrocentric chromosomes, the pattern of silver-stained NORs was classified as: 1) absence of staining, 2) doublets of spots, or 3) elongated structures.
Immunostaining
KB cells on coverslips were fixed in 3% (vol/vol) paraformaldehyde in PBS containing 1% (vol/vol) Triton X-100 for 4 min. Cells were soaked in 10% normal goat serum in PBS for 30 min, incubated with either a rabbit polyclonal antibody against RPI (a gift from Dr. K. Rose, Houston, TX) diluted 1:200 in PBS or with a human autoantibody against UBF diluted 1:200 in PBS (a gift from Dr. E.K.L. Chan, Scripps Research Institute, La Jolla, CA).
After rinsing in PBS, the cells were incubated for 45 min with a biotinylated goat anti-rabbit antibody (Sigma; for RPI) or a biotinylated goat anti-human antibody (Sigma; for UBF) diluted 1:200 in PBS. This second antibody was detected with streptavidin labeled with Texas Red diluted 1:100, for 15 min (Amersham, Arlington Heights, IL). DNA was then specifically stained with chromomycin A3 (Sigma; 100 mM in 150 mM MgCl2 in PBS at pH 6.8) for 5 min in the dark. After rinsing, the cells were mounted in 90% glycerol containing an antifading agent (Citifluor).
Confocal Microscopy
Slides were examined with a MRC 600 (Bio-Rad, Richmond, CA) confocal microscope equipped with two lasers (Argon and HeNe lasers), mounted on a Zeiss Axioplan microscope (Zeiss, Thornwood, NY) with a ×63, 1.4 numerical aperture plan apochromat objective. For each chromosome spread or cell sample, z-series were performed. These contained between 5 and 50 optical sections, obtained at a pitch of 0.3 μm. In all cases, fluorescence light or reflected light was collected in the following conditions: 1) the pinholes in front of the detectors were minimally open (i.e., 0.6 mm); 2) the image of each optical section was the result of an average of five images obtained with a kalman filter; 3) the scanning zoom varied from ×4 to ×6 to get a pixel size between 0.065 and 0.044 μm, i.e., near the Nyquist criterion (0.055 μm for a 1.4 numerical aperture and a wavelength of 550 nm).
Processing of the Images Obtained in Confocal Microscopy
Series of images were preprocessed with the Comos software package (Bio-Rad) to increase the contrast and to perform extended focus or for merging two labels. For 3D reconstruction and 3D rendering based on ray-tracing methods, we used a software package called Visu-Voxel (Lucas et al., 1996), which was developed by our group on a Sun 4 workstation (Sun Microsystem, Vélizy, France). This software allowed a direct visualization of the data contained in the sample without geometrical intermediates. Several aspects can be attributed to the voxel data base including: density, gradient values, opacity, colors, and various coefficients (diffusion, transmission, and scattering). This software allowed us to move around the three-dimensionally reconstructed objects and to present the more informative viewing angles and stereo pairs.
Ultrastructural Localization of DNA within Metaphase NORs
DNA localization within NORs was performed on Ehrlich ascites tumor cells grown as previously described and blocked in metaphase with Colcemid (Thiry et al., 1993). After fixation and dehydration, cells were acetylated to better differentiate chromatin from the NORs on ultrathin sections (Ploton et al., 1987). Ultrastructural localization of DNA was performed on ultrathin sections by using the highly specific TdT method (terminal deoxynucleotidyltransferase immunogold method; Thiry et al., 1993). After counterstaining with uranyl and lead, gold particles 10 nm in diameter could be easily localized relative to the cellular components; more particularly, chromatin appears as compact areas with a high contrast and NORs are easily identified as fibrillar regions with a low contrast (Ploton et al., 1987).
To obtain quantitative results, the number of gold particles per square micrometer was calculated (on 33 micrographs taken at random) after counting 8440 gold particles on four compartments of the sections: chromatin, NOR material, cytoplasm (excluding mitochondria), and resin.
Ultrastructural Localization of Ag-NOR Proteins
K562 cells were fixed with glutaraldehyde in 0.1 M PBS, pH 7.4, at a final concentration of 2%. After 15 min at 4°C, the cells were centrifuged and then fixed for 5 min in a 3:1 ethanol:acetic acid mixture. Cells were then silver-stained as described above and embedded in Epon.
Ultrathin sections 80 nm thick were counterstained in uranyl acetate and lead citrate and then observed in a 200 CX Jeol electron microscope working at 80 kV. Sections 1000 to 2000 nm thick were obtained, and no counterstaining was performed to analyze the silver deposits more easily (Beorchia et al., 1992). These sections were studied at 200 kV in a 200 CX electron microscope and images were obtained on negatives.
For the high-resolution tomographic studies, 3000-nm-thick sections were observed in a medium-voltage electron microscope working at 300 kV in the scanning and transmission electron microscope (STEM) mode (CM 30 Philips, Eindhoven, The Netherlands) as previously described (Beorchia et al., 1992). The specimen holder was mounted on a eucentric goniometer stage that can be tilted from −60° to +60°.
Before initiating a tilt series, the section was stabilized under the electron beam for 10 min at a dose of 100 e− per Å2 per s to limit anisotropic thinning of the specimen during data collection (Beorchia et al., 1992). Moreover, to position the specimen correctly relative to the axis of the goniometer stage, it was necessary to choose several fiducial markers. These markers, contrary to the usual practice, were not gold particles added on the surface of the section (Woodcock, 1992) but were nonspecific silver dots, 30 nm in diameter, present within the section. After correct alignment, the goniometer stage was positioned at −60° and images were taken each 2° intervals until +60°. Images were recorded directly on a disk-type scintillator–photomultiplier detector system and digitized on-line by using Orion hardware (ICI, Belfort, France) working on a PC.
Images of 256 × 256 pixels, with a high signal-to-noise ratio, were obtained by using a kalman filter. Typically, the pixel size corresponded to 7 nm on the specimen magnified 50 × 103 times.
Preprocessing of Images, 3D Reconstruction, and 3D Visualization
Because the final resolution of the 3D reconstruction largely depends on the aligment of the images (McEwen, 1992), we were careful to correct any slight shifting that may arise during the tilting process. For this, the images were visually aligned by translating them in X and Y directions relative to one fiducial marker (the shift was always smaller than 5 pixels). Due to the parallel imaging system of the STEM, such a process is of no consequence to the 3D reconstruction.
The precision of the visual alignment was then checked by using all the images of one tilt series to form a video loop that was displayed on the computer screen. With such a procedure any slight misalignment of pixels was easily observed and could be corrected. Finally, images were exactly centered in X, Y, and Z directions by using a sinogram technique (Bahr et al., 1979). The precision of the final alignment was determined to be one pixel in all directions.
Tomographic reconstruction was performed by using an extended field-additive algorithm-reconstruction technique on native aligned images as described by Gordon et al. (1970) and Crowther et al. (1970). For each slice of the volume, five iterations were computed on a Sun sparc 20 workstation. The accuracy of the reconstruction was assessed by comparing the resolution of the image obtained at 0° in the tilt series with that of the total projection of all the slices performed at 0°. Mean resolution in this first reconstructed volume was estimated to be around 15 nm and, to obtain a better look of the structures, the tomographic reconstructions were low-pass filtered to a resolution of around 30 nm. This modified volume was used to perform slices cut in any desired orientation with the Analyze Software package (Analyze, Mayo BIR, CN Software, Southwater, West Sussex, UK) to observe internal fibers and their relative positioning. This software was also used for measurements. Finally, 3D visualization was performed by using the ray-tracing method, as described above for data obtained in confocal microscopy.
3D Modeling
The 3D models of NOR structure and of chromosomes based on data previously published or from our present study were designed by using the Corel Draw software. Once computed, they were rotated in any direction to obtain representative views of the complex internal 3D organization and spatial distribution of the NOR relative to the chromosome.
RESULTS
Study by Nonconfocal and by Confocal Microscopy of Specifically Stained NORs
We first investigated the localization of rDNA genes and of Ag-NOR proteins by confocal microscopy on spread chromosomes of human lymphocytes.
Sites containing rDNA genes were only localized on acrocentric chromosomes and appeared either as doublets of spots (Figure 1A) or as elongated structures (Figure 1B). Typically, paired spots were either small (0.2 μm) or large (0.4 μm) in size and were disposed in mirror images on both chromatids. Elongated structures crossed the two chromatids and were frequently curved: they were approximately 0. 3 μm wide and 1. 5 μm long.
Figure 1.

Localization of NORs on spread chromosomes of human lymphocytes by confocal microscopy. In situ hybridization of rDNA genes (A and B) and Ag-NOR staining (C and D). DNA is stained red with propidium iodide. The specific labeling, in blue, appears on acrocentric chromosomes as pairs of dots symmetrically arranged (A and C) or as one elongated structure transversally oriented relative to both chromatids (B and D). Bar, 1 μm.
Silver-stained NORs were observed in reflected-light mode, as previously described (Ploton et al., 1986, 1994; Robert-Fortel et al., 1993). Extended-focus views allowed us to observe systematically two types of silver-stained structures on the acrocentric chromosomes: double-spotted (Figure 1C) and elongated (Figure 1D) structures. Double-spotted NORs were composed of two discrete spots with an external position on each chromatid. In contrast, elongated structures were composed of two sets of mirror-imaged couples of spots lying close together and perpendicularly crossing the chromosomes.
In view of these results, we performed a quantitative analysis to determine the frequency of each type of Ag-NOR structure and to investigate their preferential location on given NOR-bearing chromosomes. These results (Table 1) indicate that 81% of acrocentric chromosomes bear either doublets of spots (53%) or elongated structures (28%) of silver-stained material and that 19% show no staining. When the results are considered at the level of one metaphase plate, it appears that silver-stained NORs are not equally distributed among acrocentric chromosomes. Thus, chromosomes 13, 14, and 21 are frequently stained (approximately 97%) and equally bear either doublets of spots or elongated structures; in contrast, chromosomes 15 and 22 are less frequently stained (53 and 60%) and bear mainly doublets of spots (52 and 59%) and very rarely elongated structures (0.6 and 0.3%)
Table 1.
Distribution of silver labeling on human acrocentric chromosomes
| No. of acrocentric chromosomes (%) | % of chromosomes 13 | % of chromosomes 14 | % of chromosomes 15 | % of chromosomes 21 | % of chromosomes 22 | |
|---|---|---|---|---|---|---|
| No labeling | 906 (19) | 2.83 ± 1.58 | 3.6 ± 1.42 | 46.53 ± 13.54 | 2.42 ± 1.33 | 40.12 ± 13.72 |
| Doublets | 2526 (53) | 44.5 ± 9.27 | 60.40 ± 11.70 | 52.84 ± 13.07 | 48.00 ± 12.75 | 59.56 ± 13.58 |
| Crescent | 1328 (28) | 52.6 ± 9.63 | 36.24 ± 11.66 | 0.63 ± 0.75 | 49.68 ± 12.94 | 0.32 ± 0.63 |
A total of 4760 acrocentric chromosomes (observed on 476 metaphase plates originating from 14 healthy patients) were studied after Ag-NOR staining. For each metaphase plate, the type of silver labeling (classifed as no labeling, doublets of spots, or as a crescent-shaped structure) is considered for each acrocentric chromosome. Results are given for acrocentric chromosomes taken as a whole and for each type considered at the level of one metaphase plate. Data are the mean ± SEM.
As recently demonstrated (Roussel and Hernandez-Verdun, 1994), UBF and RPI are metaphasic Ag-NOR proteins. To confirm that these molecules are localized within structures similar to those identified after Ag-NOR staining, well-preserved metaphase cells (KB cell line), stained for DNA with chromomycin A3 and specifically stained with silver or immunolabeled for UBF or RPI, were examined by confocal microscopy through z-series (Ploton et al., 1994; Gilbert et al., 1995). On one single optical section taken within each z-series (Figure 2, A–C), the labeling for the NORs appears as spots or as elongated structures (light blue) localized in the vicinity of chromosomes (red).
Figure 2.
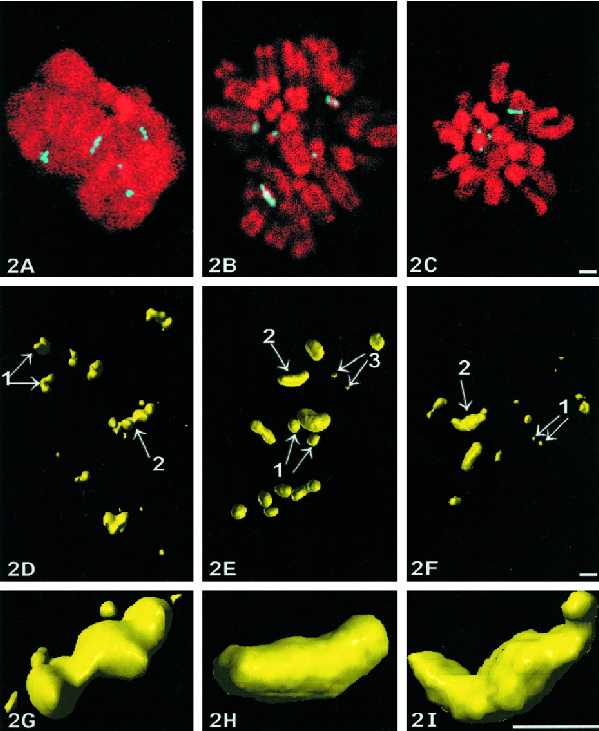
Confocal microscopy of NORs within metaphase KB cells. Localization and 3D structure of NORs studied within whole-mount cells by confocal microscopy after Ag-NOR staining (A, D, and G), UBF (B, E, and H) or RPI (C, F, and I) immunolabelings. (A–C) Each labeling is shown on one single section and is colocalized relatively to DNA stained by chromomycin A3 (shown in red for convenience). In all three cases, the labeling (in blue) appears both as dots (or pairs of dots) and as crescent-shaped structures in contact with chromosomes. Z-series of optical sections are used to compute 3D reconstructions and visualizations of the NORs, which appear (D–F) as doublets of spots (arrows 1 and 3) and as elongated structures (arrows 2). The latter always appear as crescent-shaped structures with a central protrusion and two curved arms as seen at higher magnification (G–I). Bars, 1 μm.
Next, all the optical sections were used to compute high-resolution 3D reconstructions and 3D visualizations of the NORs. Global views of the 3D reconstructions (Figure 2, D–F) indicate that there are two or three typical double-spotted (small or large spots, arrows 1 and 3) and two or three elongated structures (arrow 2) within each metaphase cell. Close-up views of the elongated structures (displayed in Figure 2, G–I) demonstrate that these structures are around 1.3 μm long and 0.3 μm wide and have a typical crescent-shaped design with a central protuberance. Finally, an exact colocalization of UBF and RPI was evidenced after simultaneous labeling of the same metaphase cells (our unpublished results).
Study of NORs at the Ultrastructural Level
As previously published (Ploton et al., 1987), metaphase NORs on ultrathin sections appear as doublets of spots or as elongated structures with a fibrillar organization and a low contrast, relative to chromatin. An example of a crescent-shaped NOR is shown on one section of a longitudinally cut metaphase chromosome of an Ehrlich cell (Figure 3A). In this view, chromatin (arrow 1) is easily identified and the NOR (arrow 2) appears as a lighter structure perpendicularly disposed to the long axis of the chromatids and interrupting them. However, on serial sections of the same structure (Figure 3, B and C), it clearly appears that the two parts of the chromatids on each side of the NOR are linked together with one central bridge of chromatin 150 nm in diameter (arrowhead).
Figure 3.

Ultrastructure of crescent-shaped NORs. Crescent-shaped NORs observed in ultrathin sections of acetylated Ehrlich cancerous cells blocked in metaphase. (A–C) Three serial tangential sections parallel to the long axis of one NOR-bearing chromosome. After uranyl and lead counterstaining, chromatin (arrow 1) appears with a high contrast to electrons, whereas the fibrillar component of one NOR shows a lower contrast (arrow 2). On A, the elongated NOR (240 nm in diameter) is interrupting the chromosome. However, on two serial sections of this structure (B and C), two fibers of chromatin 100–150 nm in diameter (arrowheads) appear in continuity with the left and right sides of the chromosome. This suggests that one elongated NOR is crossed by two bridges of chromatin (one bridge per chromatid) and does not interrupt the continuity of the chromosome. Consequently, on some well-oriented sections, the NOR seems to be divided in three distinct parts as observed on C. Bar, 500 nm. (D) Specific detection of DNA by the TdT method on an ultrathin section of an acetylated Ehrlich cell blocked in metaphase. The elongated NOR shown is similar (but is turned at 90°) to the one in A–C. Thus the three fibrillar zones belong to the same NOR (1800 nm long and 400 nm thick) that is divided in three parts by two bridges of chromatin (arrowheads) as above (C). Gold particles, 10 nm in diameter, specifically reveal DNA. Condensed chromatin (labeled C) is labeled with the highest density of gold particles. Moreover, a significant number of gold particles is localized on the NOR attesting for the presence of uncondensed DNA (arrows). Note that there is no background. Bar, 500 nm.
Moreover, to ascertain that those fibrillar structures are subcomponents of the chromosomes, we tested the presence of DNA at their level. We chose the TdT method (Thiry et al., 1993; Thiry and Goessens, 1996) because its high sensitivity can be applied to ultrathin sections of classically processed cells. The gold particles identifying DNA were clearly localized on condensed chromatin of metaphase chromosomes within Ehrlich cells (Figure 3D). The observation of hundreds of NORs (fibrillar component) appearing either as doublets of spots or as elongated structures also demonstrated the presence of DNA at their level (Figure 3D, arrows) although the number of gold particles is smaller than on condensed chromatin. One can also note on this figure that two bridges of chromatin (arrowhead) divide the NOR into three parts.
The number of gold particles per square micrometer was evaluated within various components: chromatin, fibrillar component of the NORs, cytoplasm (excepted mitochondria), and resin (Table 2). The higher labeling density was found on chromatin. Although the gold density over the fibrillar component is lower, it is highly significant relative to those compartments without DNA, such as the cytoplasm and the resin. We conclude from this experiment that DNA is certainly present within the NORs (i.e., fibrillar structures identified within chromosomes) and, because the gold density is directly linked to the compaction of DNA (Thiry et al., 1993), that this DNA is around ten times less condensed than DNA in compact chromatin.
Table 2.
Labeling densities in various cellular compartments after applying the TdT immunogold procedure specific for DNA
| Compartment | Gold particles (no./μm2) |
|---|---|
| Chromatin | 140.09 ± 28.83 |
| Fibrillar component of chromosomes (NOR) | 15.80 ± 10.41 |
| Cytoplasm | 0.51 ± 0.41 |
| Resin | 0.64 ± 0.11 |
Quantitation of gold particles was performed on ultrathin sections of acetylated Ehrlich tumor cells blocked in metaphase. Thirty-three micrographs centered on fibrillar component located within metaphase chromosomes (corresponding to NORs) were taken at random at a direct magnification of ×10,000. A total of 8440 gold particles were counted, and their density was calculated for each compartment.
Electron Tomography of NORs
As numerous studies have already shown, the examination of the 3D organization of an organelle at a high resolution requires the specific increase of the contrast by using a highly electron-dense labeling (Yamada and Ishikawa, 1981; Mc Ewen, 1992).
We therefore chose the one-step Ag-NOR staining to study the 3D organization of NORs at the ultrastructural level (Ploton et al., 1982) because chromosome structure is well-preserved after silver-staining and the end-product of the reaction consists of numerous tiny metallic silver dots, 5 nm in diameter, strictly localized within the NORs (Hernandez-Verdun and Derenzini, 1983; Ploton et al., 1987).
The good overall ultrastructural preservation of chromosomes and the absence of silver background were checked on ultrathin sections (100 nm thick) of silver-stained metaphase cells counterstained with uranyl and lead (Figure 4A).The chromatids, 600 nm wide, exhibit a morphology similar to that of classically fixed cells (Ploton et al., 1987). In this figure, two types of silver-stained NORs are revealed: a circular type, 150 nm in diameter (arrow 1), and an elongated and curved type, 150 nm in diameter and 700 nm long (arrow 2). Typically, the latter was positioned around a mass of chromatin of approximately 350 nm in diameter.
Figure 4.
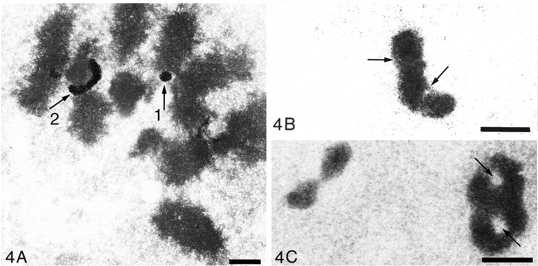
Observation of silver-stained NORs at the ultrastructural level within ultrathin or thick sections. (A) The ultrathin section is counterstained with uranyl and lead to locate precisely chromosomes, which are contrasted in dark gray. Two silver-stained NORs appear: one is a circular structure 150 nm in diameter (arrow 1), and the other is an elongated structure 150 nm in diameter and 700 nm long (arrow 2) in close contact with chromosomes. (B and C) A 1000-nm-thick section without uranyl and lead counterstaining. Chromosomes are not visible but details within the silver-stained structures are evident. In B, the NOR is 1000 nm long and 300 nm in diameter. A fiber 60 nm in diameter appears in some places (arrows). In C, an eight-shaped NOR is observed. Two circular and central zones, approximately 155 nm in diameter, without silver deposits, are clearly visualized (arrows). One can note the identity of structures observed by electron and by confocal microscopy by comparing A and B with Figure 2, G, H, and I. Bar, 500 nm.
When 1-μm-thick sections were observed at 200 kV without counterstaining, new features of the metaphase NORs were visible (Figure 4, B and C). In Figure 4B, an elongated silver-stained NOR is observed with a high contrast relative to the unstained background. It is composed of a cord approximately 1000 nm long and 300 nm in diameter, in which a 60-nm-wide fiber appears longitudinally in some places (arrow). Moreover, in some sections, complex eight-shaped NORs can be seen (Figure 4C) that are made of a cord, 1000 nm long and 300 nm in diameter, with two central holes 155 nm in diameter (i.e., two circular zones without silver deposits).
To perform high-resolution electron tomography, it was necessary to study 2000- to 3000-nm-thick sections of silver-stained metaphase cells in a STEM working at 300 kV. Tilted series were then performed from −60° to +60° at a pitch of 2°. Some views of such tilted series are shown with a reverse contrast for convenience in Figure 5, A–G. The NOR under study appears in a typical crescent-shaped structure and is composed of a cord approximately 300 nm in diameter. All the images of the tilted series were then used to compute a volumic reconstruction (Figure 5H). This view presents a projection through the tomographic reconstruction observed at a 0° position. The comparison of this image with original images of the tilt series demonstrates the high resolution of this reconstruction and justifies our approach.
Figure 5.

Tilted views of a silver-stained crescent-shaped NOR. A gallery of seven views taken from a tilted series (from −60° to +60°) of one crescent-shaped silver-stained NOR observed through a 3000-nm-thick section at 300 kV and tilted from −60° to +60° at a pitch of 2°. The contrast is reversed for convenience. (A–G) The labeling consists of 5- to 10-nm silver dots homogeneously distributed within the NOR. It is noticeable that the resolution and contrast are very high at all tilt angles. Moreover, the background is very limited. The crescent-shaped NOR is composed of two coils 180–300 nm wide with a complex shape that appears during tilting. (H) A projection through the full volume of the tomographic reconstruction is observed at 0° angle of view. The high resolution, approximately 10 nm, of this reconstruction is attested by the possibility to discern silver dots within and outside the NOR. (Compare with initial images of the tilted series in A–G). Bar, 500 nm.
Crescent-shaped NORs Display a Complex Internal Organization
Realistic 3D representations demonstrated that the crescent-shaped NORs are approximately 1275 nm long, consisting of a cord varying from 150 to 300 nm in diameter (Figure 6A). Three regions could be defined along this cord (Figure 6B). Regions I and II consist of two coils, each forming part of a spiral with external and internal diameters of approximately 765 nm and 360 nm, respectively. Region III corresponds to a central protuberance where the two coils are juxtaposed.
Figure 6.

(top panel). 3D visualization of one crescent-shaped NOR. The tomographic reconstruction of the NOR showed in Figure 5H is used for 3D visualization. (A) Overall 3D visualization of one crescent-shaped NOR. (B) The previous image is colored and labeled to describe the organization of the NOR more easily. Three regions are identified along the cord of the NOR 150–300 nm in diameter. Regions I and II are two coils with an external and internal diameter of 765 nm and 360 nm, respectively. Region III is prominent and corresponds to a central position where the two coils are apposed. Note that arrowheads 1 and 2 correspond to two angles of view shown in C, G, and E, respectively. (C) Stereo pair (to be observed with a stereo viewer to discern the 3D organization) demonstrating the curved shape of the region II and its flattened distal extremity (angle of view 1 on B). A fiber 60–80 nm in diameter appears on the proximal part of region III and on the distal part of region II (D, arrows 1 and 2). Bar, 100 nm. (E–H) Close-up views of the 60- to 80-nm fiber visualized with a higher threshold. (E and F) Within the crescent-shaped NOR observed at the level of the region II (B, angle of view 2). (G and H) Within the region I (B, angle of view 1). (E) Stereo pair demonstrating the helical organization of the fiber. (F) Size a is 80 nm in this view. (G) Stereo pair with a high depth of field showing the presence of numerous regularly arranged loops of the fiber both in front and rear planes. (H) The size of the fiber b is 60 nm; size c is 260 nm. Bar, 100 nm.
By performing complex rotations of the 3D reconstructions and close-up views, a more detailed analysis of the NOR was possible. Some striking features are shown on stereo pairs (Figure 6, C–H). Region I has the most irregular shape and an uneven surface. A deep cleft is present in the median part of this region. The central area of the NOR (region III) has a rather spherical shape approximately 300 nm in diameter. The median part of region II shows a cleft that corresponds to a limited portion of the cord with a smaller diameter (150–200 nm). In contrast, the proximal part of the region II has a larger diameter of approximately 300 nm. Finally, the distal part of this region appeared as a concave structure with a flattened extremity (Figure 6, C and D).
Depending on the viewing angles, several regular spurs were identified on the surface of the cord within different regions of the NORs. For example, spurs were present on the central part of the NOR (Figure 6D, arrow 1) and on the distal extremity of region II (Figure 6D, arrow 2). These spurs were interpreted as highly organized internal components of the cord that did not always appear on the 3D representation due to the too low threshold used for visualization, as previously demonstrated for other organelles (McEwen, 1992).
Finally, the 3D organization of these fibers was further studied by obtaining 3D visualizations based on a higher threshold. Stereo pairs of some characteristic regions indicated the presence of twisted fibers and demonstrated their complex 3D disposition. Thus, the more obvious organization of this fiber was seen within the proximal part of the region II (Figure 6, E and F) where it consisted of a solenoidal structure composed of four regular coils, orthogonally arranged relative to the cord surface but with an angle approximately 20° relative to the long axis of the coil. In the proximal part of region I of the NOR, several 60- to 80-nm twisted fibers were easily identified (Figure 6, G and H).
Double-spotted NORs Consist of a Coiled Fiber
Two types of double-spotted NORs were observed: small ones and larger ones approximately 80 nm and 260 nm in thickness, respectively. The 3D reconstructions of the smallest ones (Figure 7 A and B) showed that they consist of a regular fiber 60–80 nm in diameter that composed one part of a helix with an external diameter of 260 nm. The 3D reconstructions of the largest ones (Figure 7, C and D) showed they had an external diameter of 260 nm and a total height of 200 nm. They also consist of a fiber 60–80 nm in diameter arranged as a helix 260 nm in diameter parts of which are more evident on the stereo pair.
Figure 7.
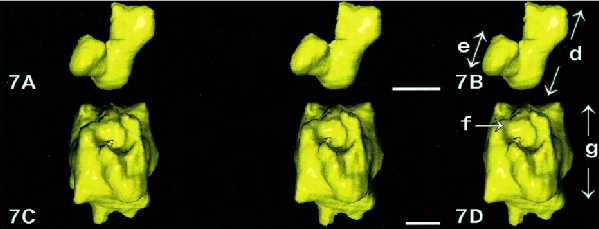
3D visualization of double-spotted NORs. Tilted series of double-spotted NORs of small (A and B) or large size (C and D) are used for tomographic reconstruction and for 3D visualization. In each case, only one of the two spots is shown as a stereo pair. (A and B) This small NOR appears as part of a coil 260 nm in diameter (B, size d) constituted with a fiber approximately 80 nm in diameter (B, size e). (C and D) This large NOR, 260 nm in diameter (D, size g) consists of a fiber (f) approximately 80 nm in diameter arranged as several turns of a helix as seen by viewing the stereo pair in C. Bar, 100 nm.
Crescent-shaped NORs Consist of 60- to 80-nm Coiled Fibers
To visualize the internal organization of the crescent-shaped NOR, virtual sections (tomography) were computed parallel to the coronal, sagittal, and transversal planes of the volume. By choosing a section thickness of one voxel (6 nm), we obtained 99, 135, and 192 sections for coronal, sagittal, and transversal orientations, respectively. For simplicity, only some sections with coronal orientation are shown (Figure 8). Equally, for convenience, silver-stained components are shown in white. Globally, this study clearly reveals that the whole NOR is not an homogeneous structure but, in contrast, consists of several fibers 60–80 nm in diameter that appear in all the sections (for example, arrowheads on sections 30, 42, and 56). These fibers are very contorted and constitute parts of loops separated with numerous regular holes (i.e., parts of the volume without silver deposits; for example, see Figure 8, arrows on sections 42 and 54).
Figure 8.

Tomographic study of one crescent-shaped NOR. Ninety-nine coronal tomographic slices 6 nm thick are systematically performed along the reconstructed volume of the crescent- shaped NOR. For simplicity, one section of two is shown from sections 20 to 82. These views demonstrate the presence of contorted fibers 60–80 nm in diameter within the full volume of the structure (see, for example, arrowheads on sections 30, 42, and 56). One can note that numerous dark zones without silver are frequent (sections 42 and 56, arrows). Bar, 100 nm.
To obtain more detailed views of this typical organization at a higher magnification, the same volume was cut in slices with an orientation strictly defined by the observer. A section thickness of 30 nm was chosen to better visualize the fibers. This mode of sectioning confirms the twisted organization of fibers 60 nm in diameter because it appears on a coronal section (Figure 9A). In some parts of the volume, the fibers show a peculiar organization that we investigated on perpendicular sections performed as indicated by segments named b, c, and d (Figure 9A). On a transversal section of the coil, the fibers are disposed as rings (Figure 9B) that are indicative of a preferential longitudinal disposition of the 60-nm fiber. This is confirmed on the tangential section of the coil (Figure 9A, segment c) in the region in Figure 6B named III in which a contorted fiber longitudinally disposed is demonstrated (Figure 9C). When a longitudinal section was made within the distal concave part of the coil (Figure 9A, segment d), we observed that the curved extremity of the cord was due to a folding back of the 60- to 80-nm fiber and that the fiber was organized as a double helix (Figure 9D, curved arrow). Moreover, to obtain a global view of the 60- to 80-nm fiber and of its volumic organization within the whole structure, we computed one stereo pair in the maximum projection mode (Figure 9E). This view confirms that a contorted regular fiber is present within all the parts of the NOR giving rise to a typical braided-like structure.
Figure 9.

Tomographic slices 30 nm thick obtained from the reconstructed volume of the crescent-shaped NOR and observed at higher magnification. (A) Is a coronal slice demonstrating that a complex network consisting of a basic fiber 60–80 nm in diameter can be seen within the whole NOR. The three white lines (b, c, and d) localize the planes of three transversal slices performed within the reconstructed volume and presented in B, C, and D, respectively. (B–D) Transversal slices, 30 nm thick, showing that the 60- to 80-nm fiber is not localized at random. Thus in B and C, a circular arrangement and a coiled organization of the fiber are clearly evidenced. In D, the fiber presents a fold-back (arrow) and a regular double-helix organization, suggesting that this part of the coil is an extremity of a helically twisted loop. Note, B shows the same angle of view as in Figure 6G. (E) Stereo pair of the full volume visualized in the maximum projection mode demonstrating that the NOR is a braided structure. Bar, 100 nm.
DISCUSSION
Microscopic Identification of NORs
NORs were initially defined as sites around which nucleoli reorganize during telophase (Howell, 1982). During metaphase, these sites contain uncondensed DNA (Saitoh and Laemmli, 1994) identified as rDNA genes that are responsible for 80% of total RNA synthesis within all the eukaryotic cells (Hadjiolov, 1985; Thiry and Goessens, 1996). These genes are associated with proteins of the transcriptionnal machinery such as RPI, UBF, topoisomerase I, or SL1 (Scheer and Rose, 1984; Matsui and Sandberg, 1985; Haaf et al., 1991; Zatsepina et al., 1993; Roussel and Hernandez-Verdun, 1994; Roussel et al., 1996; Thiry and Goessens, 1996). Among the latter, it has been demonstrated that RPI (Matsui and Sandberg, 1985) and UBF (Chan et al., 1991) are bound to rDNA genes in the form of initiated transcription complexes (Weisenberger and Scheer, 1995) that can be reactivated by polyanionic treatment (Matsui and Sandberg, 1985). Moreover, metaphase RPI and UBF were clearly identified as the main Ag-NOR proteins (Roussel and Hernandez-Verdun, 1994), i.e., were characterized by their argyrophily, which is the basis for the specific cytochemical identification of NORs on metaphase chromosomes (Howell, 1982; Babu and Verma, 1985; Verma and Babu, 1995). Consequently, all these characteristics allow us to claim that Ag-NOR staining is a very efficient cytochemical method aimed at specifically identifying RPI and UBF complexed to rDNA genes during metaphase and, consequently, can be used to study the detailed 3D organization of these complexes within the NORs if sufficiently sensitive microscopic methods are employed.
Our studies performed with confocal microscopy on spread chromosomes confirm this colocalization by demonstrating that small and large doublets and elongated structures can be observed after the labeling of rDNA genes, UBF, RPI, and Ag-NOR proteins. Our quantitative study shows that elongated NORs are frequent structures that are more frequent on chromosomes 13, 14, and 21 and very rare on chromosomes 15 and 22. Although various types of NORs have been described in previous studies (Howell, 1982; Verma and Babu, 1995), crescent-shaped NORs were never identified as an entity. Our localization of rDNA genes also identified the different sized-NORs and would suggest that the size of NORs could be correlated to the number of rDNA genes as previously proposed (Warburton and Henderson, 1979; Roussel et al., 1996).
To rule out the possibility that the crescent-shaped NORs are artifacts originating from chromosome spreading, these complex structures were identified by confocal microscopy within entire cells stained for Ag-NOR proteins, UBF, or RPI. The high resolution of the 3D reconstructions allowed us to undoubtly identify, for the first time, the three types of NORs previously observed on spread chromosomes. Double-spotted NORs appear as pairs of small or larger spheres in which no subregion can be observed. The crescent-shaped NORs are present in all the cell types investigated (normal and cancerous). The 3D reconstructions also demonstrate that elongated NORs have a complex shape, with a central protuberance and two curved arms of irregular width. The comparison of these 3D reconstructions with images of NORs observed on spread chromosomes and on serial ultrathin sections suggests that one elongated NOR is not a disk of fibrillar material interrupting the two chromatids of the NOR-bearing chromosome. At the opposite, it is composed of two rings of fibrillar material perpendicularly disposed to the long axis of the chromatids centered around an axis of chromatin and each ring belongs to one of the chromatids that are in close contact in this region due to the proximity of primary constrictions (Harrison et al., 1981).
High-Resolution 3D Reconstructions of NORs Observed by Medium-Voltage Electron Microscopy
Electron-microscopic tomography (Frank, 1992) of large cellular structures such as NORs (approximately 1.5 μm for the larger size) presents several well-defined constraints that dictate the technical approach that can be employed (McEwen, 1992). Firstly, these structures must appear within a section 2–3 μm thick of a three-dimensionally well-preserved cell to have a high probability of observing them as a whole. Secondly, the electron tomography must be performed by tilting the section very accurately, at high angle values under the electron beam (typically from −60° to +60° with a pitch of 1 or 2°). Thirdly, the contrast of the objects that is very low due to the high diffusion of the electrons within the thickness of the section must be specifically increased with an electron-dense marker (Yamada and Ishikawa, 1981; McEwen, 1992). These three constraints necessitate the use of a medium- or high-voltage electron microscope (200–1000 kV; Turner and Collins, 1990) equipped with an eucentric goniometer stage. As we previously showed (Beorchia et al., 1992), a 300-kV STEM has a better resolution and a higher contrast compared with a conventional high-voltage transmission electron microscope. Another advantage of it is that, in contrast to classical microscopes in which images are captured on negative films, images are directly numerized: this avoids misalignment errors that greatly limit the resolution of the 3D reconstruction (Woodcock, 1992).
Specific labeling of the NORs could be based on the detection of either rDNA genes by in situ hybridization or of proteins associated with rDNA by immunocytochemical or cytochemical labelings. However, at the present time, preembedding techniques for in situ hybridization (Sibon et al., 1995) or for immunolocalization (Ochs and Press, 1992) require a pretreatment aimed at increasing the accessibility of the probes but which also could disturb the 3D organization of the NORs. Consequently, we choose to perform tomographic reconstructions of NORs observed through tilted 3-μm-thick sections in a 300-kV STEM after specific Ag-NOR staining, i.e., under conditions that preserved the integrity of chromatin (Hernandez-Verdun and Derenzini, 1983) and natural positioning relative to metaphase chromosomes (Ploton et al., 1987). This last point, which is of prime importance, is confirmed by the fact that for all the cellular types we investigated (murine or human, normal or cancerous), silver-stained NORs always appear strictly identical to those identified on spread chromosomes or after immunolocalization at the optical or ultrastructural level. All these features support the validity of our study and of the model we will present.
The different sized NORs (double spots and crescent) differ only in the length and the organization of a basic element (i.e., a fiber 60–80 nm in diameter that constitutes either a part of a coil or several coils approximately 260 nm in diameter). Such a finding raises the question of the molecules present within these fibers. By using osmium ammine complex (Feulgen-like reaction), it was demonstrated that a loose network of nonnucleosomal DNA fibers (a characteristic of rDNA genes) was exclusively colocalized with silver deposits at the level of silver-stained metaphase chromosomes (Hernandez-Verdun and Derenzini, 1983). Moreover, by using the TdT method (Thiry et al., 1993), we unequivocally localized DNA within chromosomic fibrillar domains previously identified as NORs (Ploton et al., 1987). This technique is based on the hypothesis that extremities of DNA molecules originating from the break of chromatin during ultrathin sectioning of the embedded cell can be revealed with a high specificity and sensitivity on the surface of the section (Thiry and Goessens, 1996). Consequently, colloidal gold particles localize DNA molecules and their number is also directly linked to the level of DNA compaction. Moreover, as this method does not require a drastic treatment of the cells or of the sections, the morphology of the cell compartments is well preserved, allowing their unambiguous identification. These two last characteristics allowed us to demonstrate the presence of DNA within metaphase NORs and to prove that the compaction of this DNA is around ten times less important than that of condensed chromatin. These results confirm those of Conconi et al. (1989), that Ag-NOR proteins are specifically located in the vicinity of nonnucleosomal and uncondensed rDNA genes during metaphase. On the basis of these last results and the fact that UBF and RPI are Ag-NOR proteins (see above), it is reasonable to postulate that the 60- to 80-nm fiber that we clearly observed represents r-chromatin (i.e., rDNA genes tandemly arranged and associated with proteins such as RPI and UBF, which are argyrophilic; Weisenberger and Scheer, 1995). However, further investigations will be necessary to precise the spatial location of rDNA genes within these fibers.
In addition, our tomographic study indicates that crescent-shaped NORs consist of several twisted fibers 60–80 nm in diameter, longitudinally positioned within the 250-nm coil. An examination of the concave tips of the crescent also demonstrates a folding back of the fiber. This indicates that the different fibers constituting this extremity of the NORs probably belong to the same twisted fiber coming back to its origin, thus suggesting a twisted-loop organization of the r-chromatin in the NORs. Such twisted loops were earlier shown at the periphery of all metaphase chromosomes after incubation with hexylene glycol (Marsden and Laemmli, 1979), suggesting that bulk chromatin was organized as radially arranged twisted loops of chromatin fibers 50 nm in diameter. However, within the NORs, the lay out of the twisted loops is not radial but longitudinal (i.e., parallel to the longitudinal axis of the 250-nm coil).
Moreover, the 3D reconstruction of the crescent-shaped NORs reveals two axial holes (i.e., two zones without silver deposits) 155–230 nm in diameter that are due to the presence of bridges of condensed chromatin within the concave part of the crescent shape, as demonstrated by the examination of serial ultrathin sections of acetylated cells, counterstained with uranyl and lead (Figures 3 and 4; Ploton et al., 1987, 1990). This finding is in agreement with the recent model of Saitoh and Laemmli (1994) in which R-bands (and NORs) appear as heterogeneous structures and consist of a longitudinal axis of AT-rich chromatin and topoisomerase II (Poljak and Kâs, 1995) to which long loops of DNA are tethered. Finally, because our analysis indicates that the different sized NORs are not randomly located, we can postulate that the previously active rDNA genes, as attested by Ag-NOR staining (Roussel et al., 1996), are not equally distributed on NOR-bearing chromosomes. Instead, the NORs are present preferentially on chromosomes 13, 14, and 21 with lower quantities being found on chromosomes 15 and 22.
Toward a High-Resolution 3D Model of Metaphase NORs
Thus, these findings allow us to propose a model of the 3D organization of one crescent-shaped NOR (Figure 10). To render the complex organization of the metaphase NOR more comprehensive, its hypothetical intermediate levels of folding arising during prophase and metaphase are depicted on Figure 10, A–D. The AT-rich axis of chromatin centered within the metaphase NOR is presented as a red cylinder 250 nm in diameter. rDNA genes associated with Ag-NOR proteins (UBF and RPI) constitute one fiber of r-chromatin (in yellow) approximately 80 nm in diameter emanating from the AT-rich axis. For simplicity, we hypothesized that this NOR contains only one loop of r-chromatin whose steps of compaction can be summarized as follows. First, r-chromatin is viewed as one large loop (Figure 10A) that is then twisted along its long axis (Figure 10B). When the highest level of twisting is reached (Figure 10C), the r-chromatin constitutes one cord 250 nm in diameter and approximately 1750 nm long. This structure is then bent around the AT-rich chromatin axis (Figure 10D) to constitute an open ring of r-chromatin with an outer diameter of 750 nm, which can be considered as one NOR precisely located relatively to the axis of one chromatid. When the two sister chromatids of one NOR-bearing chromosome are disposed close together during metaphase, the two NORs partly overlap and constitute one crescent-shaped NOR with a central protuberance as shown in two angles of view (Figure 10, E and F).
Figure 10.

3D model of the elongated NOR and of its localization relatively to the NOR-bearing chromosome. (A–D) These views show the hypothetical levels of folding of the r-chromatin fiber during prophase and metaphase. In this 3D model, the r-chromatin fiber (i.e., rDNA genes associated with Ag-NOR proteins) constitute one fiber 80 nm in diameter (in yellow) emanating from an AT-rich axis 250 nm in diameter (in red) of one chromatid. Initially, the r-chromatin fiber constitutes an extended loop (A) that is more and more twisted during the course of chromosome condensation (B and C). Then, this twisted structure is bent around the AT-rich axis (D) to constitute one NOR at the level of one chromatid. When the two chromatids are close together during metaphase, the two NORs partly overlap and constitute one typical crescent-shaped structure. (E and F) Frontal view and a rear-profile view, respectively, of the NOR showing the exact position of the AT-rich axis of the two chromatids and the braided organization of the r-chromatin fiber. (G and H) One front view and one rear view, respectively, of one human chromosome 13 modeled in 3D. The two chromatids are constituted with a chromatin fiber 250 nm in diameter organized as several coils: five for the long arm and two for the short arm. At the level of the centromere, the two chromatin fibers of the chromatids are straight and are in close contact. At the level of the NOR, each chromatin fiber is also straight but, at the opposite, is centered on the chromatid axis and is surrounded with a coil of r-chromatin fibers. One can note from the rear view that the crescent-shaped NOR is constituted with two coils of r-chromatin that are totally integrated within the full 3D organization of the 250-nm coils of the chromatids and only differ at the level of chromatin compaction. Bars, 250 nm.
Finally, to integrate this NOR in the whole volume of a NOR-bearing chromosome, one acrocentric chromosome 13 was 3D computed. Data used for this volumic model were taken from previously published articles (Rattner and Lin, 1985; Boy de la Tour and Laemmli, 1988) and from our present results. In this model, each chromatid is constituted with one coiled chromatin fiber 250 nm in diameter (Figure 10, G and H). To obtain one complete NOR-bearing chromosome, the 3D model of one chromatid was duplicated with a mirror symmetry, giving rise to one left-handed chromatid and to one right-handed chromatid (Boy de la Tour and Laemmli, 1988). The long arm of the chromatid contains five coils. The coiling stops at the level of both the centromere and the NOR in which the chromatin fiber is disposed as straight segments. In this model, two coils of chromatin positioned on each side of one coil of NOR constitutes, with the latter, the short arm of the chromosome. On these 3D representations (front view and rear view), the NOR containing uncondensed r-chromatin now appears as one chromosome band that has the same size and the same orientation as the coils of condensed chromatin. Consequently, it is in total continuity with the other parts of the chromosome.
This 3D model fits well with all data obtained at different levels of investigation in this work. For example, Figure 10, G and H, is similar to views obtained at the optical level after localization of rDNA genes or Ag-NOR labeling (Figure 1, A and B, and C and D). Figure 10, E and F, corresponds well, firstly, to Figure 2, G, H, and I, obtained after localization of Ag-NOR proteins, UBF and RPI, respectively, and, secondly, to Figures 3 and 4. More particularly, Figure 10E is very similar to Figure 4C, which is a frontal view of one crescent-shaped NOR (the eight-shaped structure may be explained by the presence of larger coils with a ring shape). Finally, the internal organization of the r-chromatin fiber depicted in this model is probably very similar (although more simple) to the one shown either on 3D visualization (Figures 6 and 7) or on tomographic slices (Figures 8 and 9).
Concerning the 3D modeling of spotted NORs, our study indicates that small and large NORs differ only at the level of the length of r-chromatin fibers, which are similarly organized to fibers within crescent-shaped NORs. However, our work cannot give a definite answer concerning the exact position of the r-chromatin relatively to both the AT-rich axis and the chromatin coil, and it will require more work to study the 3D organization of small silver-stained NORs and specifically labeled DNA simultaneously.
ACKNOWLEDGMENTS
This work is dedicated to the memory of Pr. A.A. Hadjiolov. We thank Drs. R. Dirks, K. Rose, and E.K.L. Chan for the generous gift of 28 S rRNA probe, RPI antibody, and UBF antibody, respectively; and also Drs. M. O’Donohue and S. Ricord for reading the manuscript. This work was supported by Association pour la Recherche sur le Cancer (grant 6166) and Echanges Franco-Belges Institut National de la Santé et de la Recherche Médicale-Communauté Francaise de Belgique.
REFERENCES
- Adolph KW, Kreisman LR, Kuehn RL. Assembly of chromatin fibers into metaphase chromosomes analyzed by transmission electron microscopy and scanning electron microscopy. Biophys J. 1986;49:221–231. doi: 10.1016/S0006-3495(86)83636-0. [DOI] [PMC free article] [PubMed] [Google Scholar]
- Babu KA, Verma RS. Structural and functional aspects of nucleolar organizer regions (NORs) in human chromosomes. Int Rev Cytol. 1985;94:151–176. doi: 10.1016/s0074-7696(08)60396-4. [DOI] [PubMed] [Google Scholar]
- Bahr GF, Boccia JA, Engler WF. Reconstruction of a chromosome model from its projections. Ultramicroscopy. 1979;4:45–53. doi: 10.1016/0304-3991(79)90007-x. [DOI] [PubMed] [Google Scholar]
- Beorchia A, Heliot L, Menager M, Kaplan H, Ploton D. Applications of medium-voltage STEM for the 3-D study of organelles within very thick sections. J Microsc. 1992;170:247–258. doi: 10.1111/j.1365-2818.1993.tb03348.x. [DOI] [PubMed] [Google Scholar]
- Boy de la Tour E, Laemmli UK. The metaphase scaffold is helically folded: sister chromatids have predominantly opposite helical handedness. Cell. 1988;55:937–944. doi: 10.1016/0092-8674(88)90239-5. [DOI] [PubMed] [Google Scholar]
- Brinkley BR, Ouspenski I, Zinkowski RP. Structure and molecular organization of the centromere-kinetochore complex. Trends Cell Biol. 1992;2:15–21. doi: 10.1016/0962-8924(92)90139-e. [DOI] [PubMed] [Google Scholar]
- Chan EKL, Imai H, Hamel JC, Tan EM. Human autoantibody to RNA polymerase I transcription factor hUBF. Molecular identity of nucleolus organizer region autoantigen NOR-90 and ribosomal RNA transcription upstream binding factor. J Exp Med. 1991;174:1239–1244. doi: 10.1084/jem.174.5.1239. [DOI] [PMC free article] [PubMed] [Google Scholar]
- Conconi A, Widmer RM, Koller T, Sogo JM. Two different chromatin structures coexist in ribosomal RNA genes through out the cell cycle. Cell. 1989;57:753–761. doi: 10.1016/0092-8674(89)90790-3. [DOI] [PubMed] [Google Scholar]
- Crowther RA, De Rosier DJ, Klug A. The reconstruction of a three-dimensional structure from projections and its application to electron microscopy. Proc R Soc Lond Ser A. 1970;317:319–340. [Google Scholar]
- Dupraw E. Macromolecular organization of nuclei and chromosomes; a folded fiber model based on whole mount electron microscopy. Nature. 1966;206:338–343. doi: 10.1038/206338a0. [DOI] [PubMed] [Google Scholar]
- Filipski J, Leblanc J, Youdale T, Sikorska M, Walker PR. Periodicity of DNA folding in higher order chromatin structures. EMBO J. 1990;9:1319–1327. doi: 10.1002/j.1460-2075.1990.tb08241.x. [DOI] [PMC free article] [PubMed] [Google Scholar]
- Frank J. Electron Tomography: Three Dimensional Imaging with the Transmission Electron Microscope. J. Frank, New York: Plenum Press; 1992. Principles of electron tomography; pp. 1–13. [Google Scholar]
- Gilbert N, Lucas L, Klein C, Menager M, Bonnet N, Ploton D. Three-dimensional co-location of RNA polymerase I and DNA during interphase and mitosis by confocal microscopy. J Cell Sci. 1995;108:115–125. doi: 10.1242/jcs.108.1.115. [DOI] [PubMed] [Google Scholar]
- Goodpasture C, Bloom SE. Visualization of nucleolar organizer regions in mammalian chromosomes using silver staining. Chromosoma. 1975;53:37–50. doi: 10.1007/BF00329389. [DOI] [PubMed] [Google Scholar]
- Gordon R, Bender R, Herman GT. Algebraic reconstruction techniques (ART) for the three-dimensional electron microscopy and x-ray photography. J Theor Biol. 1970;29:471–481. doi: 10.1016/0022-5193(70)90109-8. [DOI] [PubMed] [Google Scholar]
- Haaf T, Hayman DL, Schmid M. Quantitative determination of rDNA transcription units in vertebrate cells. Exp Cell Res. 1991;193:78–86. doi: 10.1016/0014-4827(91)90540-b. [DOI] [PubMed] [Google Scholar]
- Hadjiolov AA. Ribosomal genes. In: Hadjiolov AA, editor. The Nucleolus and Ribosome Biogenesis. Wien, Austria: Springer-Verlag; 1985. pp. 5–51. [Google Scholar]
- Harrison CJ, Britch M, Allen TC, Harris R. Scanning electron microscopy of the G-banded human karyotype. Exp Cell Res. 1981;134:141–153. doi: 10.1016/0014-4827(81)90471-7. [DOI] [PubMed] [Google Scholar]
- Hernandez-Verdun D, Derenzini M. Non-nucleosomal configuration of chromatin in nucleolar organizer regions of metaphase chromosomes in situ. Eur J Cell Biol. 1983;31:360–365. [PubMed] [Google Scholar]
- Holmquist GP. Chromosome bands: their chromatin flavors and their functional features. Am J Hum Genet. 1992;51:17–37. [PMC free article] [PubMed] [Google Scholar]
- Howell WM. The Cell Nucleus. XI. H. Busch and L. Rothblum, New York: Academic Press; 1982. Selective staining of nucleolus organizer regions (NORs) pp. 89–142. [Google Scholar]
- Lucas L, Gilbert N, Ploton D, Bonnet N. Visualization of volume data in confocal microscopy: comparison and improvements of volume rendering methods. J Microsc. 1996;181:238–252. doi: 10.1046/j.1365-2818.1996.117397.x. [DOI] [PubMed] [Google Scholar]
- Manuelidis L. A view of interphase chromosomes. Science. 1990;250:1533–1540. doi: 10.1126/science.2274784. [DOI] [PubMed] [Google Scholar]
- Marsden MPF, Laemmli UK. Metaphase chromosome structure: evidence for a radial loop model. Cell. 1979;17:849–858. doi: 10.1016/0092-8674(79)90325-8. [DOI] [PubMed] [Google Scholar]
- Matsui S, Sandberg AA. Intranuclear compartmentalization of DNA-dependent RNA polymerases: association of RNA polymerase I with nucleolar organizing chromosomes. Chromosoma. 1985;92:1–6. doi: 10.1007/BF00327238. [DOI] [PubMed] [Google Scholar]
- McDowall AW, Smith JM, Dubochet J. Cryo-electron microscopy of vitrified chromosomes in situ. EMBO J. 1986;5:1393–1402. doi: 10.1002/j.1460-2075.1986.tb04373.x. [DOI] [PMC free article] [PubMed] [Google Scholar]
- McEwen BF. Electron Tomography: Three-Dimensional Imaging with the Transmission Electron Microscope. J. Franck, New York: Plenum Press; 1992. Three-dimensional reconstructions of organelles and cellular processes; pp. 281–311. [Google Scholar]
- Monier K, Usson Y, Mongelard, Szepetowski FP, Robert-Nicoud M, Vourc’h C. Metaphase and interphase mapping by FISH: improvement of chromosome banding and signal resolution in interphase nuclei by means of iterative deconvolution. Cytogenet Cell Genet. 1996;72:200–204. doi: 10.1159/000134189. [DOI] [PubMed] [Google Scholar]
- Ochs RL, Press RI. Centromere auto antigens are associated with the nucleolus. Exp Cell Res. 1992;200:339–350. doi: 10.1016/0014-4827(92)90181-7. [DOI] [PubMed] [Google Scholar]
- Paulson JR, Laemmli UK. The structure of histone-depleted metaphase chromosomes. Cell. 1977;12:817–828. doi: 10.1016/0092-8674(77)90280-x. [DOI] [PubMed] [Google Scholar]
- Ploton D, Bobichon H, Adnet JJ. Ultrastructural localization of NOR in nucleoli of human breast cancer tissues using a one-step Ag-NOR staining method. Biol Cell. 1982;43:229–232. [Google Scholar]
- Ploton D, Gilbert N, Menager M, Kaplan H, Adnet JJ. Three-dimensional co-localization of nucleolar argyrophilic components and DNA in cell nuclei by confocal microscopy. The J Histochem Cytochem. 1994;42:137–148. doi: 10.1177/42.2.8288859. [DOI] [PubMed] [Google Scholar]
- Ploton D, Menager M, Jeannesson P, Beorchia A, Adnet JJ. Nuclear Structure and Function, ed J.R. Harris and I.B. Zbarsky, New York: Plenum Press; 1990. Localization of DNA and characterization of argyrophilic structures within nucleolar components during interphase and mitosis in leukemia cell lines; pp. 157–160. [Google Scholar]
- Ploton D, Menager M, Jeannesson P, Himber G, Pigeon F, Adnet JJ. Improvement in the staining and in the visualization of the argyrophilic proteins of the nucleolar organizer region at the optical level. Histochem J. 1986;18:5–14. doi: 10.1007/BF01676192. [DOI] [PubMed] [Google Scholar]
- Ploton D, Thiry M, Menager M, Lepoint A, Adnet JJ, Goessens G. Behaviour of nucleolus during mitosis. A comparative ultrastructural study of various cancerous cell-lines using Ag-NOR staining procedure. Chromosoma. 1987;95:95–107. doi: 10.1007/BF00332182. [DOI] [PubMed] [Google Scholar]
- Poljak L, Kâs E. Resolving the role of topoisomerase II in chromatin structure and function. Trends Cell Biol. 1995;5:348–354. doi: 10.1016/s0962-8924(00)89068-6. [DOI] [PubMed] [Google Scholar]
- Rattner JB, Lin CC. Radial loops and helical coils coexist in metaphase chromosomes. Cell. 1985;42:291–296. doi: 10.1016/s0092-8674(85)80124-0. [DOI] [PubMed] [Google Scholar]
- Robert-Fortel I, Junera HR, Geraud. G, Hernandez-Verdun D. Three-dimensional organization of the ribosomal genes and Ag-NOR proteins during interphase and mitosis in Ptk1 cells studied by confocal microscopy. Chromosoma. 1993;102:146–157. doi: 10.1007/BF00387729. [DOI] [PubMed] [Google Scholar]
- Roussel P, André C, Comai L, Hernandez-Verdun D. The rDNA transcription machinery is assembled during mitosis in active NORs and absent in inactive NORs. J Cell Biol. 1996;133:235–246. doi: 10.1083/jcb.133.2.235. [DOI] [PMC free article] [PubMed] [Google Scholar]
- Roussel P, Hernandez-Verdun D. Identification of Ag-NOR proteins, markers of proliferation related to ribosomal gene activity. Exp Cell Res. 1994;214:465–472. doi: 10.1006/excr.1994.1283. [DOI] [PubMed] [Google Scholar]
- Saitoh Y, Laemmli UK. Metaphase chromosome structure : bands arise from a differential folding path of the highly AT-rich scaffold. Cell. 1994;76:609–622. doi: 10.1016/0092-8674(94)90502-9. [DOI] [PubMed] [Google Scholar]
- Scheer U, Rose KM. Localization of RNA polymerase I in interphase cells and mitotic chromosomes by light and electron microscopic immunocytochemistry. Proc Natl Acad Sci USA. 1984;81:1431–1435. doi: 10.1073/pnas.81.5.1431. [DOI] [PMC free article] [PubMed] [Google Scholar]
- Sedat J, Manuelidis L. A direct approach to the structure of eukaryotic chromosomes. J Cell Biol. 1977;42:331–350. doi: 10.1101/sqb.1978.042.01.035. [DOI] [PubMed] [Google Scholar]
- Sibon OCM, Cremers FFM, Humbel BM, Boonstra J, Verkleij AJ. Localization of nuclear RNA by pre and post embedding in situ hybridization using different gold probes. Histochem J. 1995;27:35–45. doi: 10.1007/BF00164170. [DOI] [PubMed] [Google Scholar]
- Sikorav JL, Jannink G. Kinetics of chromosome condensation in the presence of topoisomerases: a phantom chain model. Biophys J. 1994;66:827–837. doi: 10.1016/s0006-3495(94)80859-8. [DOI] [PMC free article] [PubMed] [Google Scholar]
- Sumner AT. The nature and mechanisms of chromosome banding. Cancer Genet Cytogenet. 1982;6:59–87. doi: 10.1016/0165-4608(82)90022-x. [DOI] [PubMed] [Google Scholar]
- Sumner AT. Classification and nomenclature of chromosome bands. In: Sumner AT, editor. Chromosome Banding. London: Unwin Hyman; 1992. pp. 9–20. [Google Scholar]
- Sumner AT. Functional aspects of the longitudinal differentiation of chromosomes. Eur J Histochem. 1994;38:91–109. [PubMed] [Google Scholar]
- Thiry M, Goessens G R.G. Landes Company, editors. Molecular Biology Intelligence Unit. Location: Springer-Verlag; 1996. The nucleolus during the cell cycle. [Google Scholar]
- Thiry M, Ploton D, Menager M, Goessens G. Ultrastructural distribution of DNA within the nucleolus of various animal cell lines or tissues revealed by terminal deoxynucleotidyl transferase. Cell Tissue Res. 1993;271:33–45. doi: 10.1007/BF00297539. [DOI] [PubMed] [Google Scholar]
- Turner JN, Collins DN. Three-dimensional imaging at high resolution: high-voltage electron microscopy. J Histotechnol. 1990;13:93–107. [Google Scholar]
- Verma RS, Babu A. Human Chromosomes: Principles and Techniques. R.S. Verma and A. Babu, New York: McGraw–Hill; 1995. [Google Scholar]
- Warburton D, Henderson AS. Sequential silver staining and hybridization in situ on nucleolus organizing regions in human cells. Cytogenet Cell Genet. 1979;24:168–175. doi: 10.1159/000131373. [DOI] [PubMed] [Google Scholar]
- Weisenberger D, Scheer U. A possible mechanism for the inhibition of ribosomal RNA gene transcription during mitosis. J Cell Biol. 1995;129:561–575. doi: 10.1083/jcb.129.3.561. [DOI] [PMC free article] [PubMed] [Google Scholar]
- Woodcock CL. Electron Tomography: Three-Dimensional Imaging with the Transmission Electron Microscope. J. Frank, New York: Plenum Press; 1992. The organization of chromosomes and chromatin; pp. 313–357. [Google Scholar]
- Woodcock CL, Horowitz RA. Chromatin organization re-viewed. Trends Cell Biol. 1995;5:272–277. doi: 10.1016/s0962-8924(00)89038-8. [DOI] [PubMed] [Google Scholar]
- Yamada E, Ishikawa H. Dense tissue and special stains. Methods Cell Biol. 1981;22:123–145. doi: 10.1016/s0091-679x(08)61873-7. [DOI] [PubMed] [Google Scholar]
- Zatsepina OV, Voit R, Grummt I, Spring H, Semenov MV, Trendelenburg MF. The RNA polymerase I specific transcription initiation factor UBF is associated with transcriptionally active and inactive ribosomal genes. Chromosoma. 1993;102:599–611. doi: 10.1007/BF00352307. [DOI] [PubMed] [Google Scholar]