

Abstract
Understanding the interaction of nanoparticles (NPs) with the cell membrane and their trafficking through cells is imperative to fully explore the use of NPs for efficient intracellular delivery of therapeutics. Here, we report a novel method of measuring the force of NP-cell membrane interactions using atomic force microscopy (AFM). Poly(dl-lactide co-glycolide, PLGA) NPs functionalized with poly-l-lysine were used as a model system, to demonstrate that this force determines the adhesive interaction of NPs with the cell membrane and in turn the extent of cellular uptake of NPs, and hence that of the encapsulated therapeutic. Cellular uptake of NPs was monitored using AFM imaging, and the dynamics of their intracellular distribution was quantified using confocal microscopy. Results demonstrated that the functionalized NPs have a five-fold greater force of adhesion with the cell membrane and the time-lapse AFM images show their rapid internalization than unmodified NPs. The intracellular trafficking study showed that the functionalized NPs escape more rapidly and efficiently from late endosomes than unmodified NPs and result in 10-fold higher intracellular delivery of the encapsulated model protein. The findings described herein enhance our basic understanding of the NP-cell membrane interaction on the basis of physical phenomena that could have wider applications in developing efficient nanocarrier systems for intracellular delivery of therapeutics.
Keywords: polymers, sustained release, nanocarriers, cellular uptake, drug efficacy, atomic force microscopy
1. Introduction
The process of transporting certain therapeutic agents into cells can be highly inefficient either because of the agents' physicochemical characteristics (e.g., large molecular size or poor stability) or because of the membrane-associated and intracellular barriers (e.g., efflux pumps such as P glycoprotein [P-gp] or multidrug resistance-associated protein [MRP]; and escape from endosomes, respectively). Nanocarriers have been extensively investigated to overcome these barriers to facilitate intracellular delivery of therapeutics [1-4]. The interaction of nanocarriers with cell membrane is an important determinant in their cellular internalization, which could depend on various factors such as nanocarrier size and surface characteristics (e.g., charge, targeting ligand, etc.), as well as on the cell membrane components. Following cellular uptake, the subcellular sorting of nanocarriers into different intracellular compartments and retention could depend on their interaction with the components of endocytic machinery, cytoskeletal components and subcellular organelles. Though functionalization of nanocarriers is increasingly explored, successful development of efficient nanocarriers is hindered by a limited understanding and the lack of methods for assessment of the nanocarrier interaction with cellular components as well as their intracellular trafficking. A method that can directly characterize and quantitatively measure the interaction of nanocarriers with cell membrane could provide insight into the role of these interactions on cellular uptake and intracellular disposition of nanocarriers.
We have devised a novel approach to evaluate the interaction of nanocarriers with cell membrane. We also demonstrated the influence of such interactions on cellular uptake and intracellular sorting of nanocarriers, along with the delivery of encapsulated therapeutic agents. We used biodegradable nanoparticles (NPs) formulated with poly-(dl-lactide co-glycolide) (PLGA) polymers as a model system because of its wide use in drug delivery [5]. However, our previous studies have shown that these NPs undergo exocytosis to the extent of ∼85% i.e., particles are internalized but they exit the cells without releasing their content [6], but the fraction of NPs that escapes from the endosomes to the cytosolic compartment was shown to be retained inside the cells and release the encapsulated agent slowly [7]. Thus, endosomal sequestration and exocytosis of NPs could be limiting factors in the intracellular delivery of therapeutics.
In this study, we functionalized PLGA-NPs with poly-l-lysine (PLL) to determine the effect of this surface modification on the force of interaction with cell membrane and to study how it influences the cellular uptake and intracellular trafficking of NPs and the delivery of an encapsulated therapeutic agent. We selected PLL, a cationic polypeptide, because it has been shown to interact favorably with cell membrane; attributed to either its electrostatic interactions with cell membrane [8] or its influence on the properties of lipid bilayers [9]. Owing to its α-helical conformation, PLL can insert between the lipid bilayers of cell membranes, thus modifying the microviscosity and stabilizing the stacking properties of membranes [9, 10]. We have developed a simple method to measure the force of interaction between the surface of NPs and cell membrane using atomic force microscopy (AFM) and demonstrated that this force determines the adhesive interaction of NPs with cell membranes and hence determines the extent of cellular uptake of both NPs and the encapsulated therapeutic agents. We discuss the future applications of this AFM setup to enhance our basic understanding of the NP-cell membrane interaction, particularly in determining the effect of functionalization of NPs with different targeting ligands (such as antibody or peptide) and their overall role in drug delivery.
2. Materials and methods
2.1. Materials
Poly-(dl-lactide co-glycolide) (PLGA, 50:50 lactide-glycolide ratio, inherent viscosity 1.32 dL/g in hexafluoro-isopropanol at 30 °C) was purchased from Birmingham Polymers (Birmingham, AL). Bovine serum albumin (BSA, Fraction V), poly vinyl alcohol (PVA, average molecular weight 30,000-70,000), poly-L-lysine hydro bromide (PLL.HBr, average molecular weight 30,000-70,000), peroxidase from horse radish (HRP, Type VI-A, molecular weight 44,000), and SIGMAFAST™ OPD were purchased from Sigma (St. Louis, MO). Texas red labeled dextran (molecular weight 10,000; lysine fixable), Texas red labeled transferrin, and ProLong® Gold antifade reagent were purchased from Molecular Probes (Eugene, OR). 6-Coumarin was purchased from Polysciences Inc. (Warrington, PA) and DAB/Ni2+ substrate from Vector Labs (Burlingame, CA). Chambered cover glass slides were purchased from LabTek (Rochester, NY). All cell culture reagents were purchased from Gibco-BRL (Grand Island, NY). BCA protein assay kit was purchased from Pierce (Rockford, IL). AFM probe tips were purchased from Veeco/Digital Instruments Inc. (Santa Barbara, CA). All other chemicals and reagents were from Fisher Scientific (Pittsburgh, PA). All aqueous solutions were prepared with deionized and distilled water (Labconco Co., Kansas City, MO).
2.2. Formulation and characterization of nanoparticles
NPs were formulated with PLGA using a double emulsion solvent evaporation technique, as described previously [11]. NPs were characterized for particle size, polydispersity, zeta potential, and for the presence of different functional groups on the NP surface (see Supplementary Methods).
2.3. Atomic force microscopy (AFM)
We operated a commercial Molecular Force Probe 3D system (MFP-3D, Asylum Research, Santa Barbara, CA) for all our studies involving AFM. Silicon nitride (Si3N4) AFM probe tips were washed by immersing them in ethanol for 30 min and then activated by ultraviolet treatment for 30 min (CL-1000 UV CrossLinker, Ultra Violet Products Limited, Camridge, England). Activated tips were used for imaging and coated with NP formulations for force spectroscopy. Spring constants for each cantilever were determined using the thermal noise method with the MFP-3D instrument. All experiments were performed at ambient temperature and atmospheric pressure.
2.4. Time-lapse AFM imaging of live cells
AFM images of live-cell surfaces were acquired in AC (Alternating Current; tapping) mode in liquid (serum-free medium; SFM) using clean Si3N4 probe tips with spring constants of 40-60 pN/nm and an average resonance frequency of 9 kHz. Briefly, cells were grown on a glass slide and then placed on the x-y piezo stage of MFP-3D instrument. Viewing the optical objective (positioned at the bottom of the MFP-3D instrument) assisted in positioning cantilevers to face the cells, and a 90 × 90 μm image was acquired to locate individual cells. The cantilever was subsequently moved to the surface of cells to be imaged and 2 × 2 μm images were acquired at a minimal scan rate of 2 Hz. NPs suspended in SFM were added onto the cells, and continuous time-lapse images (in the height, amplitude and phase modes) were acquired at the same surface location of cells for 20 min. Image analysis was performed using Femtoscan software (Advanced Technologies Center, Moscow, Russia).
2.5. Force measurements
AFM probe tips were coated with NPs (see Supplementary Methods) and the force of interaction between these probes and cell membrane was directly measured using AFM as a function of their separation distance. Initially, cells were washed with serum-free cell culture medium (SFM) to ensure that proteins present in serum did not affect the results of the force measurements. The cantilevers were carefully positioned on top of the cells with visual guidance from the optical view. NP-coated AFM probe tips were guided to the cell surface, and force measurements were recorded at a loading rate of 2.8 × 10⁴ pN/s (loading rate is the product of cantilever spring constant and retraction velocity). Force curves were collected on multiple cells; typically 50-60 force curves were measured on a single cell, and a total of 500-600 force curves were collected for tips coated with either the functionalized or unmodified NP formulation. Throughout the experiment, cells were monitored with the help of the optical objective equipped with the AFM. For analysis of force curves, the IGOR Pro 5.03 (WaveMetrics, Portland, OR) software package was used.
2.6. Cellular uptake and intracellular trafficking of NPs
Cells were incubated with a suspension of fluorescently labeled NPs in cell culture medium for 2 hr. Cells were then washed with cold phosphate-buffered saline (PBS), lysed, and cell lysates were analyzed for the levels of NPs by high-performance liquid chromatography (HPLC), as described by our previously published method [12]. Results of NP uptake were expressed as micrograms of NPs per milligrams of total cell protein. For intracellular trafficking studies, cells grown on coverslips were incubated with fluorescently labeled NPs and fluorescent markers for early endosome (EE) and late endosome (LE) at 37 °C for different time intervals (5-60 min). At each time point, cells were washed with ice-cold PBS, fixed with 4% paraformaldehyde solution, and mounted on glass slides using ProLong® Gold antifade medium. Fixed cells were visualized under a confocal microscope (Zeiss LSM410, Carl Zeiss Microimaging, Thornwood, NY) equipped with an argon-krypton laser. To quantitate the subcellular distribution of NPs, image analysis was performed using ImageJ software (NIH) (as described in Supplementary Methods).
2.7. Intracellular delivery of a model protein using NPs
Cells were incubated with horse radish peroxidase (HRP) (dissolved in cell culture medium) or HRP-loaded NPs for 24 hr. Medium was changed after 24 hr and then on every alternate day. After 1, 3, and 5 days, cells were analyzed for HRP activity using the SIGMAFAST™ OPD colorimetric assay. The amount of active HRP was normalized to the total cell protein and expressed as nanograms per milligram of cell protein. To stain active HRP enzyme present in the cells, additional cells were treated with HRP-loaded NPs or HRP solution as described above, fixed and incubated with DAB/Ni2+ substrate (for details see Supplementary Methods).
3. Results and Discussion
3.1. Formulation and characterization of NPs
PLL-functionalized PLGA-NPs were formulated by the addition of PLL to the external aqueous phase (containing PVA) during the NP-formulation procedure. NPs formulated with PVA alone were designated as unmodified NPs; while those prepared in combination with PLL as functionalized NPs. PVA (an emulsifier) provides steric stability to NPs to prevent their aggregation, and PLL presents functional groups (amino) at the NP surface. PVA and PLL being amphiphilic, anchor onto the PLGA polymer via their hydrophobic segments, which penetrate and remain entrapped in the polymeric matrix, thus presenting hydroxyl and amino groups on the surface of NPs (Supplementary Information Fig. S1a). Fourier transform infrared (FTIR) spectra indicated characteristic N-H stretch peaks and thus confirmed the presence of amino groups on the surface of the functionalized NPs (Supplementary Information Fig. S1b). X-ray photoelectron spectroscopy (XPS) confirmed the presence of nitrogen on the surface of functionalized NPs (0.24%; N was detected as N1s peak at 398.4 eV) (Supplementary Information Fig. S1c-d). Both PLL-functionalized and unmodified NPs showed similar hydrodynamic diameters (290-310 nm; polydispersity <0.20) and zeta potential (-10 mV) at neutral pH. However, due to the presence of amino groups, functionalized NPs showed greater cationization in the acidic pH range (pH ∼4) than unmodified NPs (Supplementary Information Fig. S1e).
3.2. Time-lapse AFM imaging of live cells
AFM imaging was used to monitor dynamic changes on the cell surface as a result of interaction with NPs. Using AFM, one can visualize surface-dependent molecular events in three dimensions on a nanometer scale in an aqueous environment [13-16]. AFM has been extensively used to image cells in living and fixed states [17-19]. Imaging fixed cells (in air) is relatively easier than imaging live cells (in liquid); however, such imaging cannot be used to view dynamic changes in the topology of cells because fixation introduces many image artifacts resulting from cross-linkage of the membrane proteins. Thus, to monitor the real-time dynamics of changes at the cell surface following interaction with NPs, time-lapse images of live cells were acquired at a slow scanning speed in AC (tapping) mode. In tapping mode, a high-frequency z-oscillation of the tip is used with normal x-y scanning; rendering only intermittent contact of the probe tip with cells, thus minimizing the destructive, shear forces to cells [20, 21]. As a control, the cell surface was subjected to continuous imaging for 20 min without the addition of NPs; there were no significant changes either in topography (i.e., pits or folds) or surface roughness of cells. Following AFM imaging, cell viability was confirmed using the Trypan-blue exclusion assay (See Supplementary Information Table S1). These results established that the cells did not undergo any topographical or viability changes under imaging conditions; consistent with other reports [21].
To study the effects of NP interactions on cell surface topology, imaging was performed on cells supplemented with a suspension of NPs at low concentration (80 μg/ml), serving to not saturate the cellular uptake of NPs (∼500 μg/ml) [6]. Time-lapse images showed the eventual disappearance of NPs from cell surfaces when cells were incubated with functionalized NPs for 20 min, whereas cell surfaces remained covered with NPs when the same experiment was carried out with unmodified NPs (Fig. 1A(a-j)). These results indicated more rapid cellular internalization of functionalized NPs than unmodified NPs. We also noticed that the cells incubated with functionalized NPs showed wrinkles on the cell surface following their internalization (Fig. 1A(b) vs.1A(j)). All the time-lapse images (in height mode) were processed and analyzed using Femtoscan software. Cross sections of the images were generated along 10 different transects across the image (Fig. 1B(a)), and the cross-sectional view was used to determine the elevations of NPs positioned on the cell surface. The average height of NPs at any time point was calculated from the mean of heights of 5-6 NPs on each of these 10 lines (Fig. 1B(b)). The average height of unmodified NPs on the cell surface was determined to be 22 nm, compared to only 12 nm for the functionalized NPs on cell surface (5 min post-incubation with NPs; Fig. 1C). After an initial increase at 5 min, the height of unmodified NPs on cell surface did not change significantly, whereas that of the functionalized NPs continued to decrease (Fig. 1C). A similar trend was observed with the average surface roughness of the cells determined using the Femtoscan software. The cells incubated with unmodified NPs showed greater cell surface roughness than those incubated with functionalized NPs (Fig. 1D). Further, the surface roughness of the cells incubated with unmodified NPs decreased slowly after an initial increase at 5 min post incubation with NPs whereas that of the cells incubated with functionalized NPs decreased more rapidly and eventually reached the surface roughness of control cells (cells which were not incubated with NPs). The results thus demonstrate the rapid disappearance of functionalized NPs from the cell surface due to their cellular internalization whereas the slow decrease in surface roughness of the cells incubated with unmodified NPs suggest their relatively slow cellular internalization, and persistent presence on the cell surface (Fig. 1). Although clearly visible, the height and surface analysis data also suggest that the wrinkles seen on the surface of the cells incubated with functionalized NPs are insignificant in magnitude as these values are close to that for normal cells (in the absence of NPs). The images of the cell surface taken at different time points following incubation of NPs capture the process of NP internalization (Fig. 2a, b, c, d) and show formation of a typical endocytic pit on the cell surface, which “healed” to generate a normal-looking cell surface (Fig. 2e-f). The overall observations thus clearly demonstrate a distinctly different dynamic pattern of interactions of functionalized NPs with the cell membrane than that with unmodified NPs.
Figure 1.
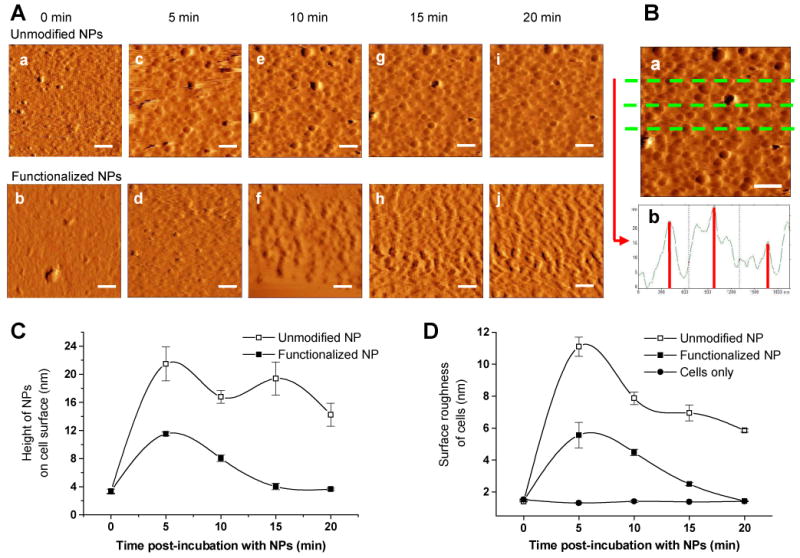
(A) Time lapse AFM imaging. Images of cell surface incubated with unmodified NPs (a, c, e, g, i) and functionalized NPs (b, d, f, h, j). AFM images (amplitude traces) of the cell surface immediately prior to addition of NPs (a, b), and after incubation with NPs for 5 min (c, d), 10 min (e, f), 15 min (g, h) and 20 min (i, j). All images are 2 × 2 μm, acquired in tapping mode in liquid. Scale bar represents 300 nm. (B) Image analysis. (a) AFM image of cell surface 15 min after incubation with unmodified NPs. Image is 2 × 2 μm, acquired in tapping mode in liquid. Scale bar represents 300 nm. (b) Section analysis along the green lines in a. Cell surface topology: effect of incubation with NPs. (C) Average height of NPs on the cell surface was calculated from the section analysis at different times of incubation with NPs. Data is presented as mean ± standard deviation. (D) Average roughness of the cell surface as determined using Femtoscan software was plotted for incubation of cell surface with unmodified and functionalized NPs. Data are presented as mean ± standard deviation.
Figure 2. Dynamic changes on cell surface after incubation with NPs.
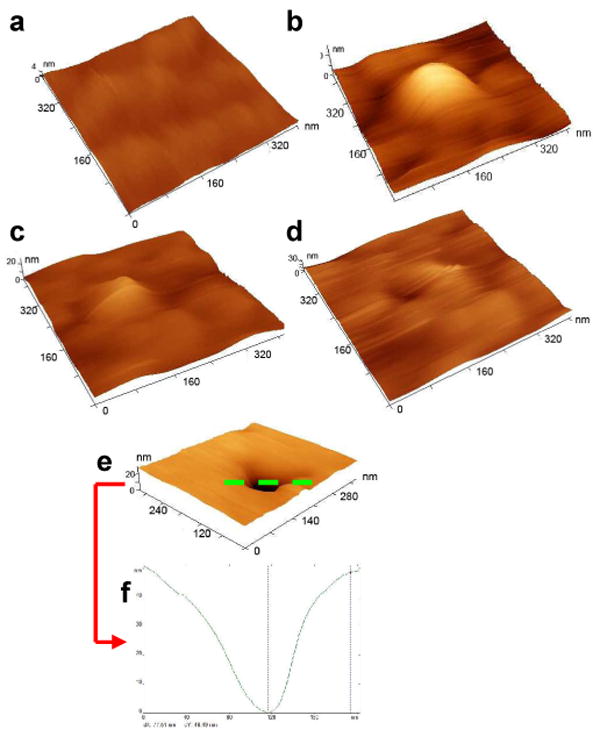
Three-dimensional images of cell surface before (a) and after incubation with NPs for 10 min (b), 15 min (c) and 20 min (d). All AFM images shown are cropped 400 × 400 nm images from the 2 × 2 μm images acquired in tapping mode in liquid. (e, f) Formation of endocytic pit on cell surface. (e) Three-dimensional image of cell surface showing a typical pit formed on the surface after incubation with NPs. (f) Section analysis along the green line in e. The AFM image shown is a cropped 300 × 300 nm image from the 2 × 2 μm image acquired in liquid. The three-dimensional views were generated using Femtoscan software.
3.3. Force measurements
To quantitate the force of interaction between the surface of NPs and the target cell membrane, we performed force-distance measurements on live cells using AFM probe tips coated with NPs (Fig. 3a). Cells typically from passages 4-8 were used to minimize variations resulting from growing conditions, such as age-related alterations in morphology, viscoelasticity and orientation of molecules on the cell surface that are responsible for adhesion to NPs [22]. Forces between the NP-coated AFM tip and cells were acquired at the nucleus, which is the highest position within a cell and can easily be visualized using AFM and optical microscopy, thus providing a defined area for probing the cells. A typical force-distance curve obtained using this experimental setup showed these common features (Fig. 3b). At point A, no repulsion or attraction was observed as the NP-coated AFM tip approached the cell surface. The AFM tip started to compress the cell surface at point B, where a short-range repulsive force was observed due to steric repulsion presented by the viscoelastic surface of the cell [23]. When the NP-coated tip was retracted from the cell surface, strong adhesion forces were measured at point C; however, significant differences were observed in the retraction curve for the two kinds of NPs. Unmodified NPs showed a sharp single adhesion peak at around 300 nm separation distance between the tip and the cell surface (Fig. 3c, inset), which signifies the rupture of the adhesive binding between the NP-coated tip and the cell surface. Functionalized NPs showed multiple adhesion peaks at separation distances of 200 to 500 nm (Fig. 3d, inset). The presence of multiple peaks with a typical saw-tooth-like pattern indicates the unbinding of multiple adhesive bonds between the NP-coated tip and the cell surface, which were sequentially broken during retraction of the tip. Similar force curves have been reported for the multiple interactions between concavalin A- (ConA)-functionalized AFM tips and ConA receptors present on fibroblast cells [24, 25]. At further separation distances (point D), no adhesion forces were observed, indicating that the NP-coated tip had retracted completely from the surface of the cell.
Figure 3. Measurement of force of interaction between NPs and live cells.
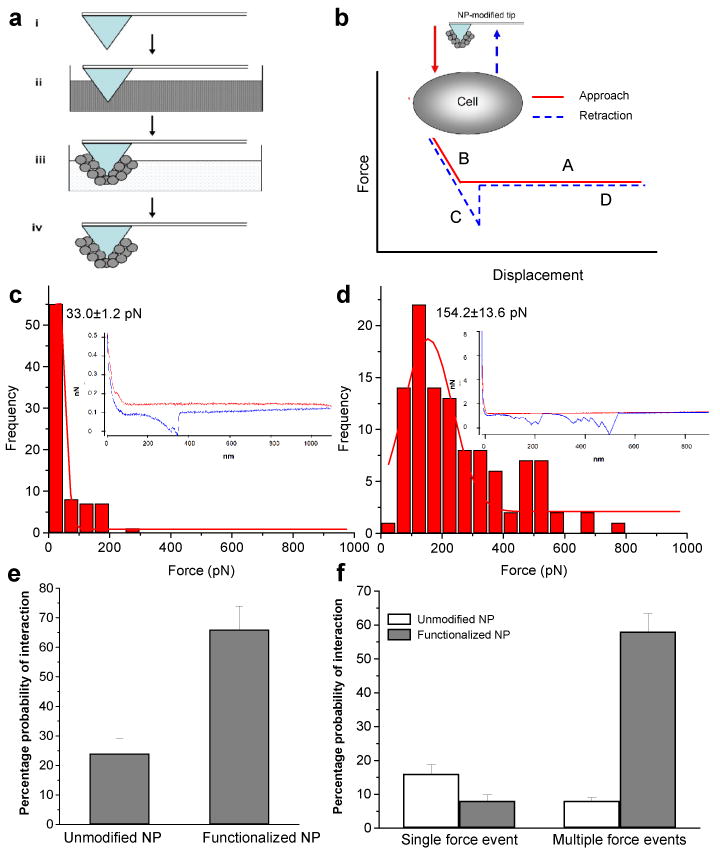
(a) Schematic representation of the process of coating AFM tip with NPs. (i) Uncoated AFM tip, (ii) AFM tip placed in the NP formulation; chloroform was evaporated under vacuum, (iii) AFM tip was washed with water and dried in argon gas, and (iv) AFM tip coated with NPs (b) Diagram of a typical force curve (red solid line: approach curve; blue dashed line: retraction curve). The x-axis represents displacement and the y-axis represents force calculated as the product of spring constant of the cantilever and the cantilever deflection. Inset, schematic representation of the setup for collection of force curves on the cell surface with AFM tip coated with NPs. Typical/representative force curve for AFM tip coated with unmodified NPs (c, inset) and functionalized NPs (d, inset). Analysis of force distributions for unmodified NPs (c) and functionalized NPs (d). Probability of interaction of NP-coated tip and cell surface was calculated as the percentage of force curves that showed interactive forces of the total forces collected with the tip (e). Probability of occurrence of single and multiple force events was calculated for the unmodified and functionalized NPs (f). Data are presented as mean ± standard deviation.
The NP-coated tip was used to collect successive force curves (∼500) following the same pattern as represented in the insets of Figure 3c-d, without any contamination of the tip with cellular proteins. Quantification of the force of interaction demonstrated significant differences in the relative adhesion force of the two formulations of NPs with cell surfaces (Fig. 3c-f). The adhesion force measured with unmodified NPs was 280 pN (maximum) and 20 pN (minimum); the force of functionalized NPs was 1200 pN (maximum) and 50 pN (minimum). Typically, the force values obtained from 500 force curves were compiled in force distribution histograms and the most probable force of interaction was defined by the maximum of the Gaussian fit to each histogram. The probability of interaction of each NP-coated tip and cell membrane was calculated as the percentage of force curves that showed interactive forces of the total (n = 500) force curves collected with the tip. Functionalized NPs demonstrate greater adhesion (five-fold) toward cell membrane and interact more favorably (66%, Fig. 3e) showing multiple interactions with the most probable force of 154 pN (Fig. 3d); unmodified NPs show fewer interactions (22%, Fig. 3e) with an adhesion force of 33 pN (Fig. 3c). Further, the functionalized NPs showed a 6-fold higher probability for multiple adhesion events with cell membrane than unmodified NPs (Fig. 3f). The adhesion forces observed in these experiments can be ascribed to nonspecific binding of NP surfaces with the molecules present on cell surfaces. Cell membranes are hydrophilic and negatively charged from their glycocalyx, a network rich in polysaccharide and protein units. Because the surfaces of both types of NPs were negatively charged at neutral pH (experimental conditions), we do not expect that the adhesion forces arise from electrostatic interactions. However, the strong adhesion forces seen in PLL-functionalized NPs suggest that these adhesions may be arising from nonspecific binding events, such as hydrogen-bonding of amino and hydroxyl groups with either the sugar or protein units present in cell membrane. It would be interesting to delineate the specific kind of interaction forces at the molecular level, by probing supported lipid bilayers (incorporated with one or more membrane proteins) with the NP-tip. It would be of further interest to determine the effect of different retraction velocities of the NP-tip on the pattern and magnitude of adhesion force. Depending on the elasticity of cell membrane, an increase in the loading rate can influence the depth of cell membrane indentation by the NP-tip, and thus can potentially affect the magnitude of the force of interaction [26]. Nonetheless, in our study, the Gaussian histograms of forces (Fig. 3c-d) reveal clear differences between the adhesion interactions of unmodified and functionalized NPs with cell membrane.
3.4. Uptake and dynamics of intracellular trafficking of NPs
To determine the practical implications of this difference in the force of NP-cell membrane interaction, we evaluated the extent of cellular uptake and intracellular trafficking of NPs using a formulation of NPs containing a green fluorescent dye (6-coumarin). The incorporated dye acts as a probe for NPs and hence can be used to quantitatively determine the amount of cellular uptake of NPs [27]. PLL-functionalized NPs showed a three-fold greater cellular uptake compared to unmodified NPs (Fig. 4a). As both formulations were similar in size and surface charge, differing only with respect to the functional groups present on the NP surface; the increase in cellular uptake can be attributed to the difference in the force of NP-cell membrane interactions. Following cellular internalization (via endocytosis), NPs have been shown to undergo surface-charge reversal (anionic to cationic) in the acidic pH of late-endosomes, thus facilitating their escape into the cytosolic compartment (Fig. 4b) [28]. However, as mentioned before, inefficient escape of NPs from endosomes to cytosolic compartment, results in exocytosis of a significant fraction of internalized NPs [6], thus limiting the intracellular delivery of therapeutics. Rapid cationization of surface-functionalized NPs selectively in the acidic pH of endo-lysosomes can facilitate the escape of NPs into the cytosolic compartment (Supplementary Information Fig. S1e). Confocal laser scanning microscopy was used for quantitative evaluation of the relative amounts of NPs localized in various subcellular compartments after endocytosis of NPs. Cells were incubated with fluorescently labeled (green) NPs (Fig. 4c) and Texas red labeled endosomal markers (Fig. 4d); co-localization of NPs in endosomes was observed (as yellow) from the overlap of green and red images (Fig. 4e). Figure 4f shows a schematic illustrating the method used to quantify subcellular distribution of NPs. Results from these studies demonstrated a two- to three-fold greater cytoplasmic localization of functionalized NPs than unmodified NPs, suggesting the differences in dynamics of intracellular trafficking of the two formulations of NPs (Fig. 4). NP levels in EE increased through 10 and 20 min of incubation of cells with functionalized and unmodified NPs, respectively (Fig. 4g). This was followed by a decrease in NP levels in EE, as NPs progressed into LE. Levels of functionalized NPs in LE decreased sharply during first 20 min of incubation, whereas unmodified NPs demonstrated a slow gradual escape from LE after 30 min of incubation with NPs (Fig. 4h). Escape of NPs from LE was demonstrated by a decrease in the NP levels in LE, resulting in an increase in the NP levels in cytoplasm. Functionalized NPs demonstrated a relatively rapid and greater escape from the LE into the cytosolic compartment than unmodified NPs (Fig. 4i). Thus, selective modulation of NP surface charge (at acidic pH) from PLL-functionalization can govern the dynamics of subcellular sorting of NPs.
Figure 4. Cellular uptake of nanoparticles.

(a) Uptake of functionalized and unmodified NPs. A formulation of NPs containing a fluorescent dye (6-coumarin) that acts as a probe for NPs was used to quantitatively determine the cellular uptake of NPs using HPLC. Amount of NPs analyzed by HPLC was normalized to the total cell protein. Data are presented as mean ± standard deviation, n = 6. (*) p < 0.05. (b) Schematic representation of the process of intracellular trafficking of NPs following endocytosis (EE, early endosome; Lys, lysosome; RE, recycling endosome). Representative confocal microscopic images of cells incubated with green, fluorescently labeled NPs and Texas red transferrin. (c) Green fluorescence arising from the cellular internalization of NPs. (d) Red fluorescence arising from the presence of Texas red transferrin in EE. (e) Co-localization of NPs in endosomes is shown in yellow (from the overlap of green and red images). (f) Schematic illustrating the method used to quantify subcellular distribution of NPs. The pixel areas for cellular (fluorescein filter) and endosomal (co-localized with endosomes) content of NPs were determined in each x-y plane and were denoted as Az (cellular) and Az (endosomal). The fraction of NPs escaping into the cytosol was indicated by the pixel area Az (cytosol) and was calculated as Az (cytosol) = [Az (cellular)] – [Az (endosomal)]. The values of Az (cytosol) and Az (endosomal) were summed for all the z-sections and denoted as A (cytosol) and A (endosomal), respectively. Subcellular distribution of NPs: confocal microscopy. (g) NP levels in EE. (h) NP levels in LE. (i) Localization of NPs in the cytoplasm of cells. Data are presented as mean ± standard deviation, n=15. Open circles represent unmodified NPs and solid circles represent functionalized NPs.
3.5. Intracellular delivery of a model protein using NPs
To evaluate the efficiency of surface-functionalized NPs for intracellular delivery of therapeutics, NPs encapsulating the model protein-HRP were prepared. Intracellular levels of active HRP enzyme were sustained for 5 days with functionalized NPs. In contrast, levels dropped rapidly in cells treated with HRP solution upon exchange with fresh medium (without HRP) on the second day. HRP-loaded, functionalized NPs demonstrated 10-fold greater levels of active HRP enzyme in cells compared to that with unmodified NPs and protein in solution (Fig. 5). Since the amount of HRP protein loaded into NPs and that released from the NPs was the same, greater intracellular delivery of HRP via functionalized NPs opposed to unmodified NPs, can be ascribed to the combined effects of their greater cellular uptake (owing to the higher force of the NP-cell membrane interaction) and greater endosomal escape (due to modulation of the surface charge).
Figure 5. Sustained cytoplasmic delivery of model protein HRP.
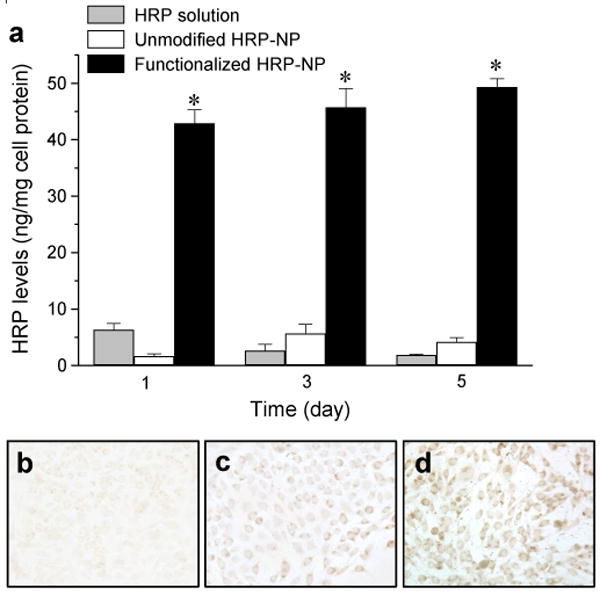
Cells were incubated with a 4-μg dose of HRP either in solution or encapsulated in NP formulations for 24 hr. Medium was changed after 24 hr and then every alternate day. (a) After 1, 3 and 5 days, cells were washed and lysed, and their HRP levels were determined by activity assay (OPD colorimetric assay) of HRP. Amount of active HRP was normalized to the total cell protein. Data are presented as mean ± standard deviation, n = 6, (*) p < 0.05. After 5 days, cells were washed with PBS, fixed and incubated with DAB/Ni2+ substrate to stain active HRP enzyme in (b) cells treated with HRP solution, (c) HRP-loaded unmodified NPs, and (d) HRP-loaded functionalized NPs.
Our findings suggest that the force of NP-cell membrane interactions measured using AFM provides a measure of the adhesive interaction of PLGA-NPs with cell membrane, which further determines the extent of intracellular delivery of the encapsulated therapeutic agent. The method can be easily adopted for determining the force of interaction of different types of nanocarriers with cell membranes. NPs can either be glued to the AFM probe tips by means of epoxy glue [29, 30] or can be covalently attached to the chemically functionalized AFM tips. The latter can be achieved either by attaching NPs directly to the specific functional groups (e.g., OH, COOH or NH2) on the AFM tip or by means of a distensible cross-linker (usually poly-ethyleneglycol) attached to the functionalized tip [31]. Chemical functionalization of AFM tips is routinely used for tethering proteins or DNA molecules to the tip, and includes formation of self-assembling monolayers of alkanethiols on gold coated tips [32] or amino-functionalization of tips [33]. Thus, appropriate selection of functionalization chemistry and tip geometry can be used to prepare NP-terminated AFM tips for wide range of NP sizes [34].
In addition to other formulation parameters (such as size, surface charge etc.), force of interaction measured using this method can play a significant role to optimize nanocarriers for functionalization with different targeting ligands, such as antibody or peptides, to facilitate the intracellular delivery of encapsulated therapeutics. It is also possible that the force of interaction could subsequently affect the mode of cellular internalization (i.e., type of endocytosis), subcellular sorting, and intracellular retention of nanocarriers. For instance, our previous studies have shown that the conjugation of transferrin molecules on NP surface results in reduced exocytosis and a greater intracellular retention of the loaded therapeutic agent as compared to that with unconjugated NPs, suggesting that the route of entry of nanocarriers affects their intracellular sorting [35]. Indirect methods (such as confocal microscopy or binding studies) or in vivo biodistribution studies have been used to evaluate the effects of surface-functionalization of nanocarriers on nanocarrier-cell membrane interactions. Though, AFM imaging has been used to study surface interaction (pore-formation) of dendrimers with supported lipid bilayers [36], the method described herein measures the force of interaction of NPs with live cell membranes, and provides a direct and quantitative parameter for evaluating the nanocarrier-cell membrane interactions.
Another potential application of our method could be determination of the efficacy of a particular targeting ligand (e.g., the sequence of the targeting or cell-penetrating peptides and concentration) based on the force of interaction with cell membrane. Using this method, experiments can be designed to establish a correlation between the force of interaction and the cell-internalization efficiency of NPs functionalized with targeting ligands. Further, it is anticipated that the force of interaction with cell membrane would depend on the membrane composition. Based on the relative force of interaction of a nanocarrier with different cell membranes (e.g., healthy vs. cancer cells), one may be able to design targeted nanocarrier systems. This can also be used to optimize the surface of nanocarriers to impart long-circulation times by minimizing their interaction with cells such as the macrophages and thus avoiding clearance by reticulo-endothelial system (RES). The data with different systems are necessary to generalize the applications of our technique of force measurement and its significance in designing of effective nanocarriers.
4. Conclusions
A novel method to quantitatively measure the force of NP-cell membrane interactions using atomic force microscopy was developed to demonstrate that this force determines the adhesive interaction of NPs for the cell membrane and in turn the extent of cellular uptake of NPs, and hence that of the encapsulated therapeutic. Exploration of this technique shows promise to increase our basic understanding of nanocarrier-interactions with cell membrane and their overall role in drug delivery.
Supplementary Material
Acknowledgments
The study reported here is funded by grant 1R01 EB 003975 from the National Institute of Biomedical Imaging and Bioengineering of the National Institutes of Health (to VL). JV was supported by a Pre-doctoral Fellowship from the American Heart Association, Heartland Affiliate (0515489Z). We thank Ms. Luda Shlyakhtenko of the Nanoimaging Core Facility at the University of Nebraska Medical Center for technical support with the AFM studies.
Footnotes
Publisher's Disclaimer: This is a PDF file of an unedited manuscript that has been accepted for publication. As a service to our customers we are providing this early version of the manuscript. The manuscript will undergo copyediting, typesetting, and review of the resulting proof before it is published in its final citable form. Please note that during the production process errors may be discovered which could affect the content, and all legal disclaimers that apply to the journal pertain.
References
- 1.Panyam J, Labhasetwar V. Targeting intracellular targets. Curr Drug Deliv. 2004;1(3):235–47. doi: 10.2174/1567201043334768. [DOI] [PubMed] [Google Scholar]
- 2.Kwon GS. Polymeric micelles for delivery of poorly water-soluble compounds. Crit Rev Ther Drug Carrier Syst. 2003;20(5):357–403. doi: 10.1615/critrevtherdrugcarriersyst.v20.i5.20. [DOI] [PubMed] [Google Scholar]
- 3.Duncan R. Designing polymer conjugates as lysosomotropic nanomedicines. Biochem Soc Trans. 2007;35(Pt 1):56–60. doi: 10.1042/BST0350056. [DOI] [PubMed] [Google Scholar]
- 4.Vinogradov SV, Bronich TK, Kabanov AV. Nanosized cationic hydrogels for drug delivery: preparation, properties and interactions with cells. Adv Drug Deliv Rev. 2002;54(1):135–47. doi: 10.1016/s0169-409x(01)00245-9. [DOI] [PubMed] [Google Scholar]
- 5.Vasir JK, Labhasetwar V. Biodegradable nanoparticles for cytosolic delivery of therapeutics. Adv Drug Deliv Rev. 2007;59(8):718–28. doi: 10.1016/j.addr.2007.06.003. [DOI] [PMC free article] [PubMed] [Google Scholar]
- 6.Panyam J, Labhasetwar V. Dynamics of endocytosis and exocytosis of poly(D,L-lactide-co-glycolide) nanoparticles in vascular smooth muscle cells. Pharm Res. 2003;20(2):212–20. doi: 10.1023/a:1022219003551. [DOI] [PubMed] [Google Scholar]
- 7.Panyam J, Labhasetwar V. Sustained cytoplasmic delivery of drugs with intracellular receptors using biodegradable nanoparticles. Mol Pharmaceutics. 2004;1(1):77–84. doi: 10.1021/mp034002c. [DOI] [PubMed] [Google Scholar]
- 8.Schwieger C, Blume A. Interaction of poly(L-lysines) with negatively charged membranes: an FT-IR and DSC study. Eur Biophys J. 2007;36(45):437–50. doi: 10.1007/s00249-006-0080-8. [DOI] [PubMed] [Google Scholar]
- 9.Nagy IB, Hudecz F, Alsina MA, Reig F. Physicochemical characterization of branched chain polymeric polypeptide carriers based on a poly-lysine backbone. Biopolymers. 2003;70(3):323–35. doi: 10.1002/bip.10494. [DOI] [PubMed] [Google Scholar]
- 10.Szabo R, Hudecz F, Reig F. Interfacial interactions between poly[L-lysine]-based branched polypeptides and phospholipid model membranes. J Colloid Interface Sci. 2003;267(1):18–24. doi: 10.1016/s0021-9797(03)00604-0. [DOI] [PubMed] [Google Scholar]
- 11.Prabha S, Labhasetwar V. Critical determinants in PLGA/PLA nanoparticle-mediated gene expression. Pharm Res. 2004;21(2):354–64. doi: 10.1023/b:pham.0000016250.56402.99. [DOI] [PubMed] [Google Scholar]
- 12.Davda J, Labhasetwar V. Characterization of nanoparticle uptake by endothelial cells. Int J Pharm. 2002;233(12):51–9. doi: 10.1016/s0378-5173(01)00923-1. [DOI] [PubMed] [Google Scholar]
- 13.Schneider SW, Sritharan KC, Geibel JP, Oberleithner H, Jena BP. Surface dynamics in living acinar cells imaged by atomic force microscopy: identification of plasma membrane structures involved in exocytosis. Proc Natl Acad Sci U S A. 1997;94(1):316–21. doi: 10.1073/pnas.94.1.316. [DOI] [PMC free article] [PubMed] [Google Scholar]
- 14.Ohnesorge FM, Horber JK, Haberle W, Czerny CP, Smith DP, Binnig G. AFM review study on pox viruses and living cells. Biophys J. 1997;73(4):2183–94. doi: 10.1016/S0006-3495(97)78250-X. [DOI] [PMC free article] [PubMed] [Google Scholar]
- 15.Cho SJ, Cho J, Jena BP. The number of secretory vesicles remains unchanged following exocytosis. Cell Biol Int. 2002;26(1):29–33. doi: 10.1006/cbir.2001.0848. [DOI] [PubMed] [Google Scholar]
- 16.Marchant RE, Kang I, Sit PS, Zhou Y, Todd BA, Eppell SJ, et al. Molecular views and measurements of hemostatic processes using atomic force microscopy. Curr Protein Pept Sci. 2002;3(3):249–74. doi: 10.2174/1389203023380611. [DOI] [PubMed] [Google Scholar]
- 17.You HX, Yu L. Atomic force microscopy imaging of living cells: progress, problems and prospects. Methods Cell Sci. 1999;21(1):1–17. doi: 10.1023/a:1009876320336. [DOI] [PubMed] [Google Scholar]
- 18.McNally HA, Rajwa B, Sturgis J, Robinson JP. Comparative three-dimensional imaging of living neurons with confocal and atomic force microscopy. J Neurosci Methods. 2005;142(2):177–84. doi: 10.1016/j.jneumeth.2004.08.018. [DOI] [PubMed] [Google Scholar]
- 19.Sinniah K, Paauw J, Ubels J. Investigating live and fixed epithelial and fibroblast cells by atomic force microscopy. Curr Eye Res. 2002;25(1):61–8. doi: 10.1076/ceyr.25.1.61.9963. [DOI] [PubMed] [Google Scholar]
- 20.Putman CA, van der Werf KO, de Grooth BG, van Hulst NF, Greve J. Viscoelasticity of living cells allows high resolution imaging by tapping mode atomic force microscopy. Biophys J. 1994;67(4):1749–53. doi: 10.1016/S0006-3495(94)80649-6. [DOI] [PMC free article] [PubMed] [Google Scholar]
- 21.Schaus SS, Henderson ER. Cell viability and probe-cell membrane interactions of XR1 glial cells imaged by atomic force microscopy. Biophys J. 1997;73(3):1205–14. doi: 10.1016/S0006-3495(97)78153-0. [DOI] [PMC free article] [PubMed] [Google Scholar]
- 22.Pyo N, Tanaka S, McNamee CE, Kanda Y, Fukumori Y, Ichikawa H, et al. Effect of the cell type and cell density on the binding of living cells to a silica particle: an atomic force microscope study. Colloids Surf B Biointerfaces. 2006;53(2):278–87. doi: 10.1016/j.colsurfb.2006.09.020. [DOI] [PubMed] [Google Scholar]
- 23.McNamee CE, Pyo N, Tanaka S, Vakarelski IU, Kanda Y, Higashitani K. Parameters affecting the adhesion strength between a living cell and a colloid probe when measured by the atomic force microscope. Colloids Surf B Biointerfaces. 2006;48(2):176–82. doi: 10.1016/j.colsurfb.2006.01.014. [DOI] [PubMed] [Google Scholar]
- 24.Gad M, Itoh A, Ikai A. Mapping cell wall polysaccharides of living microbial cells using atomic force microscopy. Cell Biol Int. 1997;21(11):697–706. doi: 10.1006/cbir.1997.0214. [DOI] [PubMed] [Google Scholar]
- 25.Chen A, Moy VT. Cross-linking of cell surface receptors enhances cooperativity of molecular adhesion. Biophys J. 2000;78(6):2814–20. doi: 10.1016/S0006-3495(00)76824-X. [DOI] [PMC free article] [PubMed] [Google Scholar]
- 26.Sen S, Subramanian S, Discher DE. Indentation and adhesive probing of a cell membrane with AFM: theoretical model and experiments. Biophys J. 2005;89(5):3203–13. doi: 10.1529/biophysj.105.063826. [DOI] [PMC free article] [PubMed] [Google Scholar]
- 27.Panyam J, Sahoo SK, Prabha S, Bargar T, Labhasetwar V. Fluorescence and electron microscopy probes for cellular and tissue uptake of poly(D,L-lactide-co-glycolide) nanoparticles. Int J Pharm. 2003;262(12):1–11. doi: 10.1016/s0378-5173(03)00295-3. [DOI] [PubMed] [Google Scholar]
- 28.Panyam J, Zhou WZ, Prabha S, Sahoo SK, Labhasetwar V. Rapid endo-lysosomal escape of poly(DL-lactide-co-glycolide) nanoparticles: implications for drug and gene delivery. FASEB J. 2002;16(10):1217–26. doi: 10.1096/fj.02-0088com. [DOI] [PubMed] [Google Scholar]
- 29.Ong QK, Sokolov I. Attachment of nanoparticles to the AFM tips for direct measurements of interaction between a single nanoparticle and surfaces. J Colloid Interface Sci. 2007;310(2):385–90. doi: 10.1016/j.jcis.2007.02.010. [DOI] [PubMed] [Google Scholar]
- 30.McNamee CE, Pyo N, Higashitani K. Atomic force microscopy study of the specific adhesion between a colloid particle and a living melanoma cell: Effect of the charge and the hydrophobicity of the particle surface. Biophys J. 2006;91(5):1960–9. doi: 10.1529/biophysj.106.082420. [DOI] [PMC free article] [PubMed] [Google Scholar]
- 31.Riener CK, Stroh CM, Ebner A, Klampfl C, Gall AA, Romanin C, et al. Simple test system for single molecule recognition force microscopy. Anal Chim Acta. 2003;479(1):59–75. [Google Scholar]
- 32.Hinterdorfer P, Dufrene YF. Detection and localization of single molecular recognition events using atomic force microscopy. Nat Methods. 2006;3(5):347–55. doi: 10.1038/nmeth871. [DOI] [PubMed] [Google Scholar]
- 33.Ebner A, Hinterdorfer P, Gruber HJ. Comparison of different aminofunctionalization strategies for attachment of single antibodies to AFM cantilevers. Ultramicroscopy. 2007;107(1011):922–7. doi: 10.1016/j.ultramic.2007.02.035. [DOI] [PubMed] [Google Scholar]
- 34.Vakarelski IU, Higashitani K. Single-nanoparticle-terminated tips for scanning probe microscopy. Langmuir. 2006;22(7):2931–4. doi: 10.1021/la0528145. [DOI] [PubMed] [Google Scholar]
- 35.Sahoo SK, Labhasetwar V. Enhanced antiproliferative activity of transferrin-conjugated paclitaxel-loaded nanoparticles is mediated via sustained intracellular drug retention. Mol Pharmaceutics. 2005;2(5):373–83. doi: 10.1021/mp050032z. [DOI] [PubMed] [Google Scholar]
- 36.Leroueil PR, Hong S, Mecke A, Baker JR, Jr, Orr BG, Banaszak Holl MM. Nanoparticle interaction with biological membranes: does nanotechnology present a Janus face? Acc Chem Res. 2007;40(5):335–42. doi: 10.1021/ar600012y. [DOI] [PMC free article] [PubMed] [Google Scholar]
Associated Data
This section collects any data citations, data availability statements, or supplementary materials included in this article.