

Abstract
Objective
This study describes patterns of bias in self-reported dietary recall data of girls by examining differences among girls classified as under-reporters, plausible reporters, and over-reporters on weight, dietary patterns, and psychosocial characteristics.
Research Methods and Procedures
Participants included 176 girls at age 11 and their parents. Girls’ weight and height were measured. Three 24-hour dietary recalls and responses to psychosocial measures were collected. Plausibility cut-offs for reported energy intake as a percentage of predicted energy requirements were used to divide the sample into under-reporters, plausible reporters, and over-reporters. Differences among these three groups on dietary and psychosocial variables were assessed to examine possible sources of bias in reporting.
Results
Using a ± 1 standard deviation cut-off for energy intake plausibility, 50% of the sample was categorized as plausible reporters, 34% as under-reporters, and 16% as over-reporters. Weight status of under-reporters was significantly higher than that of plausible reporters and over-reporters. With respect to reported dietary intake, under-reporters were no different from plausible reporters on intakes of foods with higher nutrient densities and lower energy densities and were significantly lower than plausible reporters on intakes of foods with lower nutrient densities and higher energy densities. Over-reporters reported significantly higher intakes of all food groups and the majority of subgroups, relative to plausible reporters. Under-reporters had significantly higher levels of weight concern and dietary restraint than both plausible reporters and over-reporters.
Discussion
Techniques to categorize plausible and implausible reporters can and should be used to provide an improved understanding of the nature of error in children’s dietary intake data and account for this error in analysis and interpretation.
Keywords: under-reporting, energy intake, children, reporting bias, dietary recall
Introduction
In both children and adults, substantial error in self-report of food intake has been revealed by validation studies using objective measures of dietary intake or energy expenditure (1-12). The presence of error in self-reported dietary data may obscure associations between diet and weight status (13). For example, among adults and adolescents, higher weight individuals tend to under-report energy intake to a greater degree (1-3,7,9,14), creating a systematic bias that attenuates the association between caloric intake and weight. In response to these limitations, Beaton (15) has asserted that before progress can be made linking dietary intake to health outcomes, the error in self-report data should be understood to better inform data collection and analysis.
Some insight into the nature of bias has come from comparisons between observed and self-reported intakes, but little of this research has focused on children. These observations have suggested that, among adults, under-reporting of intake is selective (8). That is, under-reporting of energy intake is largely a result of selective under-reporting of energy-dense, nutrient-poor foods perceived as bad or unhealthy, such as fats, sugars, candy, and desserts (8). In adults, psychosocial influences such as weight concern, body dissatisfaction, social desirability, social approval need, restraint, and disinhibited eating are associated with bias in self-reported dietary data (4,8). Less is known about individual and familial characteristics associated with biased reporting in children.
Information about bias and error in self-reported diet assessment methods is typically obtained using the doubly labeled water (DLW)1 technique (17). The core principle behind using DLW to validate self-reported dietary data is that energy expenditure should equal energy intake during periods of stability for weight and body composition (4,8). Unfortunately, DLW techniques are costly and not feasible for large samples (18). To address reporting bias in samples where DLW data are not available, several investigators have developed alternative methods to screen for and exclude implausible reporters of energy intake that replace directly measured energy use with estimated energy requirements from prediction equations (16-20).
Goldberg et al. (17) developed one of the most widely used procedures by aggregating DLW data for energy requirements from several studies to create minimum energy intake cut-off limits for various body weights. Energy intakes below these limits would be incompatible with long-term survival, and individuals reporting caloric consumption below these cut-offs are classified as under-reporters. McCrory et al. (18) later developed a similar approach (based on Goldberg’s methodology) that creates a percentage for the ratio of reported energy intake (rEI) to predicted total energy expenditure (pTEE). Using this technique, McCrory et al. (18) reported the relationship between body weight and rEI strengthened when implausible reporters were excluded from the sample. Huang et al. (20) later extended the techniques of McCrory et al. to children, creating age- and gender-specific cut-offs for the rEI/predicted energy requirements (pER) ratio. These investigators reported improved ability to detect expected associations between weight status and several dietary variables once children classified as implausible reporters were excluded.
Information concerning the characteristics of children classified as under-reporters, plausible reporters, or over-reporters is sparse. Additionally, little research has used prediction equation classification of individuals as under-reporters, plausible reporters, and over-reporters to understand the psychosocial influences on reporting bias in dietary recall data. Therefore, the present study applies the method developed by Huang et al. (19,20) to better understand the characteristics of and influences on children who provide implausible reports of dietary intake. This study has three objectives: to identify under-reporters, plausible reporters, and over-reporters of energy intake in a sample of 11-year-old girls; to compare the reported diets of under-reporters, plausible reporters, and over-reporters of energy intake; and to assess psychosocial correlates of under-reporting, plausible reporting, and over-reporting.
Research Methods and Procedures
Participants
Participants were 176 11-year-old, white, non-Hispanic girls and their parents, living in central Pennsylvania. Eligibility criteria for girls’ participation at the time of recruitment included: living with both biological parents, the absence of severe food allergies or chronic medical problems affecting food intake, and the absence of dietary restrictions involving animal products. Participants were not recruited based on eating disorders, weight status, or weight concern. All procedures were reviewed and approved by The Pennsylvania State University Human Subjects Institutional Review Board.
Procedures
Girls participated in individual interviews with trained research assistants. Mothers completed a series of self-report questionnaires. A registered nurse or trained research assistant collected height and weight for girls and parents and additional anthropometric measures for girls.
Measures
24-Hour Dietary Recall
The Dietary Assessment Center at the Pennsylvania State University conducted all 24-hour recall interviews, and the Minnesota Nutrition Data System for Research version 4.06_34 (2003) was used to calculate nutrient intakes. Participants provided three 24-hour recalls within a 2- to 3-week period, including 2 weekdays and 1 weekend day. Mothers were present during daughters’ interviews and assisted when necessary, but daughters were the primary reporters of intake.
Based on the U.S. Department of Agriculture (USDA) Food Pyramid Guidelines (21), the 3-day average number of servings from the six food groups (grain, vegetable, fruit, dairy, meat, and fats and sweets) and some subgroups was determined. Mean number of servings for three classes of beverages was calculated over the 3 days of data. These beverages included milk, juice, and other caloric beverages (for example, soda or sports drinks). The mean energy per day (kilocalories per day) was calculated by meal (breakfast, lunch, snack, and dinner). Total snacking frequency over the 3-day period was also tabulated.
Weight Status
For girls, a measure of fat mass and percentage body fat was obtained using DXA scans. Trained staff measured height and weight. Children were dressed in light clothing with no shoes. Weight was measured in triplicate to the nearest 0.10 kg using a Seca Electronic Scale (Seca Corp., Birmingham, United Kingdom). Height was also measured in triplicate to the nearest 0.10 cm using a Shorr Productions stadiometer (Irwin Shorr, Olney, MD). Age- and gender-specific BMI and BMI percentiles were calculated based on the Centers for Disease Control and Prevention (CDC) national reference data and using Epi Info 6 anthropometric software (version 6.04b, 1997; CDC, Atlanta, GA). In children, the CDC defines at-risk-for-overweight as a BMI percentile ≥ 85% and overweight as a BMI percentile ≥ 95%. These cut-offs are specified by the CDC growth chart references (22).
Social Desirability
Socially desirable responding was measured using the Lie Scale of the Children’s Manifest Anxiety Scale (23). The lie or social desirability subscale is a subset of nine items and may be indicative of an inaccurate self-report. The child may be intentionally faking being good to convince the examiner that the child is more of an ideal person than is really true. High lie scores may indicate a high need for social acceptance and a greater likelihood of social desirability bias in self-reports.
Weight Concerns
An amended version of the Stanford Weight Concerns Scale (24) assessed weight concerns. The Weight Concerns scale is a five-item questionnaire that assesses fear of weight gain, worry about weight and body shape, and the importance of weight, diet history, and perceived fatness.
Dutch Eating Behavior Questionnaire (DEBQ)
Dietary restraint and disinhibition were measured using the DEBQ created by van Strien et al. (25). This is a 33-item, Likert scale-based inventory. van Strien conceptualizes restraint as the cognitive control over eating and disinhibition as the loss of control over eating.
Child Feeding Questionnaire (CFQ)
Maternal restriction of daughter’s intake was assessed using the restriction subscale of the CFQ (26). This questionnaire is a self-report measure of girls’ perceptions of the level of control that their mothers exert during feeding situations. It was adapted from the adult version of the CFQ for use with adolescents by asking questions from the child’s perspective.
Identification of Implausible Reporters
To identify implausible reporters and to further categorize the implausible reporters as either under-reporters or over-reporters, the method developed by Huang et al. (19,20) was used. Gender- and age group-specific ± 1 standard deviation (SD) cut-offs were created for rEI as a percentage of pER: (rEI/pER) × 100 (18-20).
First, pER was calculated for each individual girl. pERs from calculations correlate highly with observed energy requirements from indirect calorimetry and DLW (17); thus, this technique is an acceptable method to predict required energy for participants in larger studies. The equation for pER was obtained from the 2002 Dietary Reference Intakes (27):
| (1) |
This equation contains constants for gender and growth (kilocalories for energy deposition) and coefficients for age, PA, weight, and height. For this study, the value used for the PA coefficient was 1.16 and was chosen based on PA level (PAL) ranges. Due to a lack of an objective measure of PA for our sample, the Huang et al. (20)-suggested PAL value of 1.5 was used, which falls within the low-active category (PAL value ≥ 1.4 < 1.6); the PA coefficient of 1.16 corresponds to this PAL range. This low-active category provides a conservative estimate of energy expenditure attributable to PA to avoid overestimation of this component and overestimation of energy requirements when calculating pER.
After calculating pER for each girl, rEI was divided by pER and multiplied by 100 to provide an estimate of plausibility for rEI as a percentage of pER (%rEI/pER). This ratio is used under the assumption that, for participants in energy balance, rEI is equal to pER, and %rEI/pER is ∼100% (19,20).
Propagation of error variances was utilized to create the ± 1 SD cut-off for %rEI/pER. This was calculated with the equation used by Huang et al. (19,20), which was adapted by these authors from the Goldberg cut-off calculations:
| (2) |
where d is the number of days of intake data. The other equation components include: coefficients of variation for reported energy intakes (CVrEI), pER (CVpER), and day-to-day biological variation in total energy expenditure (CVmTEE). The CVrEI was 23.47% and was calculated for our sample by dividing the SD of each girl’s 3 days of energy intake by the 3-day average energy intake. Each individual CV was averaged to obtain a CVrEI for the sample. CVpER was 4.81% and was taken from the DRI equations; it was calculated by dividing the SDs of the pER equation residuals by the mean total energy expenditure within each gender and age class (27). CVmTEE was 8.2% and was measured in previous studies employing DLW techniques (18,28).
Although a ±2 SD cut-off may allow for better representation of daily variation in intakes (28), this study’s main focus was the identification of plausible reporters, under-reporters, and over-reporters. In samples of adults, cut-offs between ±1 and ±2 SD have been developed that provide maximal sample sizes while maintaining biological validity (19); this type of cut-off has yet to be derived for children. Thus, the use of a more stringent criterion of ± 1 SD was chosen because it is consistent with work done by previous investigators (18-20). Additionally, this cut-off was determined to be more appropriate because it effectively identifies potentially biased reports while still yielding large enough reporting classification groups to examine between-group differences.
Statistical Analyses
All data were analyzed using the Statistical Analysis System software package (version 8.02; SAS, Cary, NC). p < 0.05 was used to indicate significant effects. ANOVA with a general linear model was used to compare mean differences on weight status and dietary and psychosocial variables. Post hoc pair-wise comparisons of significant differences were computed with a Tukey honestly significant difference correction to control the overall error rate at p < 0.05. A focus will be placed on the differences between under- and plausible reporters because the adult literature suggests that under-reporting is associated with several physical and psychosocial characteristics (29), and similar findings are not available for over-reporting.
Results
Background Characteristics
Characteristics of the total sample for girls, mothers, and fathers are presented in Table 1. Participants were of well-educated, median income-level families. Thirty percent of girls were classified as at-risk-for-overweight, and 14% were classified as overweight; these findings are slightly higher than national data for the prevalence of overweight in 11-year-old white girls (30).
Table 1.
Background characteristics
| Mean ± standard deviation | Range | |
|---|---|---|
| Girls’ age (years) | 11.3 ± 0.3 | 10.8 to 12.5 |
| Mothers’ age (years) | 41.5 ± 4.8 | 30.0 to 52.7 |
| Fathers’ age (years) | 43.5 ± 5.2 | 32.2 to 72.5 |
| Family income | $36,000 to $50,000 | <$20,000 to $100,000+ |
| Mothers’ years of education | 14.8 ± 2.3 | 12 to 20 |
| Fathers’ years of education | 15.0 ± 2.7 | 11 to 22 |
| BMI (kg/m2) | 20.0 ± 3.9 | 13.8 to 40.5 |
| BMI-for-age percentile* | 80.0 ± 27.2 | 2.0 to 99.7 |
| Percentage of girls at-risk-for-overweight† | 29.4 (n = 52) | |
| Percentage of girls overweight‡ | 13.6 (n = 24) |
BMI-for-age percentile were calculated using Centers for Disease Control and Prevention growth charts (22) and correspond directly to the mean BMI.
At-risk-for-overweight defined as a BMI-for-age percentile ≥ 85%.
Overweight defined as a BMI-for-age percentile ≥ 95%.
Identification of Under-reporters, Plausible Reporters, and Over-reporters
Figure 1 shows the frequency distribution of %rEI/pER values in this sample. The mean %rEI/pER for under-reporters was 71%, indicating that, on average, under-reporters reported energy intakes ∼29% below pERs. Mean %rEI/pER for plausible reporters and over-reporters was 99% and 136%, respectively. Thus, on average, plausible reporters reported caloric intakes that were almost 100% of pER and over-reporters reported caloric intakes ∼36% above pER. In the total sample, the lowest %rEI/pER was 38%; the highest was 184%.
Figure 1.

Frequency (as percentage of total sample) of under-reporting, plausible reporting, and over-reporting classifications.
Comparison of Under-reporters, Plausible Reporters, and Over-reporters on Weight Status and Adiposity
Weight status differences among under-reporters, plausible reporters, and over-reporters are illustrated in Table 2. Under-reporters were significantly higher than both plausible reporters and over-reporters on both weight status and adiposity measures, but mean differences between plausible reporters and over-reporters were not significant.
Table 2.
Mean BMI, BMI z score, BMI percentile, fat mass, and percentage body fat by reporting classification
| Under | Plausible | Over | |
|---|---|---|---|
| BMI (kg/m2) | 21.6 ± 4.2a | 19.5 ± 3.9b | 18.5 ± 3.0b |
| BMI z score | 0.9 ± 0.9a | 0.3 ± 1.0b | 0.1 ± 0.9b |
| BMI percentile* | 88.0 ± 23.2a | 72.0 ± 28.0b | 58.0 ± 27.2b |
| Fat mass (kg)†‡ | 15.0 ± 61.8a | 11.6 ± 62.0b | 10.4 ± 48.2b |
| Body fat (%)†‡ | 30.6 ± 6.9a | 26.5 ± 6.9b | 25.2 ± 6.8b |
All values are mean ± SD. Different superscript letters indicate significant differences among reporting classifications at p < 0.05 in the Tukey comparison.
BMI percentile corresponds directly to the reporter group mean BMI.
Measured by DXA.
n = 171, under-reporters; n = 57, plausible reporters; n = 86, over-reporters, n = 28.
Differences among Under-reporters, Plausible Reporters, and Over-reporters on Reported Intakes
Food Group and Subgroup Servings
Reporting classification group differences in reported servings from the six USDA Food Guide Pyramid food groups are presented in Figure 2. Under-reporters reported consuming significantly fewer servings from the grain and sweets and fats groups than plausible reporters and over-reporters, but under-reporters’ reported servings from the vegetable, fruit, and meat groups did not differ significantly from reported servings of the plausible reporters. Over-reporters differed from under-reporters and plausible reporters across all food groups, consistently reporting consumption of a significantly greater number of servings from the grain, vegetable, fruit, dairy, meat, and sweets and fats groups than both plausible and under-reporters.
Figure 2.
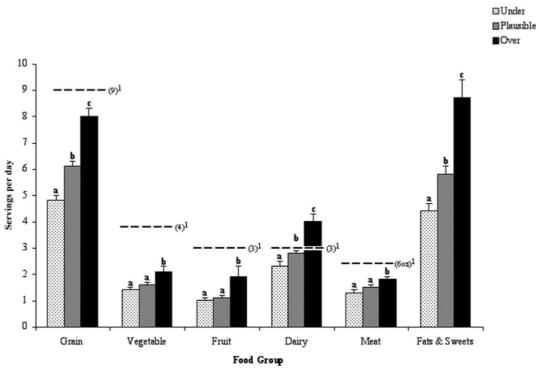
Reported food group servings of under-reporters, plausible reporters, and over-reporters. Different letters within food groups indicate significant differences among reporting classifications at p < 0.05 in the Tukey comparison. 1 Recommended servings based on USDA Food Guide Pyramid Dietary Guidelines for this age and gender group (21).
Grain subgroup intakes are shown in Figure 3; under-reporters reported consuming significantly fewer servings than plausible reporters from the pastry subgroup but were no different from plausible reporters on reported servings from the bread, cereal, pasta, and cracker subgroups. With respect to reported intake from the vegetable subgroup, there were no differences in subgroup intakes with the exception of the French fry and potato chip subgroup (Figure 4); under-reporters were significantly lower than plausible reporters on reported consumption from this subgroup. Further evidence for the selective nature of under-reporting appears in the dairy subgroup intakes (Figure 5) because under-reporters reported consuming fewer servings from the cheese and dairy dessert subgroups than plausible reporters but were not significantly different from plausible reporters on reported intakes from the milk subgroup.
Figure 3.
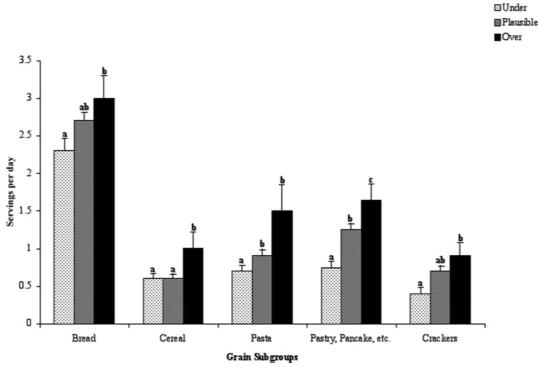
Reported grain subgroup servings of under-reporters, plausible reporters, and over-reporters. Different letters within subgroups indicate significant differences among reporting classifications at p < 0.05 in the Tukey comparison.
Figure 4.
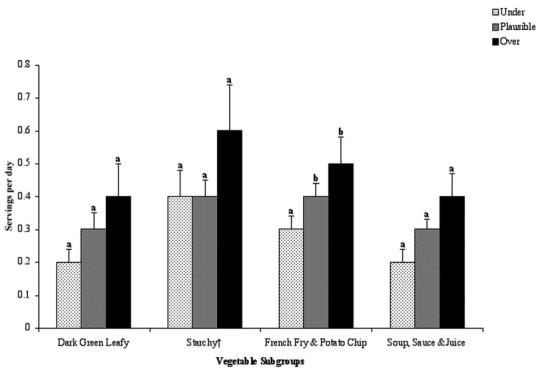
Reported vegetable subgroup servings of under-reporters, plausible reporters, and over-reporters. Different letters within subgroups indicate significant differences among reporting classifications at p < 0.05 in the Tukey comparison. † Excluding french fries and potato chips.
Figure 5.

Reported dairy subgroup servings of under-reporters, plausible reporters, and over-reporters. Different letters within subgroups indicate significant differences among reporting classifications at p < 0.05 in the Tukey comparison.
Differences among Under-reporters, Plausible Reporters, and Over-reporters in Caloric Beverage Consumption: Milk, Juice, and Soda Intakes
Beverage intakes provided additional evidence for selective under-reporting (Figure 6). Under-reporters were not significantly different from plausible reporters on reported number of juice or milk servings but were significantly lower than plausible reporters on reported soda intake.
Figure 6.
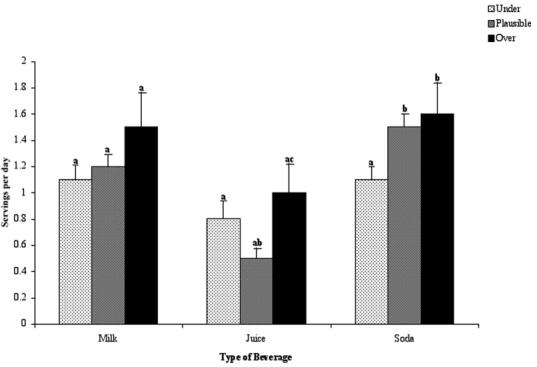
Reported beverage consumption of under-reporters, plausible reporters, and over-reporters. Different letters within beverage groups indicate significant differences among reporting classifications at p < 0.05 in the Tukey comparison.
Differences among Under-reporters, Plausible Reporters, and Over-reporters in Meal Patterns: Meal and Snack Frequencies
Figure 7 illustrates differences among reporting classifications on meal patterns. Over the 3 days of 24-hour recall data, very few girls reported skipped meals; most consumed three meals (breakfast, lunch, and dinner) plus snacks almost every day. Under-reporters reported fewer snacking occasions than both plausible reporters and over-reporters, but snacking frequency was no different between plausible reporters and over-reporters. Under-reporters reported consuming all meals (breakfast, lunch, and dinner) significantly less frequently each day than plausible reporters.
Figure 7.
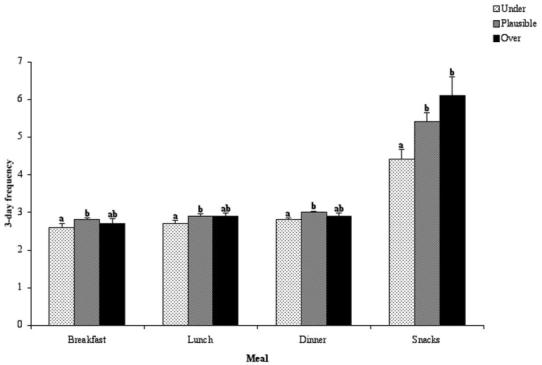
Reported three-day meal and snack frequencies of under-reporters, plausible reporters, and over-reporters. Different letters within meal groups indicate significant differences among reporting classifications at p < 0.05 in the Tukey comparison.
Differences in Diet- and Weight-Related Psychosocial Characteristics among Under-reporters, Plausible Reporters, and Over-reporters
All psychosocial measure differences are presented in Table 3. Under-reporters were significantly higher than both plausible reporters and over-reporters on weight concern and dietary restraint. The three groups were not significantly different on social desirability, disinhibition, or reports of restrictive feeding practices of the mother.
Table 3.
Psychosocial differences among under-, plausible, and over-reporters
| Under | Plausible | Over | |
|---|---|---|---|
| Social desirability: CMAS, range 1 to 2 | 1.7 ± 0.3 | 1.7 ± 0.2 | 1.6 ± 0.3 |
| Weight concern: WCS, range 1 to 5 | 1.0 ± 0.7a | 0.6 ± 0.6b | 0.5 ± 0.5b |
| Dietary restraint: DEBQ, range 1 to 5 | 2.1 ± 0.9a | 1.7 ± 0.7b | 1.5 ± 0.7b |
| Disinhibition: DEBQ, range 1 to 5 | 1.9 ± 0.6 | 2.0 ± 0.6 | 2.0 ± 0.5 |
| Perceived restriction by mother: CFQ, range 1-5 | 2.2 ± 0.5 | 2.2 ± 0.5 | 2.0 ± 0.5 |
Values are mean ± SD. Different superscript letters indicate significant differences among reporting classifications at p < 0.05 in the Tukey comparison. CMAS, Childhood Manifest Anxiety Scale; WCS, Weight Concerns Scale; DEBQ, Dutch Eating Behavior Questionnaire; CFQ, Child Feeding Questionnaire.
Discussion
This study categorized a sample of 11-year-old girls as under-reporters, plausible reporters, and over-reporters, described the patterns of bias in their self-reported dietary data, and examined individual characteristics associated with implausible reporting. The findings revealed that girls classified as under-reporters, plausible reporters, and over-reporters of energy intake also differed in other characteristics. Under-reporters’ weight status was significantly higher than that of both plausible reporters and over-reporters. Furthermore, findings revealed that under-reporting tended to be selective. Under-reporters reported fewer servings from food groups and subgroups with higher energy densities and lower nutrient densities. In contrast, under-reporters did not differ from plausible reporters on reported consumption of food groups and subgroups with lower energy and higher nutrient densities. Additionally, under-reporters reported fewer snacks per day than both plausible reporters and over-reporters. Under-reporters had significantly higher levels of weight concern and dietary restraint than both plausible reporters and over-reporters.
This study provided evidence that under-reporting is not limited to adolescent and adult samples; it was prevalent in self-reported dietary data of 11-year-old girls. Additionally, girls classified as under-reporters were selective in their under-reporting, providing dietary reports similar to those of adult under-reporters. Rather than reporting proportionately lower intakes across all food groups, under-reporters reported consuming the same number of vegetable, fruit, and meat servings as plausible reporters, but fewer servings from the grain, dairy, and sweets and fats groups. Within the grain, vegetable, and dairy food groups, under-reporters were significantly lower than plausible reporters on energy dense, nutrient-sparse foods (e.g., pastries, French fries, dairy desserts, cheese) but were no different on foods that are typically more nutrient-dense and energy-sparse (e.g., breads, dark green leafy vegetables, milk). Under-reporters also reported consuming fewer servings of soda and having fewer snacking occasions relative to both plausible reporters and over-reporters. These patterns may reflect tendencies of certain girls to report intakes more consistent with perceptions of what comprises a desirable, healthy, or permissible diet, regardless of actual dietary patterns.
In addition to exhibiting dietary patterns similar to those of adult under-reporters (8), the girls within the under-reporting group had higher weight status and higher levels of weight concern and dietary restraint. The grouping of these traits has also been found in adults classified as under-reporters (7,8,29,31,32). These associations suggest that, similar to the case with adults who under-report, the characteristics of overweight, concern about overweight, and tendencies toward dietary restraint during childhood may work in concert to drive the selective reporting seen in girls who under-report energy intake.
It was hypothesized that under-reporters would be higher on social desirability, disinhibition, and restrictive maternal feeding practices. The failure to note differences between groups may be attributable to several factors. With respect to social desirability, Worsley et al. (33) did not find associations between dietary patterns and the Marlowe-Crowne Social desirability scale but did find associations when a food behavior-specific social desirability scale was used; this suggests that general social desirability may not extend to social desirability related to food and dietary reporting. Additionally, the lack of association between perceived mother restriction and under-reporting suggests that, at age 11, daughters’ own characteristics have stronger influences on reporting accuracy than maternal influences. Regardless, the pattern of findings presented here reveals that, as early as age 11, certain girls may be similar to adults in that they have a heightened awareness of diet and perceptions of desirable and undesirable diet profiles. These girls may then misreport dietary patterns to be more consistent with these perceptions.
The 16% of the sample who were classified as over-reporters did not differ significantly from plausible reporters on any of the weight status or psychosocial variables. However, there may be other unmeasured variables not related to weight status or weight-related psychological factors that may distinguish over-reporters from plausible reporters and under-reporters. For example, it is likely that cognitive, perceptual, and memory differences may also be related to differences in reporting status (34). The addition of measures of individual differences in these cognitive skills in future research could provide evidence on this issue.
Although this research provided several important insights regarding reporting bias in girls, the study is not without limitations. First, the ability to generalize these findings is limited because the sample was homogeneous in both ethnicity (white) and gender (girls). Additionally, dietary intake data were collected only during the summer and early fall months; thus, the full variability of intake may not have been captured. Mother’s involvement also presents a limitation in that it is difficult to assess the amount of influence mothers have on daughters’ reporting. Finally, the lack of an objective measure of PA limits the ability to estimate energy requirement. Although the use of a conservative PAL value provides some protection against overestimation of energy requirements, it does not safeguard against underestimation. The accuracy of this screening procedure would be strengthened by a more precise measure of each girl’s PA level by which to estimate an individual PAL coefficient for the pER equation. Future research should attempt to replicate this study in different ethnicity and age groups, as well as in males.
The present study used prediction equation-based methods that are more feasible than DLW or direct observation of behavior to examine associations among girls’ weight status, dietary patterns, psychosocial variables, and under-reporting. These associations provide insight into the psychological influences on biased reporting of diet during childhood that had not been previously examined by prediction-based classification techniques. Additionally, previous applications of these techniques by McCrory et al. (18) and Huang et al. (19,20) have been with large national survey datasets; the present study provided evidence that this technique can be applied in a smaller study and yields results consistent with evidence gained from studies using DLW-based methods to identify biased reporting. Thus, this study provides support for the applicability of prediction equation-based techniques for obtaining a better understanding of the error in children’s dietary data created by biased reporting of intake.
Previously published techniques to identify plausible and implausible reporters were utilized in the present study for a different purpose and intent than in previous research; in this study, the techniques are employed to compare under-reporters, plausible reporters, and over-reporters on dietary variables and a range of physical and psychological measurements, rather than to exclude individuals with energy intakes deemed implausible. Analyses that exclude implausible reporters in investigating associations between diet and health outcomes may be problematic because large portions of the sample are often excluded [for example, at ±1 SD, McCrory et al. (18) excluded ∼57% and Huang et al. (20) excluded ∼65%]. In the future, it might be possible to use information available about respondents, beyond pER based on weight status, to identify and adjust for sources of potential bias in reporting. For example, the current findings reveal that girls with relatively high weight concern and dietary restraint and a diet profile low on snacking and energy-dense, nutrient-sparse foods and high on energy sparse, nutrient-dense foods are likely to be under-reporters. Thus, the use of these variables to either predict or correct for implausible reporting may provide a means by which to adjust, rather than discard, biased dietary data. Future research should aim to delineate the correlates of implausible reporting and use this information in developing techniques to reduce bias without eliminating large fractions of observed data.
In summary, this study of the patterns of differences among under-reporters, plausible reporters, and over-reporters suggested that, by late childhood, bias is present in self-reported intake and may distort our understanding of habitual intake. Findings revealed that, at 11 years of age, several physical and psychosocial characteristics of girls are associated with the accuracy of dietary self-report in ways similar to what has been previously described in adults. Procedures that use prediction equations in place of DLW techniques to identify children who are under-reporters, plausible reporters, or over-reporters can be utilized to gain an understanding of the systematic bias in samples where objective measures of energy expenditure or intake may not be available or feasible. The insights provided by these classification techniques through the examination, rather than exclusion, of under-reporters and over-reporters yield a better understanding of the impact biased reporting may have on both the error within dietary data and the assessment of relations between dietary data and weight status in children. Further exploration of these techniques and a better understanding of the nature of and influences on biased reporting during childhood may aid in the development of techniques to reduce bias and measurement error in the self-reported dietary data of children.
Acknowledgments
This research was supported by NIH Grants M01 RR10732 and HD32973. We thank the families who participated in this research study and the General Clinical Research Center of the Pennsylvania State University, which provided aid and services.
Footnotes
Nonstandard abbreviations: DLW, doubly labeled water; rEI, ratio of reported energy intake; pTEE, predicted total energy expenditure; pER, predicted energy requirement; USDA, U.S. Department of Agriculture; CDC, Centers for Disease Control and Prevention; DEBQ, Dutch Eating Behavior Questionnaire; CFQ, Child Feeding Questionnaire; SD, standard deviation; PA, physical activity; PAL, PA level; %rEI/pER, estimate of plausibility for rEI as a percentage of pER; CVrEI, coefficient of variation for rEI; CVpER, coefficient of variation for pER; CVmTEE, coefficient of variation for day-to-day biological variation in total energy expenditure.
References
- 1.Bandini LG, Cyr H, Must A, Dietz WH. Validity of reported energy intake in preadolescent girls. Am J Clin Nutr. 1997;65:1138–41S. doi: 10.1093/ajcn/65.4.1138S. [DOI] [PubMed] [Google Scholar]
- 2.Bandini LG, Must A, Cyr H, Anderson SE, Spadano JL, Dietz WH. Longitudinal changes in the accuracy of reported energy intake in girls 10-15 y of age. Am J Clin Nutr. 2003;78:480–4. doi: 10.1093/ajcn/78.3.480. [DOI] [PubMed] [Google Scholar]
- 3.Bandini LG, Schoeller DA, Cyr HN, Dietz WH. Validity of reported energy intake in obese and nonobese adolescents. Am J Clin Nutr. 1990;52:421–5. doi: 10.1093/ajcn/52.3.421. [DOI] [PubMed] [Google Scholar]
- 4.Black AE, Prentice AM, Goldberg GR, et al. Measurements of total energy expenditure provide insights into the validity of dietary measurements of energy intake. J Am Diet Assoc. 1993;93:572–9. doi: 10.1016/0002-8223(93)91820-g. [DOI] [PubMed] [Google Scholar]
- 5.Champagne CM, Baker NB, DeLany JP, Harsha DW, Bray GA. Assessment of energy intake under-reporting by doubly labeled water and observations on reported nutrient intakes in children. J Am Diet Assoc. 1998;98:426–33. doi: 10.1016/S0002-8223(98)00097-2. [DOI] [PubMed] [Google Scholar]
- 6.Champagne CM, Delany JP, Harsha DW, Bray GA. Under-reporting of energy intake in biracial children is verified by doubly labeled water. J Am Diet Assoc. 1996;96:707–9. doi: 10.1016/S0002-8223(96)00193-9. [DOI] [PubMed] [Google Scholar]
- 7.Lichtman SW, Pisarska K, Berman ER, et al. Discrepancy between self-reported and actual caloric intake and exercise in obese subjects. N Engl J Med. 1992;327:1893–8. doi: 10.1056/NEJM199212313272701. [DOI] [PubMed] [Google Scholar]
- 8.Livingstone MB, Black AE. Markers of the validity of reported energy intake. J Nutr. 2003;133(Suppl 3):895–920S. doi: 10.1093/jn/133.3.895S. [DOI] [PubMed] [Google Scholar]
- 9.Schoeller DA, Bandini LG, Dietz WH. Inaccuracies in self-reported intake identified by comparison with the doubly labelled water method. Can J Physiol Pharmacol. 1990;68:941–9. doi: 10.1139/y90-143. [DOI] [PubMed] [Google Scholar]
- 10.Trabulsi J, Schoeller DA. Evaluation of dietary assessment instruments against doubly labeled water, a biomarker of habitual energy intake. Am J Physiol Endocrinol Metab. 2001;281:E891–9. doi: 10.1152/ajpendo.2001.281.5.E891. [DOI] [PubMed] [Google Scholar]
- 11.Prentice AM, Black AE, Coward WA, et al. High levels of energy expenditure in obese women. Br Med J (Clin Res Ed) 1986;292:983–7. doi: 10.1136/bmj.292.6526.983. [DOI] [PMC free article] [PubMed] [Google Scholar]
- 12.McPherson SR, Hoelscher DM, Alexander M, Scanlon KS, Serdula MK. Dietary assessment methods among school-aged children: validity and reliability. Prev Med. 2000;31:S11–33. [Google Scholar]
- 13.Beaton GH, Burema J, Ritenbaugh C. Errors in the interpretation of dietary assessments. Am J Clin Nutr. 1997;65:1100–7S. doi: 10.1093/ajcn/65.4.1100S. [DOI] [PubMed] [Google Scholar]
- 14.Fisher JO, Johnson RK, Lindquist C, Birch LL, Goran MI. Influence of body composition on the accuracy of reported energy intake in children. Obes Res. 2000;8:597–603. doi: 10.1038/oby.2000.77. [DOI] [PubMed] [Google Scholar]
- 15.Beaton GH. Approaches to analysis of dietary data: relationship between planned analyses and choice of methodology. Am J Clin Nutr. 1994;59:253–61S. doi: 10.1093/ajcn/59.1.253S. [DOI] [PubMed] [Google Scholar]
- 16.Black AE, Goldberg GR, Jebb SA, Livingstone MB, Cole TJ, Prentice AM. Critical evaluation of energy intake data using fundamental principles of energy physiology: 2. Evaluating the results of published surveys. Eur J Clin Nutr. 1991;45:583–99. [PubMed] [Google Scholar]
- 17.Goldberg GR, Black AE, Jebb SA, et al. Critical evaluation of energy intake data using fundamental principles of energy physiology: I. Derivation of cut-off limits to identify under-recording. Eur J Clin Nutr. 1991;45:569–81. [PubMed] [Google Scholar]
- 18.McCrory MA, Hajduk CL, Roberts SB. Procedures for screening out inaccurate reports of dietary energy intake. Public Health Nutr. 2002;5:873–82. doi: 10.1079/PHN2002387. [DOI] [PubMed] [Google Scholar]
- 19.Huang TT, Roberts SB, Howarth NC, McCrory MA. Effect of screening out implausible energy intake reports on relationships between diet and BMI. Obes Res. 2005;13:1205–17. doi: 10.1038/oby.2005.143. [DOI] [PubMed] [Google Scholar]
- 20.Huang TT, Howarth NC, Lin BH, Roberts SB, McCrory MA. Energy intake and meal portions: associations with BMI percentile in U.S. children. Obes Res. 2004;12:1875–85. doi: 10.1038/oby.2004.233. [DOI] [PubMed] [Google Scholar]
- 21.Cleveland LE, Cook A, Krebs-Smith SM. Method for assessing food intakes in terms of servings based on food guidance. Am J Clin Nutr. 1997;65:1254–63s. doi: 10.1093/ajcn/65.4.1254S. [DOI] [PubMed] [Google Scholar]
- 22.Kuczmarski RJ, Ogden CL, Grummer-Strawn LM, et al. CDC growth charts: United States. Adv Data. 2000:1–27. [PubMed] [Google Scholar]
- 23.Reynolds CR, Richmond BO. What I think and feel: a revised measure of children’s manifest anxiety. J Abnorm Child Psychol. 1978;25:15–20. doi: 10.1023/a:1025751206600. [DOI] [PubMed] [Google Scholar]
- 24.Killen JD, Taylor CB, Hayward C, et al. Pursuit of thinness and onset of eating disorder symptoms in a community sample of adolescent girls: a three-year prospective analysis. Int J Epidemiol. 1994;16:227–38. doi: 10.1002/1098-108x(199411)16:3<227::aid-eat2260160303>3.0.co;2-l. [DOI] [PubMed] [Google Scholar]
- 25.van Strien T. Success and failure in measurement of restraint: notes and data. Int J Eat Disord. 1999;25:441–9. doi: 10.1002/(sici)1098-108x(199905)25:4<441::aid-eat9>3.0.co;2-b. [DOI] [PubMed] [Google Scholar]
- 26.Birch LL, Fisher JO, Grimm-Thomas K, Markey CN, Sawyer R, Johnson SL. Confirmatory factor analysis of the Child Feeding Questionnaire: a measure of parental attitudes, beliefs and practices about child feeding and obesity proneness. Appetite. 2001;36:201–10. doi: 10.1006/appe.2001.0398. [DOI] [PubMed] [Google Scholar]
- 27.Institute of Medicine . Dietary Reference Intakes for Energy, Carbohydrate, Fiber, Fat, Fatty Acids, Cholesterol, Protein, and Amino Acids, Part I. Academy of Sciences; Washington, DC: 2002. [DOI] [PubMed] [Google Scholar]
- 28.Black AE. Critical evaluation of energy intake using the Goldberg cut-off for energy intake: basal metabolic rat: a practical guide to its calculation, use and limitations. Int J Obes Relat Metab Disord. 2000;24:1119–30. doi: 10.1038/sj.ijo.0801376. [DOI] [PubMed] [Google Scholar]
- 29.Tooze JA, Subar AF, Thompson FE, Troiano R, Schatzkin A, Kipnis V. Psychosocial predictors of energy under-reporting in a large doubly labeled water study. Am J Clin Nutr. 2004;79:795–804. doi: 10.1093/ajcn/79.5.795. [DOI] [PubMed] [Google Scholar]
- 30.Ogden CL, Flegal KM, Carroll MD, Johnson CL. Prevalence and trends in overweight among US children and adolescents, 1999-2000. JAMA. 2002;288:1728–32. doi: 10.1001/jama.288.14.1728. [DOI] [PubMed] [Google Scholar]
- 31.Horner NK, Patterson RE, Neuhouser ML, Lampe JW, Beresford SA, Prentice RL. Participant characteristics associated with errors in self-reported energy intake from the Women’s Health Initiative food-frequency questionnaire. Am J Clin Nutr. 2002;76:766–73. doi: 10.1093/ajcn/76.4.766. [DOI] [PubMed] [Google Scholar]
- 32.Johnson RK, Goran MI, Poehlman ET. Correlates of over- and under-reporting of energy intake in healthy older men and women. Am J Clin Nutr. 1994;59:1286–90. doi: 10.1093/ajcn/59.6.1286. [DOI] [PubMed] [Google Scholar]
- 33.Worsley A, Baghurst KI, Leitch DR. Social desirability response bias and dietary inventory responses. Hum Nutr Appl Nutr. 1984;38:29–35. [PubMed] [Google Scholar]
- 34.Chambers Et, Godwin SL, Vecchio FA. Cognitive strategies for reporting portion sizes using dietary recall procedures. J Am Diet Assoc. 2000;100:891–7. doi: 10.1016/s0002-8223(00)00259-5. [DOI] [PubMed] [Google Scholar]