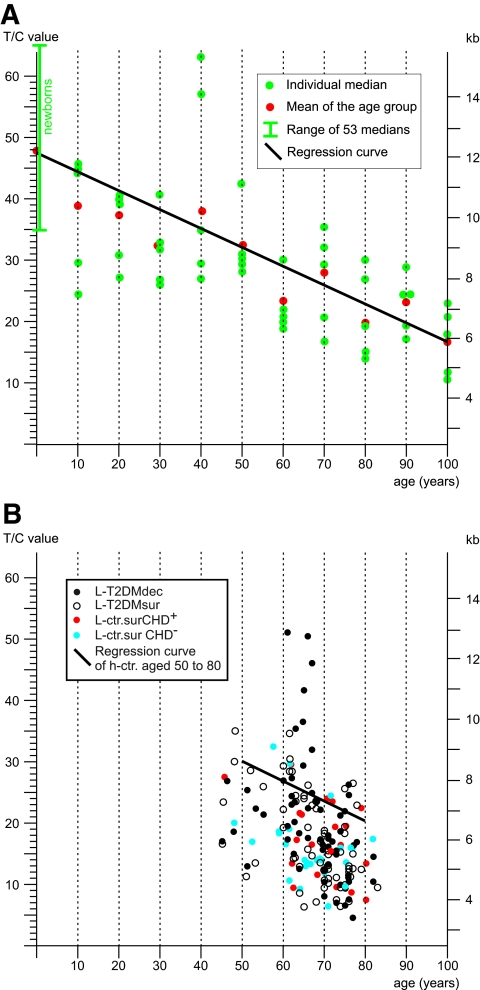
FIG. 3.
Telomere shortening between healthy control subjects and the LURIC cohort. Telomere shortening of control subjects (h-ctr) (A) and the LURIC cohort (B) is shown by their individual medians (dots) and resulting regression curves. The x-axis gives the age of the donor, and the y-axis gives the T/C ratios of fluorescence intensities on the left and the scale of kilobase pairs (kb) on the right. T2DM, type 2 diabetes.

