Abstract
The chromatic content (saturation) of monochromatic stimuli (480, 505, 577, and 650 nm) was scaled as a function of field size at three different retinal locations by 58 observers ranging from 18 to 83 yr of age. The different retinal locations (6 deg nasal, 2.5 deg inferior and 6 deg temporal eccentricity) were chosen according to anatomical studies demonstrating different degrees of senescent losses of cones or ganglion cells. Nine field sizes were tested, ranging from 0.0096 to 0.96 deg in diameter. The subjects used a percentage scale to judge the saturation of the flashed stimulus presentations (2 s on, 5 s off). The data analysis demonstrated that older observers require larger field sizes than younger observers to perceive hue as well as larger field sizes to reach the same level of scaled saturation. The spatial dependency of color appearance for younger and older observers was not correlated with senescent losses in retinal cells reported for the different retinal locations. The data were modeled by using an impulse-response function (i.e., Naka–Rushton equation) so that perceptive fields could be compared to electrophysiological measures of receptive fields or dendritic fields of retinal and cortical cells.
1. INTRODUCTION
Color vision, probed with small spots, has been described as trichromatic in a central region of the human retina (except for a tiny region of the foveola), surrounded by two zones, an intermediate dichromatic zone and a far peripheral monochromatic zone.1,2 The size of these peripheral zones depends on the spatial scale of the test stimuli, and, indeed, when stimuli are suitably scaled in size, fovealike color vision can be experienced out to at least 45 deg retinal eccentricity.3-7 Abramov et al.6 obtained hue-scaling data at a series of retinal loci and found that hue increased with field size up to an asymptotic level at each locus, “as if some perceptive field was being filled, by analogy to similar results from receptive fields of neurons” (p. 405; see also Refs. 8 and 9). The size of these perceptive fields increased with retinal eccentricity as would be expected from spatial summation studies,10,11 but at each retinal locus the perceptive fields were larger than those obtained from threshold experiments. Abramov et al. argued that their findings might be influenced by the number of spectrally opponent (color-coded) ganglion cells, as their numbers decrease with eccentricity,12 and many nonopponent cells become spectrally opponent if the stimulus size is increased.13,14 More recent evidence for this hypothesis was reported by Volbrecht et al.,11 who found a relation between ganglion cell density and psychophysically measured spatial summation of short-wave-sensitive and long-wave-sensitive cone pathways. The findings of these studies suggest the hypothesis that age-related retinal cell loss might influence hue perception if a stimulus falls below a critical size. As stimulus size is increased, differences between younger and older observers would be expected to diminish. Indeed, previous work15,16 has shown that with 1.2−2 deg stimuli, younger and older observers differ rather modestly in scaled hue and saturation.
To determine whether senescent losses of retinal cells influence the critical spatial dimensions over which hue is perceived, stimuli were presented at retinal locations for which there have been demonstrated losses in cone or ganglion cell numbers, i.e., cone loss at 2.5 deg eccentricity in the inferior retina and ganglion cell loss at 6 deg nasal eccentricity.17,18 A third location at 6 deg eccentricity in the temporal retina served as a reference location, i.e., with no significant age-related cone or ganglion cell loss. Our working hypothesis was that cone losses should lead to a shallower increase of saturation as a function of field size. This hypothesis is based on a study by Cicerone and Nerger,19 who found steeper detection functions when the stimulus was imaged on larger numbers of photoreceptors. Ganglion cell loss might, however, lead to an increased minimum field size for color detection, whereas the hues of large fields should be relatively constant with age, owing to an overfilling of chromatic perceptive fields. The possibility that certain hue mechanisms may be more affected by senescent cell loss than others was evaluated by using four different wavelengths near unique-hue loci. These data may thus be related to the neural weightings of the cone signals by spectrally opponent mechanisms. The functions relating saturation to field size were modeled with an impulse-response function (i.e., Naka–Rushton equation20). We discuss the influence of the model on estimates of perceptive-field sizes and the neural loci that might limit age-related changes in detection of hue for small fields.
2. METHODS
A. Observers
Fifty-eight volunteers (30 females and 28 males) approximately equally distributed over the range from 18 to 83 yr of age completed the testing. At the time of testing, none of the subjects reported having any systemic, ocular, or neurological disease known to disrupt the visual system. None of the subjects were taking medications known to interfere with normal visual functioning. Undilated direct ophthalmoscopy was performed on all subjects to rule out the presence of retinal disease of the posterior pole and abnormal ocular media. Additionally, all subjects ≥50 yr of age were found to be free of retinal disease by a licensed optometrist or ophthalmologist using indirect ophthalmoscopy. All subjects had a corrected visual acuity of 20/30 or better when tested with the Bailey–Lovie Eye Chart #4. The participants were all normal trichro-mats according to a battery of tests that included the Farnsworth Panel D-15 test, the F-2 tritan plate, American Optical Hardy–Rand–Ritter pseudoisochromatic plates and Rayleigh matches on a Neitz anomaloscope. Before any testing, written informed consent was obtained from all subjects.
B. Apparatus
Stimuli were produced by two channels of a conventional Maxwellian-view optical system. The source was a 1-kW xenon arc lamp powered by a regulated dc supply. Water baths were used to filter out infrared radiation. The stimuli were rendered monochromatic by use of narrow-band interference filters (Ditric Optics) or a holographic grating monochromator (Instruments SA, V-20) having 8-nm half-band passes. Calibrated neutral density filters and wedges were placed in collimated and focused portions of the beams, respectively. Wedge positions were computer controlled and monitored with potentiometers and a linear readout system. Mirrors were front surfaced, and lenses were achromatic doublets. Presentations of square-wave test flashes were controlled by a calibrated mechanical shutter (Vincent Associates) and custom timing circuitry. To produce square-wave flicker for heterochromatic flicker photometry (HFP), two light channels were combined using a rotating sectored mirror. A 0.04-mm-diameter aperture illuminated by a white LED served as a fixation point. The final Maxwellian-view lens focused a 1.5-mm-diameter image onto the plane of the observer's pupil. Observers were aligned with respect to the optic axis of the Maxwellian-view optical system by use of a dental-impression bite bar mounted to a milling-machine table that permitted adjustments along three orthogonal directions. The position of the subject's eye in relation to the Maxwellian-view image was evaluated with a pupil viewer.
C. Calibrations
Radiometric measurements of the spectral lights and calibrations of the neutral density wedges and filters were made using a silicon photodiode and linear read-out system (United Detector Technology, 81 Optometer) that was calibrated relative to the standards of the National Institute of Standards and Technology. Photometric measurements were made with a Minolta Chroma meter (CS-100) and barium sulfate plate and were then converted to retinal illuminance by the method outlined by Westheimer.21 The monochrometer was calibrated at a series of spectral lines emitted by Hg and Ne low-pressure calibration lamps (Oriel, Hg 6034, Ne 6032).
D. Procedure
The primary goal of this study was to measure age-related changes in scaled saturation for younger and older observers by using stimuli varying in retinal area and wavelength. The retinal illuminance of the test stimuli was held approximately constant across different wavelengths and observers by equating them to a 2.6-logtroland, 560-nm standard, by means of HFP. At each tested location, the target (0.5 deg diameter) was flickered at 20 to 25 Hz in square-wave counterphase to the reference light. No background was used. The subject's task was to find a flicker null by using the method of adjustment. It has been shown that rods do not influence hue perception at this retinal illuminance.22,23 At least three flicker-null settings were gathered for each condition (i.e., three retinal locations and four different wavelengths), presented in randomized order. In control experiments, the influence of target size on HFP settings was tested and found to be negligible, at least for the target sizes usable for HFP, and within the range selected for hue scaling.
Before collecting scaling data, we explained the task to the subject by showing samples from the Natural Color System NCS of the Scandinavian Color Institute, Stockholm (med A9 färghäften, 1992). Subjects were provided practice sessions before data collection commenced. During these sessions, the pupil viewer was used to check for good fixation. Data collection started after reliable performance was achieved.
Scaling data were obtained following 8 min dark adaptation, using test flashes of 2 s duration with 5 s inter-stimulus intervals. The subject was asked to assign percentages to describe the chromatic content of stimuli, with zero implying an achromatic appearance. Stimuli were repeated until the subject could make a confident response as to the saturation of the test stimuli. Four different test wavelengths (480, 505, 577, and 650 nm) and nine field sizes (0.0096, 0.019, 0.041, 0.063, 0.11, 0.14, 0.24, 0.5, and 0.96 deg diameter) were presented in a randomized order for each retinal location (2.5 deg inferior, 6 deg temporal, and 6 deg nasal eccentricity). The first three wavelengths correspond to the mean values of spectral unique hues previously determined for 50 subjects, varying from 13 to 74 yr of age.24 Unique red is extraspectral. At least three saturation estimates were collected for each condition, requiring four to six 2-h sessions per subject.
E. Data Analysis and Modeling
An arcsine transformation was applied to the raw data of each subject and condition before averaging in order to equalize the variances. To quantitatively describe the relation between saturation and field size, we used an impulse-response function, i.e., the Naka–Rushton equation [Eq. (1)].20 There is no theoretical significance attached to our use of this function, but from different models tested (e.g., the Michaelis–Menten equation used by Abramov et al.6), the Naka–Rushton equation provided the best fits to the data with the least number of parameters. The equation was
| (1) |
where r = response (%), rm = maximum response (%), n is related to the slope of the function, dia = stimulus field size (deg), and k (deg) = 0.5rm ; i.e., k equals the field size at which scaled saturation reaches half of its maximum value. To compare our results with those of Abramov et al.6 we chose 75% of the asymptotic value rm as the critical field size (corresponding to 3k) for a given test wavelength and retinal location. The fitting procedure was based on a least-squares minimization by using the Marquard–Levenberg algorithm implemented in Sigma Plot 2000 (SPSS). Fits with Eq. (1) to data from two observers are shown in Fig. 1.
Fig. 1.
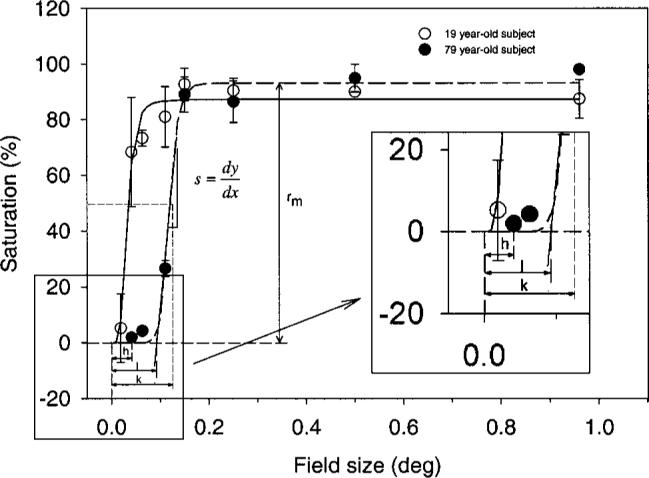
Saturation scaling data of a younger (19 yr, open circles) and an elderly (79 yr, solid circles) subject plotted as a function of field size for a 480-nm stimulus, presented at 2.5 deg inferior retina. Smooth curves show model fits with a Naka–Rushton function [Eq. (1)]. The parameters used to describe the data are also illustrated for the older subject.
In addition to parameters for the maximum saturation (rm , in %) and the field size corresponding to 50% of rm (k in deg), which were derived directly from the Naka–Rushton equation, we also calculated the first derivative of the function and a tangent line to the maximum slope (s in % deg−1). The intersection of the tangent line with the x axis represents the field size (parameter I in deg), where saturation rises significantly above zero. Although the value of n of the Naka–Rushton equation was treated as a free parameter for fitting the data, we summarized the rising part of the fitted function in terms of s, as described above, because n is complex and offers no easy interpretation. We also analyzed the minimum stimulus size at which hue was first reported (h in deg) by each observer, using the raw data independently of any model fits.
The various parameters at each wavelength and retinal locus were correlated with age using least-squares linear regression. Before statistical evaluation, outliers were identified by objective criteria [Cook's Distance, Studentized Deleted Residuals also implemented in Sigma Plot 2000 (SPSS)] and removed. On average, six outliers were identified per stimulus condition, but these were not related to particular individuals or age groups. In general, the calculated slope of the Naka–Rushton model was responsible for the largest number of outliers per condition. We return to this point in the next section. A p value ≤0.05 was required in a t test for the slope of the line to be judged as significantly different from zero. The same tests and criteria were applied to determine whether there were significant differences between different retinal locations or stimulus wavelengths.
3. RESULTS
At all retinal locations tested, the perceived saturation of each test wavelength increased with field size up to an asymptotic level. Figure 1 illustrates data sets from a younger and an older observer for the 480-nm test light at 2.5 deg inferior eccentricity. The solid and dashed curves correspond to the Naka–Rushton model fitted to each data set. Scaled saturation of the younger subject shows an immediate steep rise, whereas the elderly observer required larger field sizes before hue was first reported (parameter h). Even then, the saturation stayed at a lower level until a certain stimulus size (parameter I) was reached. Thereafter, the two data sets show approximately the same slope (parameter s) until they level off at approximately the same saturation level (parameter rm). This level appears to be stable with further increases of stimulus size but was less than 100%, as expected from previous work.6
Although there is substantial inter-individual variability, the pattern of results seen in Fig. 1 is representative for all subjects at corresponding ages. This is made obvious in Figs. 2-6, where we show parameter values for all subjects based on a 505-nm test light presented at 6 deg temporal eccentricity. Figure 2 demonstrates that during aging, increasingly larger field sizes are needed to perceive hue (parameter h). Plotted are the mean ages of those subjects for whom the stimulus size corresponded to their minimal field size for perception of hue. The solid line illustrates the increase of parameter h with age. Note that this parameter is based on the raw data, not on modeling. This explains the localization of the data points on the x axis around the target sizes of 0.0096, 0.019, and 0.041 deg diameter and also that the error bar must be calculated for the age variable and not for the field size. The senescent increase in minimal field size for hue perception is statistically significant ( p < 0.05). This finding holds for all wavelengths and retinal locations tested. Almost the same is true for parameter I, which indicates the field size at which saturation rises steeply with increasing field size (see Fig. 1 and Subsection 2.E for details). The values of this fitting parameter for the entire pool of subjects for our 505-nm, 6 deg temporal test condition are presented in Fig. 3.
Fig. 2.
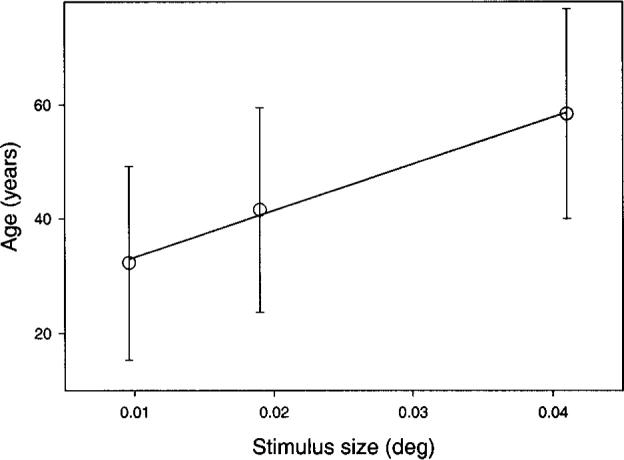
Mean age at which hue was first detected (parameter h) plotted as a function of test stimulus size (deg) for a 505-nm test light presented at 6 deg temporal eccentricity. Error bars denote ±1 SD of those subjects for whom the corresponding stimulus size was the minimal field size to perceive hue. The solid line is based on a least-squares linear regression, which was statistically significant (r = 0.96).
Fig. 6.
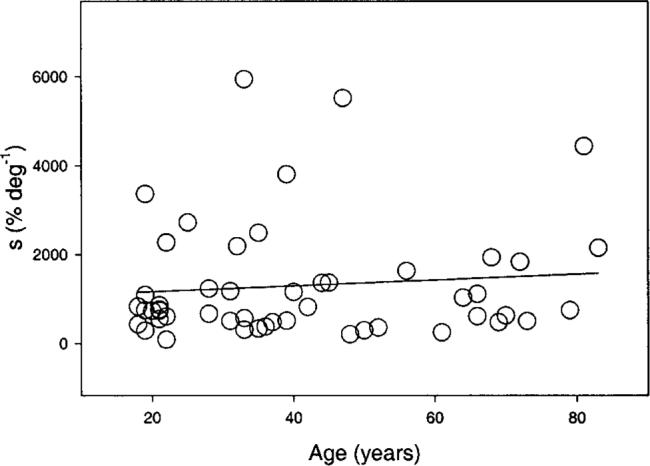
Data points correspond to the maximum slope of the Naka–Rushton modeling for a 505-nm test light presented at 6 deg temporal eccentricity. The solid line is based on a linear regression fit, which was not statistically significant.
Fig. 3.
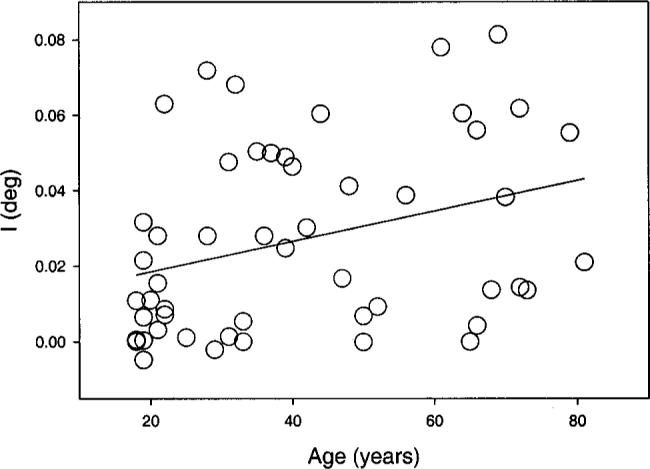
Intersection I, corresponding to the stimulus size at which the Naka–Rushton model fit starts to rise significantly from zero. This parameter shows a statistically significant change with age. The data are from the 505-nm test light presented at 6 deg temporal eccentricity. A linear regression fitted to the data points is shown by the solid line (r = 0.4). This corresponds to an increase of ∼10% per decade.
The field size I is plotted in Fig. 3 as a function of age with a linear regression line showing a small but statistically significant age-related increase of this parameter (p < 0.05). Although all test conditions revealed an increase of intersection I with age, not all of them reached the criterion statistical significance level. There are four exceptions: (i) 650 nm, 2.5 deg inferior; (ii) 480 nm, 6 deg temporal; and (iii) 480 nm and (iv) 650 nm, 6 deg nasal. Figure 4 demonstrates what happens for larger field sizes, defined by the fitting parameter k, which represents the field size at which the Naka–Rushton model has reached 50% of the maximum (rm). Here the age-related increase in required field size diminishes and is not statistically significant, although for all different test conditions the fitted regression line had a positive slope (illustrated for one condition in Fig. 4).
Fig. 4.
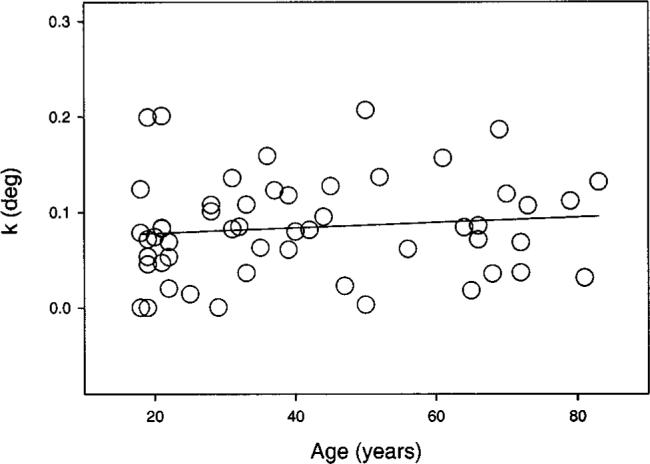
Naka–Rushton equation parameter k, corresponding to the field size where 50% of the maximum saturation rm was reached, is plotted as a function of age. Symbols show the values for a 505-nm test light presented at 6 deg temporal eccentricity. The solid line is based on the least-squares linear regression, which was not statistically significant.
As test field size increased, saturation leveled off and the fitted Naka–Rushton model finally reached its maximum saturation value rm . This parameter showed a large degree of individual variability, and for all conditions tested it did not change significantly with age. The results of our exemplary condition (505 nm, 6 deg temporal eccentricity) are shown in Fig. 5. Note that the final level of saturation rm is reached at relatively large field sizes, though in this case we do not compare the field sizes themselves but the saturation estimate in percent. The relation between field size and maximum saturation is deferred to Section 4. There we discuss the critical perceptive-field size defined by the stimulus size at which saturation reaches 75% of the maximum.
Fig. 5.
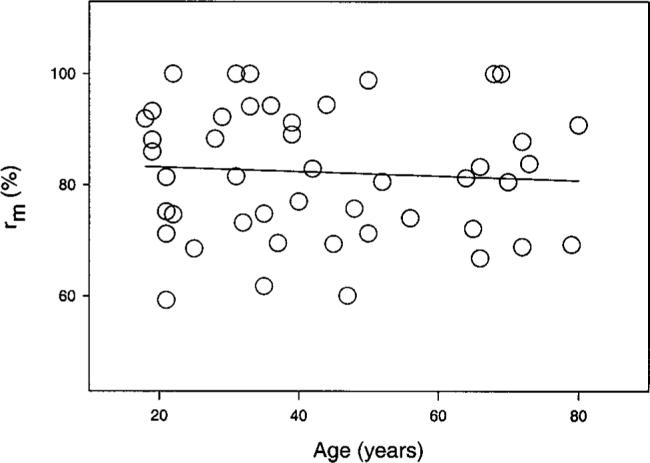
Maximum saturation value rm derived from the Naka–Rushton model plotted as a function of age. Data are based on a 505-nm test light presented at 6 deg temporal eccentricity. The slope of the least-squares linear regression equation was not statistically significant.
The parameter s plotted in Fig. 6 corresponds to the maximum slope of the Naka–Rushton model. This parameter shows a strikingly large inter-individual variability, but no statistically significant age-related change was found for any test condition. Of course, we cannot exclude the possibility that another fitting function would be more sensitive to small age-related changes in the slope, as expected from our hypotheses.
Table 1 summarizes the mean parameter values for all subjects in all test conditions, with two exceptions. For the parameters h and I corresponding to very small field sizes, we found a significant age-related change. Thus, in the table we present the slope of the fitted regression line. We do that also for the four conditions that did not reach statistical significance (0.06 < p < 0.09). Each wavelength and retinal location revealed about the same rate of increase in field size during aging. This is true for both the field size at which hue was first perceived, h, and the intersection, I, where saturation rises significantly from zero. In general, the age-related increase of parameter I per decade is a bit larger than for parameter h. For the different wavelengths, the 577-nm stimulus required the largest size before hue was detected, while hue in the 650-nm stimulus was detected with the smallest field size. The semisaturation parameter k shows the same characteristic. We will return to that when we compare our results with other studies in Section 4. For the maximum saturation value rm the 650-nm test stimulus was perceived as more saturated compared to the other wavelengths. The largest difference was found for the 2.5-deg inferior location. Finally, for the maximum slope s, the 577- and 650-nm test wavelengths are again the most extreme conditions, with 577 nm having the shallowest and 650 nm the steepest slope of the model fit at each location.
Table 1.
Parameters Used To Describe the Data Setsa
| Retinal Location | Stimulus Wavelength (nm) | Slope of h First Hue (deg/yr) | Slope of I Intersection (deg/yr) | k Semisaturation (deg) | rm Max. Saturation (%) | s Max. Slope (%/deg) |
|---|---|---|---|---|---|---|
| 2.5 deg Inferior | 480 | 0.238 × 10⁻⁴b | 0.283 × 10⁻⁴b | 0.0438 ± 0.032 | 83 ± 14 | 2483 ± 2428 |
| 505 | 0.188 × 10⁻⁴b | 0.417 × 10⁻⁴b | 0.0408 ± 0.025 | 82 ± 15 | 1646 ± 1360 | |
| 577 | 0.168 × 10⁻⁴b | 0.30 × 10⁻⁴b | 0.0759 ± 0.064 | 81 ± 15 | 1524 ± 1882 | |
| 650 | 0.195 × 10⁻⁴b | 0.287 × 10⁻⁴ | 0.0210 ± 0.016 | 91 ± 10 | 2718 ± 1934 | |
| 6 deg Temporal | 480 | 0.257 × 10⁻⁴b | 0.284 × 10⁻⁴ | 0.0838 ± 0.057 | 82 ± 15 | 1488 ± 1402 |
| 505 | 0.276 × 10⁻⁴b | 0.404 × 10⁻⁴b | 0.0840 ± 0.052 | 82 ± 13 | 1304 ± 1274 | |
| 577 | 0.265 × 10⁻⁴b | 0.323 × 10⁻⁴b | 0.1004 ± 0.067 | 86 ± 14 | 693 ± 482 | |
| 650 | 0.215 × 10⁻⁴b | 0.298 × 10⁻⁴b | 0.0492 ± 0.047 | 89 ± 10 | 1570 ± 1171 | |
| 6 deg Nasal | 480 | 0.172 × 10⁻⁴b | 0.409 × 10⁻⁴ | 0.0713 ± 0.036 | 82 ± 15 | 1169 ± 1011 |
| 505 | 0.160 × 10⁻⁴b | 0.413 × 10⁻⁴b | 0.0777 ± 0.043 | 83 ± 11 | 100 ± 830 | |
| 577 | 0.20 × 10⁻⁴b | 0.418 × 10⁻⁴b | 0.1017 ± 0.062 | 86 ± 14 | 756 ± 545 | |
| 650 | 0.191 × 10⁻⁴b | 0.260 × 10⁻⁴ | 0.0487 ± 0.050 | 89 ± 11 | 1462 ± 1364 |
Parameters are defined in Section 2 and by Fig. 1. Note that for the parameters k, rm, and s the mean values of the tested population are presented, as there was no age-related change. For parameters h and I, the slopes of the regression lines are presented, as these two parameters increase with age.
p < 0.05.
There seems to be a difference for the maximum slope s and the field size of the semisaturation parameter k for the three retinal locations. The slope of the Naka–Rushton model was about twice as large for the 2.5 deg inferior locus compared with the 6 deg nasal or temporal loci. The opposite is found for the parameter k; here the inferior location required field sizes about half the size of the two other locations. We could not, however, correlate the age-related changes with specific retinal locations at which senescent cone or ganglion cell losses were reported (2.5 deg inferior and 6 deg temporal eccentricity, respectively).
4. DISCUSSION
The results indicate that for observers of all ages, saturation increases with increasing field size up to an asymptotic level, in agreement with earlier results of Abramov et al.6 Our study differed from that of Abramov et al. in two respects: (1) It focused on age-related changes in hue perception, and (2) it employed much smaller test stimuli. The latter difference led us to use a different impulse-response function (i.e., Naka–Rushton equation) to model the data. The Michaelis–Menten function did not capture the shallow rising part of the function for small field sizes, which was exhibited by most data sets from elderly people (see Fig. 1). On the basis of these analyses, we conclude that for a fixed luminance level and retinal location, elderly observers require larger field sizes to perceive hue than do younger people (parameter h). This finding seems to be independent of test wavelength and retinal location. Elderly individuals also tend to require larger field sizes to perceive more-saturated colors. This is indicated by parameter I and corresponds to the beginning of the steep rise in the Naka–Rushton model. For this parameter there were significant age-related changes for all but four conditions. The latter cases might be due to the high variability in parameter I even with small changes in the quality of the fit. The slope of the age-related increase in required field size is about the same for the different test wavelengths, with an average value of 0.00034 for the intersection I and 0.0002 for parameter h. These slopes correspond to a 10% per decade increase in field size for both parameters.
Although not statistically significant, the perceived maximum saturation (rm) was always highest for the 650-nm test stimuli. For all test conditions, rm was not correlated significantly with age. Individual data sets span ranges between 40% and 100% maximum saturation for the different wavelengths and retinal locations. The failure for some subjects to perceive 100% saturation is not surprising. Scaled saturation of monochromatic test flashes varies from about 60% to 80% for foveal viewing3,25 and is less for peripherally viewed stimuli.3 These variations in saturation with wavelength represent a balance of chromatic and achromatic response. These differences are likely to also influence the maximum slope s of the Naka–Rushton model, which revealed two interesting findings. First, at all retinal locations, the steepest slope was found for the 650-nm test lights and the shallowest slope for the 577-nm stimulus. Second, the inferior location showed significantly steeper slopes than the two other locations, which were of the same magnitude. A steeper rise for the 2.5 deg inferior location is consistent with a dependence on the overall receptor density and ganglion cell density (independently of age), and differences among the putative underlying hue mechanisms may be related to relative chromatic and achromatic sensitivity. Importantly, for a fixed retinal eccentricity, a single spatial scalar cannot be used to model responses to all wavelengths.
The “critical” perceptive-field size, operationally defined by Abramov et al.6 as 3k, is shown in Fig. 7, which is adapted from their paper. This figure presents our results for the 6 deg temporal and nasal locations as open symbols. The results of Abramov et al. are denoted by solid symbols, and the dendritic tree sizes or receptive-field sizes originating from nonhuman primate studies26-28 are denoted by solid lines. We also show dendritic field sizes from human in-vitro studies29,30 as dotted lines.
Fig. 7.
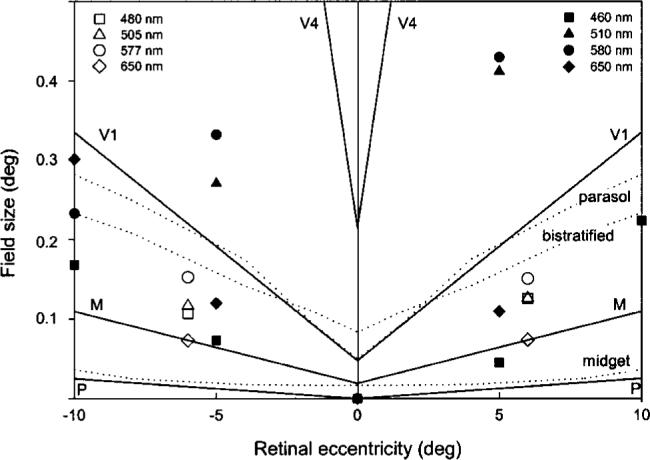
Critical perceptive-field sizes, defined as 3k, are compared with monkey and human dendritic and receptive-field sizes as a function of retinal eccentricity. Solid lines refer to nonhuman primate studies as summarized by Abramov et al.6 with P (parvocellular), M (magnocellular), V1 (striate cortex), and V4 representing receptive field sizes at different levels of visual processing. Dotted lines show dendritic field sizes for human parasol, bistratified, and midget ganglion cells.29,30 Solid symbols show the perceptive-field sizes calculated by Abramov et al.6 Open symbols represent the perceptive-field sizes for the 6 deg temporal and nasal locations calculated in the present study.
Our working hypothesis was that enlarged stimuli compensate for lower ganglion cell density beyond the fovea, producing similar cortical representations. Consistent with this hypothesis is a comparison of the results of the 2.5 deg inferior location to the 6 deg nasal and temporal locations. The inferior location (closer to the fovea) showed significantly smaller critical field sizes for each wavelength tested, whereas the temporal and nasal locations required about the same size (nasal–temporal asymmetries are larger at more peripheral eccentricities). At each location, the smallest field size was obtained for 650-nm stimuli and largest for 577-nm stimuli. More ganglion cell input to cortex may be required for the latter wavelength because it is less effective in stimulating chromatic mechanisms.
Abramov et al.6 calculated perceptive-field sizes, which they found to always be larger than dendritic field sizes of neurons in the primate retina and in some cases closer to receptive-field sizes measured electrophysiologically in cortical area V4. Thus, they concluded that the physiological substrate underlying their findings must be located at a cortical level. This is consistent with recent color-naming studies that imply a rotation of the genicu-late axes in cortex, albeit cortical area V1.31 The perceptive-field estimates of Abramov et al. are much larger for green and yellow than for red and blue. Their perceptive-field estimates for blue and red are within the range of human midget and bistratified cell dendritic field areas. We did not find such remarkable differences in perceptive-field sizes among putative hue mechanisms. All of our estimated critical field sizes for the different stimulus conditions fall somewhere between the receptive-field sizes of V1 and dendritic tree sizes of retinal ganglion cells in nonhuman primates, which project to the magnocellular layer of the lateral geniculate nucleus. A comparison with studies on human tissue reveals that our data fall between the dendritic field sizes of midget and bistratified cells. This comparison between physiological and psychophysical data is somewhat precarious, however, because of the arbitrary choice of 75% as the maximum value; other criteria would shift the cell type that is most similar to the empirical data. In general, perceptive-field sizes based on the Naka–Rushton model are smaller than those obtained using the Michaelis–Menten function. In addition, the stimulus sizes that exhibit an age-related increase such as parameters h (smallest field size, where hue is detected) and I (field size, where the steep slope of the Naka–Rushton model starts) are ∼0.02−0.03 deg in diameter, which would fit reasonably well with the speculation that the critical spatial constraint with respect to age-related changes in hue perception may have a retinal origin.
In conclusion, senescent changes of color perception are evident when they are probed with small field sizes, are reduced for increasing field sizes, and are not detectable at large field sizes. Contrary to our working hypothesis, age-related changes in color appearance could not be correlated to retinal asymmetries in senescent losses of photoreceptors or ganglion cells. One explanation might be that the retinal locations tested are based on anatomical studies, but inter-individual differences are prominent in both the anatomical and the psychophysical data. Whatever the mechanism, this study demonstrated significant age-related changes in the critical field size for perception of hue.
ACKNOWLEDGMENT
This research was supported by the National Institute on Aging (AG04058), a National Eye Institute core grant (EY12576), and a Jules and Doris Stein Research to Prevent Blindness Professorship. We gratefully acknowledge the help of Brooke Schefrin and Gudrun Gerteisen.
REFERENCES
- 1.Ferree CE, Rand G. Chromatic thresholds of sensation from center to periphery of the retina and their bearing on color theory. Psychol. Rev. 1919;26:16–41. [Google Scholar]
- 2.Moreland JD. Peripheral colour vision. In: Jameson D, Hurvich LM, editors. Visual Psychophysics, Vol. VII/4 of Handbook of Sensory Physiology. Springer; New York: 1972. pp. 517–536. [Google Scholar]
- 3.Gordon J, Abramov I. Color vision in the peripheral retina. II. Hue and saturation. J. Opt. Soc. Am. 1977;67:202–207. doi: 10.1364/josa.67.000202. [DOI] [PubMed] [Google Scholar]
- 4.van Esch JA, Koldenhof EE, van Doorn AJ, Koenderink JJ. Spectral sensitivity and wavelength discrimination of the human peripheral visual field. J. Opt. Soc. Am. A. 1984;1:443–450. doi: 10.1364/josaa.1.000443. [DOI] [PubMed] [Google Scholar]
- 5.Johnson MA. Color vision in the peripheral retina. Am. J. Optom. Physiol. Opt. 1986;63:97–103. doi: 10.1097/00006324-198602000-00003. [DOI] [PubMed] [Google Scholar]
- 6.Abramov I, Gordon J, Chan H. Color appearance in the peripheral retina. J. Opt. Soc. Am. A. 1991;8:404–414. doi: 10.1364/josaa.8.000404. [DOI] [PubMed] [Google Scholar]
- 7.Buck SL, Knight R, Fowler G, Hunt B. Rod influence on hue-scaling functions. Vision Res. 1998;38:3259–3263. doi: 10.1016/s0042-6989(97)00436-7. [DOI] [PubMed] [Google Scholar]
- 8.Abramov I, Gordon J. Color appearance in central and peripheral retina. J. Opt. Soc. Am. A. 1987;4:P38. doi: 10.1364/josaa.8.000404. [DOI] [PubMed] [Google Scholar]
- 9.Abramov I, Gordon J. Color appearance in peripheral retina: naso-temporal asymmetries. Invest. Ophthalmol. Visual Sci. Suppl. 1988;29:300. [Google Scholar]
- 10.Nagy AL, Doyal JA. Red–green color discrimination as a function of stimulus field size in peripheral retina. J. Opt. Soc. Am. A. 1993;10:1147–1156. doi: 10.1364/josaa.10.001147. [DOI] [PubMed] [Google Scholar]
- 11.Volbrecht VJ, Shrago EE, Schefrin BE, Werner JS. Spatial summation in human cone mechanisms from 0° to 20° in the superior retina. J. Opt. Soc. Am. A. 2000;17:641–650. doi: 10.1364/josaa.17.000641. [DOI] [PMC free article] [PubMed] [Google Scholar]
- 12.Zrenner E, Gouras P. Cone opponency in tonic ganglion cells and its variation with eccentricity in rhesus monkey retina. In: Mollon JD, Sharpe LT, editors. Colour Vision: Physiology and Psychophysics. Academic; London: 1983. pp. 211–223. [Google Scholar]
- 13.De Valois RL, De Valois KK. Neural coding of color. In: Carterette EC, Friedman MP, editors. Handbook of Perception. Vol. 5. Academic; New York: 1975. pp. 117–166. [Google Scholar]
- 14.Krüger J. Stimulus dependent colour specificity of monkey lateral geniculate neurons. Exp. Brain Res. 1977;30:297–311. doi: 10.1007/BF00237257. [DOI] [PubMed] [Google Scholar]
- 15.Schefrin BE, Werner JS. Age-related changes in the color appearance of broadband surfaces. Color Res. Appl. 1993;18:380–389. [Google Scholar]
- 16.Kraft JM, Werner JS. Aging and the saturation of colors. 2. Scaling of color appearance. J. Opt. Soc. Am. A. 1999;16:231–235. doi: 10.1364/josaa.16.000231. [DOI] [PubMed] [Google Scholar]
- 17.Curcio CA, Drucker DN. Retinal ganglion cells in Alzheimer's disease and aging. Ann. Neurol. 1993;33:248–257. doi: 10.1002/ana.410330305. [DOI] [PubMed] [Google Scholar]
- 18.Curcio CA, Millican CL, Allen KA, Kalina RE. Aging of the human photoreceptor mosaic. Invest. Ophthalmol. Visual Sci. 1993;34:3278–3296. [PubMed] [Google Scholar]
- 19.Cicerone CM, Nerger JL. The relative numbers of long-wavelength-sensitive to middle-wavelength-sensitive cones in the human fovea centralis. Vision Res. 1989;29:115–128. doi: 10.1016/0042-6989(89)90178-8. [DOI] [PubMed] [Google Scholar]
- 20.Naka KI, Rushton WA. S-potentials from colour units in the retina of fish (Cyprinadae) J. Physiol. 1966;185:587–599. doi: 10.1113/jphysiol.1966.sp008001. [DOI] [PMC free article] [PubMed] [Google Scholar]
- 21.Westheimer G. The Maxwellian view. Vision Res. 1966;6:669–682. doi: 10.1016/0042-6989(66)90078-2. [DOI] [PubMed] [Google Scholar]
- 22.Stabell U, Stabell B. Wavelength discrimination of peripheral cones and its change with rod intrusion. Vision Res. 1976;17:423–426. doi: 10.1016/0042-6989(77)90034-7. [DOI] [PubMed] [Google Scholar]
- 23.Nagy AL, Wolf S. Red–green color discrimination in peripheral vision. Vision Res. 1993;33:235–242. doi: 10.1016/0042-6989(93)90161-o. [DOI] [PubMed] [Google Scholar]
- 24.Schefrin BE, Werner JS. Loci of unique hues throughout the life span. J. Opt. Soc. Am. A. 1990;7:305–311. doi: 10.1364/josaa.7.000305. [DOI] [PubMed] [Google Scholar]
- 25.Kaiser PK, Comerford JP, Bodinger DM. Saturation of spectral lights. J. Opt. Soc. Am. 1976;66:818–826. [Google Scholar]
- 26.Tootell RBH, Switkes E, Silverman MS, Hamilton SL. Functional anatomy of macaque striate cortex. II. Retinotopic organization. J. Neurosci. 1988;8:1531–1568. doi: 10.1523/JNEUROSCI.08-05-01531.1988. [DOI] [PMC free article] [PubMed] [Google Scholar]
- 27.Desimone R, Schein SJ. Visual properties of neurons in area V4 of macaque: sensitivity to stimulus form. J. Neurophysiol. 1987;57:835–868. doi: 10.1152/jn.1987.57.3.835. [DOI] [PubMed] [Google Scholar]
- 28.Shapley R, Perry VH. Cat and monkey retinal ganglion cells and their visual functional roles. Trends Neurosci. 1986;9:229–235. [Google Scholar]
- 29.Dacey DM, Petersen MR. Dendritic field size and morphology of midget and parasol ganglion cells of the human retina. Proc. Natl. Acad. Sci. USA. 1992;89:9666–9670. doi: 10.1073/pnas.89.20.9666. [DOI] [PMC free article] [PubMed] [Google Scholar]
- 30.Dacey DM. Morphology of a small-bistratified ganglion cell type in the macaque and human retina. Visual Neurosci. 1993;10:1081–1098. doi: 10.1017/s0952523800010191. [DOI] [PubMed] [Google Scholar]
- 31.DeValois RL, DeValois KK, Switkes E, Mahon L. Hue scaling of isoluminant and cone-specific lights. Vision Res. 1997;37:885–897. doi: 10.1016/s0042-6989(96)00234-9. [DOI] [PubMed] [Google Scholar]


