Abstract
Purpose
To determine age-related changes in retinal response dynamics derived from multifocal electroretinograms (mfERGs).
Methods
MfERG data were obtained from 70 subjects with normal phakic eyes, age 9 to 80 years. Whereas the first- and higher-order kernels resulting from the mfERG contain detailed information regarding the nonlinear response dynamics of the retina, they do not lend themselves directly to an easy and intuitive interpretation. To achieve a better appreciation of fast adaptive mechanisms and their changes with aging, regional averages of the kernel series were translated at different retinal eccentricities (0°−5°, 5°−15°, and 15°−25°) into responses generated in different contexts. Specifically, the effect of aging on responses to stimuli presented in isolation was compared with the effect on responses adapted by preceding stimuli (“forward” effect). The interference of the immediately following stimuli with the response generation (“backward effect”) was also considered.
Results
Age-related changes were found in the isolated flash response as well as in the backward and forward interactions between consecutive flash responses. Larger fractional changes with age were found in response density than in implicit time, and the rate of change with age was larger for responses to isolated flashes than for responses adapted by preceding flashes.
Conclusions
Senescent changes in the isolated flash response and in consecutive flash interactions derived from the binary kernel series indicate an aging process at an early stage in the visual system. Mechanisms of retinal adaptation may partially compensate for age-related reductions in the isolated flash response.
Age-related changes in first-order multifocal electroretinogram (mfERG) responses have been described recently.1-6 Those responses were derived using the mfERG technique developed by Sutter and Tran,7,8 which permits recording and analysis of multiple focal retinal responses. Analyses of mfERG responses have revealed age-related changes in both response density and implicit time. After correcting the data for optical factors, a significant contribution of neural changes to the mfERG responses remains.3,5 The purpose of this study was to examine further the senescent neural changes in retinal response—specifically, age-related changes in response dynamics.
The temporal dynamics of a linear system, or an element within the system, can be characterized by its impulse response function (IRF), which is the response to a light pulse of short duration. The IRF has been used to characterize the dynamic properties of primate photoreceptors9 and ganglion cells.10 Psychophysically, an IRF can be estimated by means of a two-pulse method11 or the temporal contrast sensitivity function.12,13 However, the description of visual responses by a single IRF is an oversimplification, as the visual system is highly nonlinear. The impulse response depends on the temporal and often spatial contexts in which the stimulus is presented and cannot be described by a single invariant function. Tests with single, double, and multiple flashes are needed to gain an adequate understanding of response dynamics. In the mfERG, such testing occurs at each discrete retinal location during the presentation of a stimulus sequence. The results from this complex test are directly available in the form of a mathematical expansion—the binary kernel series. Although the interpretation of the series in physiological terms is often difficult, transformation of the data into a more intuitive form is possible.14,15 From the binary kernel series one can derive and compare responses to flash sequences. In particular, a single-flash response in the context of no other flashes can be compared with responses in the context of preceding and following flashes, using procedures described by Sutter.14,15 In the present study, we used the transformation from the kernel series to single and multiple-flash responses, to gain a better understanding of fast adaptive mechanisms in the retina and to study their age-related changes.
Materials and Methods
Subjects
mfERG data from one eye of each of 70 subjects with normal phakic eyes, ages 9 to 80 (n = 10 each decade, 10 to 70 years; n = 9, age 71 to 80; and n = 1, a 9-year-old boy) were analyzed in the present study. (One subject from the original data set3 who exhibited one druse >63 μm was not included in the current analysis to avoid biased results, in particular in the analysis of retinal adaptive effects.) The presence of retinal diseases or abnormal ocular media in the tested eye was carefully excluded, as described previously.3 Written informed consent was obtained in compliance with the tenets of the Declaration of Helsinki and with the approval of the Office of Human Research Protection of the University of California, Davis, School of Medicine.
Procedure and mfERG Stimulus
mfERGs were recorded in eyes with dilated pupils, a bipolar Burian-Allen contact lens electrode, a stimulus-refractor unit with a frame rate of 75 Hz (Electro-Diagnostic Imaging [EDI]; San Mateo, CA), and visual response imaging system software (VERIS, ver. 4.3; EDI). The stimulus consisted of 103 scaled hexagons flashed pseudorandomly at intervals of 13.3 ms on a dark background (<1 cd · m−2) using an m-sequence length with m = 14, resulting in a total recording time of 3.38 minutes. The flash intensity was 2.67 cd-sec · m−2 (200 cd · m−2/75 Hz). Signals were sampled at 1200 Hz at a gain of 105 over a frequency range of 10 to 300 Hz (preamplifier CP 511; Grass-Telefactor, Inc., West Warwick, RI). (For more detailed information, see Ref. 3.)
Response Analysis
“Isolated flash responses” and various flash interactions were analyzed for retinal areas defined by three concentric rings (Fig. 1).
Figure 1.
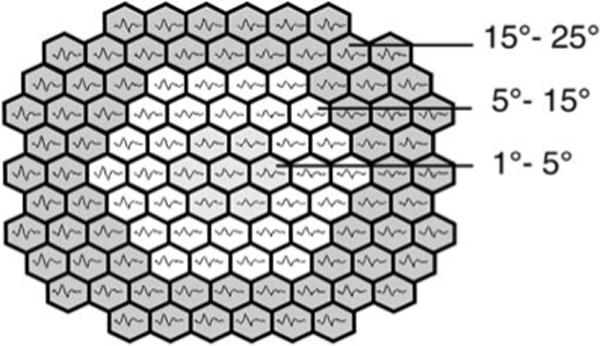
The three retinal areas (central 5°, 5°−15°, and 15°−25°) analyzed are illustrated on a response array.
Isolated flash responses were derived for each subject from the binary kernel series as described in detail by Sutter,11,12 using visual response imaging software (VERIS, ver. 5.0; EDI). For example, the response to an isolated flash was derived by subtracting from the first-order kernel all effects from previous flash presentations as well as effects from following flash responses (induced components). This is accomplished by subtracting appropriate combinations of higher-order kernels shifted by integral multiples of the base period of stimulation (in this case 13.3 ms). Responses to flash sequences were similarly derived and compared. Effects of lateral interactions in the retina were ignored, because they are known to be relatively small under the stimulus conditions used.14,15 Only kernel slices with waveforms that were visible in noise were included in the analysis. Their epoch length was selected to cover all their induced components until they disappeared in the noise. In the present analysis the first-order kernel was included with an epoch of 0 to 110 ms while an epoch of 0 to 90 ms was used for the second- to third-order kernel slices. Kernels higher than the third order were not included in the synthesis because of their small amplitudes. What is called an “isolated flash response” in this article is not to be confused with a response to a flash presented to a dark-adapted retina. Rather, it is the response to a flash in the absence of effects from immediately preceding flash stimuli and induced components from the following flash responses. Although slow adaptive mechanisms in the retina that extend over seconds and minutes set the general adaptation level, they are not directly represented in the kernel series under the conditions of fast pseudorandom stimulation used in this study. The isolated flash responses derived from the kernel series can therefore be compared only with single-flash responses obtained under similar adaptation conditions.
To further investigate the fast adaptive interactions between consecutive flash responses, single-flash responses in the context of one preceding or following flash were extracted. Details of different models are explained in the Results section.
No artifact rejection or spatial smoothing was applied. Implicit times of N1 (first negative trough) and P1 (first positive peak) and amplitudes P1 – N1 were analyzed for each of the specified areas, unless otherwise stated. Amplitudes were measured on the response density scaled regional averages.
Statistical Analysis
Raw values for each subject were transformed to decadic logarithms to facilitate an analysis of the proportional change across age and condition. The data were analyzed using regression statistics applied to the entire sample. An analysis of covariance (ANCOVA) was used to compare within-subject differences in responses across areas and conditions, according to the methods of Judd et al.16
Results
Isolated Flash Response
Figure 2 shows the synthesized isolated flash responses for the three retinal areas of four typical observers over the age range tested. (Data from the same four observers are used to illustrate other responses derived from the mfERG in Figures 6, 7, and 9) In the top left, the measured parameters (implicit times N1 and P1 and response density P1 – N1) are illustrated. The bottom schematic demonstrates the flash sequence. The unfilled bar represents the computed flash response and the filled symbols denote nonflash responses. These four examples illustrate the typical decline in response density and increase in implicit time with age in our cohort.
Figure 2.
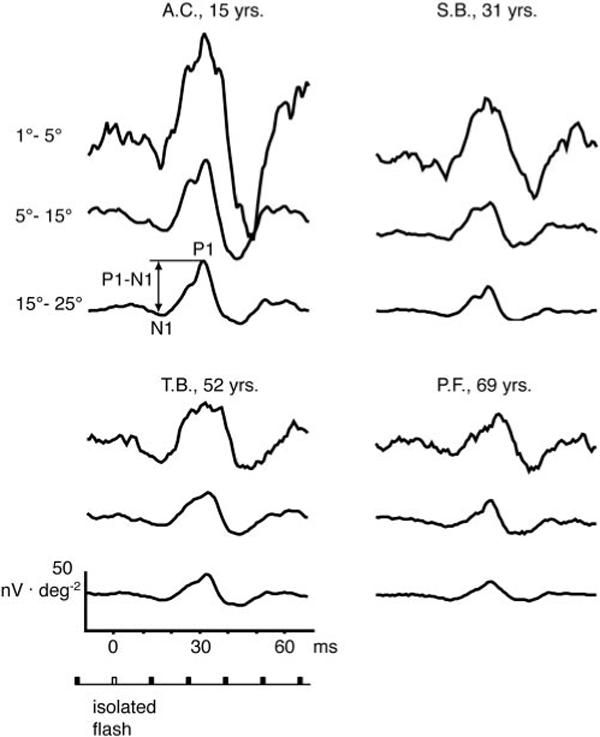
Synthesized isolated flash responses for the three retinal areas are shown for four typical observers ages 15, 31, 52, and 69 years. Measured parameters (implicit times N1 and P1 and response density P1 – N1) are demonstrated at top left. Bottom schematic illustrates flash sequence; unfilled bar: computed flash responses; filled symbols: nonflash responses.
Figure 6.
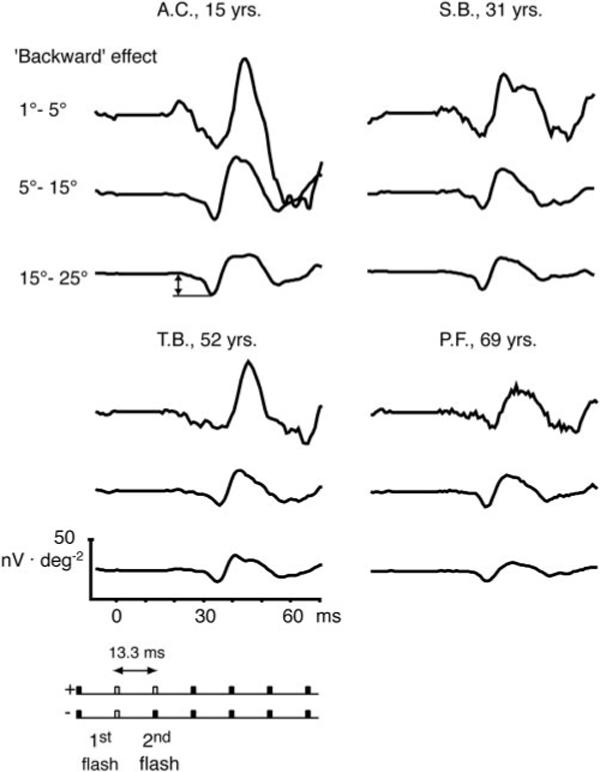
Synthesized isolated flash responses in the context of one preceding flash are shown for the three retinal areas from the same four observers shown in Figure 2. Because the response to the preceding (first) flash is subtracted, the analyzed flash response contains the effect from the second flash and the effect the second flash has on the first flash (backward effect). Double arrow: measured sharp negative response. The isolated flash response computation is demonstrated in the schematic below the traces: the bottom key (−) indicates the response subtracted from the originally computed double flash (top key; +). Unfilled bars: computed flash responses; filled bars: nonflash responses.
Figure 7.
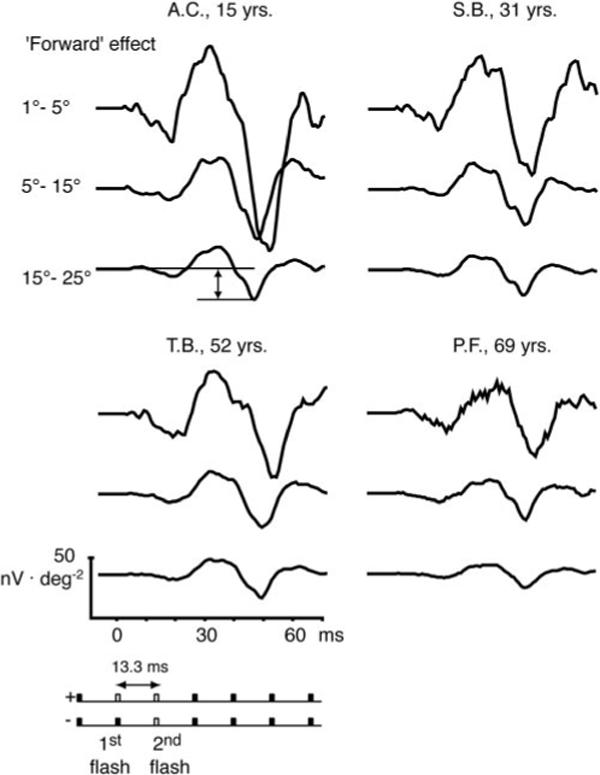
Synthesized single-flash responses in the context of one following flash are shown for the three retinal areas of the same observers shown in Figure 2. Because the response to the following flash response is subtracted, the analyzed flash response contains the effect from the first flash and the effect of the first flash on the second flash (forward effect). Double arrow: measured sharp negative response. The bottom key (−) indicates the response subtracted from the originally computed double flash (top key; +). Unfilled bars: computed flash responses; filled bars: nonflash responses.
Figure 9.
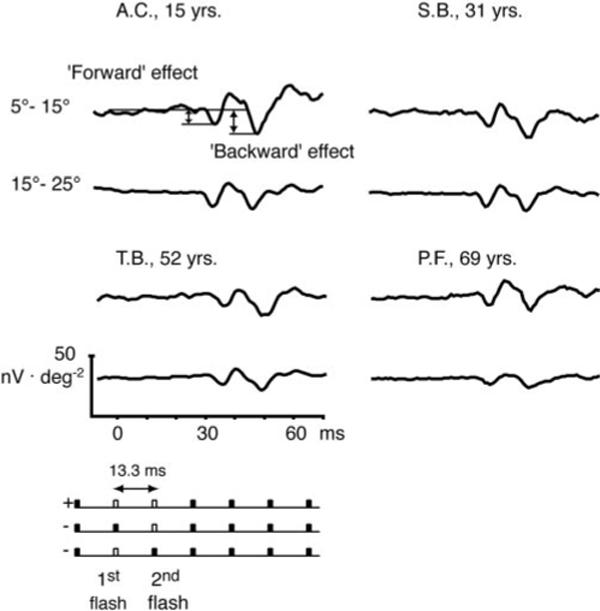
Synthesized double-flash experiment: each of the flash responses were subtracted separately for the same three retinal areas of the four observers presented in Figure 2. The remaining response depicts the backward effect from flash 2 on flash 1 and the forward effect from flash 1 on flash 2 (double arrows). Symbols are as in Figure 6.
Response density for the isolated flash response is plotted in Figure 3 as a function of age for the three different retinal areas. Regression analyses demonstrated that for each area the response density decreased significantly with age (Fig. 3, left). The rate of change with age did not differ significantly among the areas (0.04-log unit decrease in response density per decade of age). The relation between implicit times N1 and P1 and age is shown in Figure 3 right. Small but significant increases with age were found in area 2 for log implicit time N1 and for area 3 in log implicit time N1 and P1 (top, implicit time N1; bottom, implicit time P1).
Figure 3.
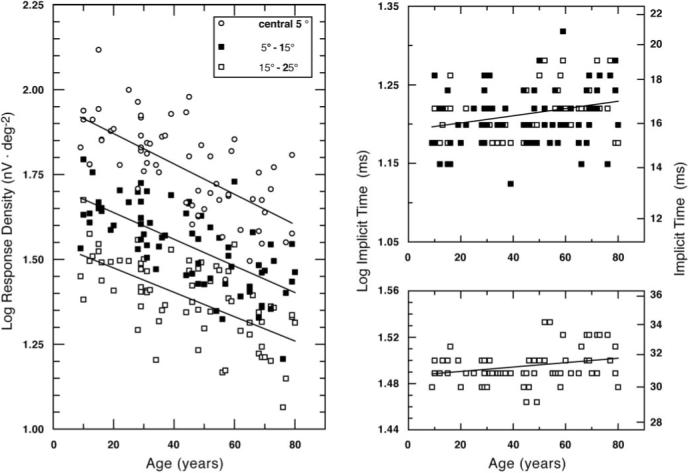
Log response density (nV · deg−2) is plotted as a function of age for the three retinal areas (left). Least-squares linear regression lines are shown for each data set. The regression equations are: log response density, y(central 5°) =−0.004 age + 1.959 (r =−0.66, P < 0.0001); y(5°−15°) =−0.004 age + 1.716 (r =−0.68, P < 0.0001); and y(15°−25°) =−0.004 age + 1.546 (r =−0.64, P < 0.0001). Right: log implicit time N1 (top) and P1 (bottom) plotted as a function of age. Data for areas with significant age-related change are shown (N1: areas 2 and 3, P1: area 3). The regression equations are: N1, y(5°−15°) = 0.00043 age + 1.19 (r = 0.24, P = 0.044); y(15°−25°) = 0.00046 age + 1.19 (r = 0.31, P = 0.008), and P1, y(15°−25°) = 0.000193 age + 1.48 (r = 0.27, P = 0.02).
Table 1 presents linear regression coefficients (r) of log response density and log implicit time versus age for the isolated flash response. An ANCOVA demonstrated that the slope relating log implicit time P1 to age for area 3 was significantly steeper than for area 2 (F1,70 = 7.79, P = 0.007).
Table 1.
Linear Regression Coefficients of Implicit Time and Response Density Versus Age
|
Isolated-Flash Response |
Fast Adaptive Effects |
||||
|---|---|---|---|---|---|
| Area | Implicit Time N1 | Implicit Time P1 | Response Density P1 - N1 | Backward Effect (One Preceding Flash) Response Density | Forward Effect (One Following Flash) Response Density |
| 1 | 0.17 | 0.15 | −0.66* | −0.31* | −0.51* |
| 2 | 0.24* | 0.08 | −0.68* | −0.53* | −0.66* |
| 3 | 0.31* | 0.28* | −0.64* | −0.68* | −0.55* |
Data are regression coefficients of log implicit time and log response density versus age for the isolated-flash response and the fast adaptive effects.
P < 0.05.
Relative Contributions of Optical and Neural Factors to the Isolated Flash Response
Ancillary data were obtained to evaluate the relative contributions of optical and neural factors to age-related changes in response density and implicit time. We previously calculated that there is a 0.12-log unit reduction in retinal illuminance from ages 25 to 75 years.3 Using the regression equations fitted to the data in Figure 3, the predicted change in area 3 between 25 and 75 years would be a reduction in response density of 0.2 log units and an increase in implicit time P1 of 0.0097 log units. Area 3 was chosen because significant age-related changes in implicit times N1 and P1 were found for the isolated flash response.
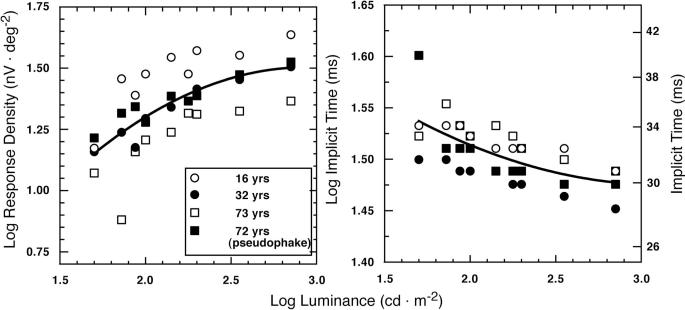
To evaluate the effect of a 0.12-log unit reduction in retinal illuminance we synthesized the isolated flash responses from four subjects tested for a series of luminance levels from 50 to 700 cd · m−2. The subjects covered the age range of the participants in the main experiment and included one observer with pseudophakic eyes. The results are shown in Figure 4 for retinal area 3. Lower stimulus luminance resulted in lower response density and longer implicit time. From the quadratic equations fitted to these data, the effect of a 0.12-log unit reduction in luminance was found to be a reduction in response density of 0.038 log units and an increase in implicit time P1 of 0.0064 log units.
Figure 4.
Log response density and log implicit time of the isolated flash response are plotted as a function of log stimulus luminance. Data points represent individual subject's responses synthesized for area 3 (15°−25°). The smooth curve in the left-hand panel represents the best-fitting polynomial to the mean data: y(response density P1 – N1) =−0.2272 + 1.335x2 − 0.462 (r = 0.99, P < 0.0001). The fitted curve in the right-hand panel is y(implicit time P1) = 0.03x2 − 0.188x + 1.77 (r = 0.99, P < 0.0001).
Fortune and Johnson4 estimated that, between ages 20 and 70, there is a 20% reduction in retinal image contrast due to increased intraocular scatter. To evaluate this effect, Figure 5 shows single-flash responses derived from data of three subjects tested with six different stimulus contrasts (48%−99%) that had the same mean luminance (200 cd · m−2). It can be seen that lower contrast results in lower response density and shorter implicit times for the isolated flash responses. The calculated effect of a 20% reduction in contrast due to age-related changes in light scatter is 0.096 log units for response density and 0.0038-log unit decrease in implicit time.
Figure 5.
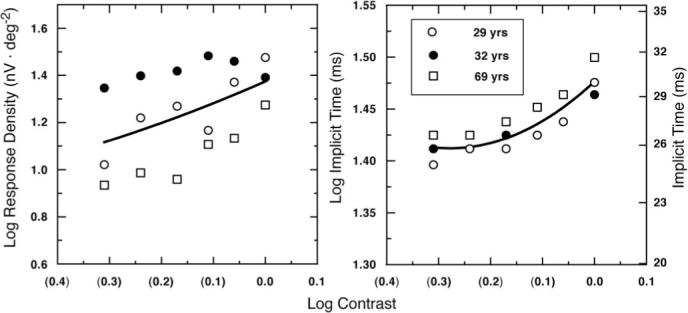
Log response density P1 – N1 and log implicit time P1 of the isolated flash response are plotted as a function of log stimulus contrast in the left and right panels, respectively. Data points represent the individual subject's responses synthesized for area 3 (15°−25°). The smooth curves represent best-fitting polynomials to the mean data: y(response density P1 – N1) = 0.612x2 − 1.426x + 1.779 (r = 0.98, P = 0.008), and y(implicit time P1) = 0.833x2 − 2.87x + 3.88 (r = 0.99, P = 0.003).
These analyses demonstrate that under our conditions of measurement, much, but not all, of the age-related changes in the isolated flash response can be accounted for by age-related reductions in retinal illuminance and stimulus contrast. Together, they predict a reduction in response density of 0.13 log unit over the age range at which there is an observed reduction of 0.2 log unit. Similarly, the combined effects of reduced retinal illuminance and decreased stimulus contrast cannot explain the observed age-related changes in implicit times. These factors together predict faster implicit times with age, not the slowing that was found. Neural factors thus explain a significant fraction of the age-related change in mfERG response.
Fast Adaptive Effects
To evaluate the impact of consecutive flash interactions on the mfERG responses, further analyses of various adaptive effects were conducted.
Effect on the Preceding Flash Response: Backward Effect
An attempt to cancel the response to the first flash in a synthesized double-flash response with the response to an isolated flash yielded the waveforms shown in Figure 6. These traces contain not only the contributions from the second flash response but also the effect the second flash has on the response to the first flash. If, in a double-flash experiment, the presentation of the second flash modifies the response to the first flash, then the subtraction of the isolated flash does not lead to cancellation of the response to the first flash, and a contribution from the first flash remains. We call this contribution the “backward” effect but we do not necessarily imply that the effect is due to a feedback circuit in the retina. Note also that this effect is not in violation of causality, because the second flash occurs long before the response to the first flash has fully developed and may thus interfere with its generation. It has been shown that the sharp negativity in the region of N1 (Fig. 6, top left, double arrow) represents the contribution from the preceding flash response, whose P1 is attenuated by the following flash (Sutter EE. IOVS 2002;43:ARVO E-Abstract 1797).
Figure 6 shows the difference between the isolated flash response and the single-flash response after one preceding flash (backward effect) for four typical observers. The schematic below the traces demonstrates the isolated flash response computation. The bottom key (−) indicates the response subtracted from the originally computed double flash (top key; +). Unfilled bars represent computed flash responses; filled bars indicate nonflash responses. In all three areas, there was a significant decrease in response density of this effect with age (Table 1). The slope relating response density to age did not differ among the areas.
Effect on the Following Flash Response: Forward Effect
The effects of a focal flash response on the response to a flash in the next base period (13.3 ms later) were estimated by subtraction of an isolated flash response from the second response of the double-flash configuration. Again, single- and double-flash responses were synthesized from the binary kernel series (Fig. 7). Because the second flash response of the double-flash synthesis was affected by the presence of the first flash, it was not canceled by the subtraction of the isolated flash response. The remaining response contribution from the second flash is illustrated for four typical observers in Figure 7 and is called the “forward” effect (top left, double arrow illustrates the measured response). Regression analyses summarized in Table 1 demonstrate that the magnitude of the forward effect decreased significantly with age in all three areas.
Do the backward (difference between the isolated flash response and the single-flash response after one preceding flash, Fig. 6) and the forward (difference between the isolated flash response and the single-flash response followed by one flash, Fig. 7) effects show a different rate of change with age? To investigate, we subtracted the magnitude (log response density) of the backward effect from that of the forward effect for each of the three areas. Figure 8 illustrates the data points for areas 2 and 3. In those two areas, a significantly larger age-related change in the magnitude of the backward compared with the forward effect was found (ANCOVA: area 2: F1,70 = 4.7, P = 0.03; area 3: F1,70 = 5.1, P = 0.03).
Figure 8.
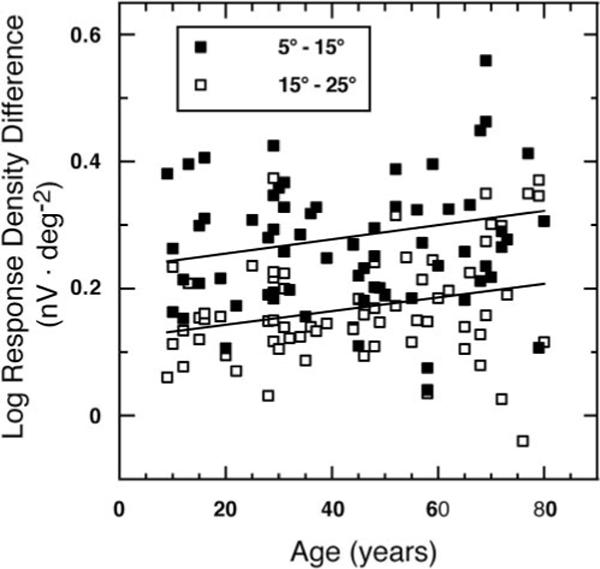
Log response density difference (nV · deg−2) (forward minus backward effect) is plotted as a function of age for areas 2 (5°−15°) and 3 (15°−25°) with the least-squares linear regression line. The regression equations reveal a significantly larger senescent change for the backward effect. Area 2: y(response density difference) = 0.0011 age + 0.23 (r = 0.25, P = 0.03); area 3: y(response density difference) = 0.0011 age + 0.122 (r = 0.27, P = 0.026).
To study how the rate of change with age in the implicit time of the isolated flash response is affected by preceding or following flashes, P1 implicit times from the isolated flash response were compared with P1 in the backward and the forward effect. An ANCOVA revealed a smaller age-related change in P1 implicit time when the isolated flash was followed by one flash (significant in areas 2 and 3) or when it was preceded by one flash (significant in area 2; Table 2).
Table 2.
Linear Regression Coefficients Comparing Age-Related Change in Synthesized Responses
| Isolated-Flash Response Compared with Backward Effect | Isolated-Flash Response Compared with Forward Effect | |
|---|---|---|
| Area 1 | 0.02 | 0.06 |
| Area 2 | −0.17 | −0.27* |
| Area 3 | −0.39* | −0.38* |
Data are results of analysis of age-related change in implicit time P1 for the isolated flash compared with the isolated flash in the context of one following flash (forward effect) or one preceding flash (backward effect) by ANCOVA.
P < 0.05.
Double Flash: Combined Backward and Forward Effects
The combined backward and forward effects in one double-flash experiment can be estimated by subtraction of the sum of the two corresponding single-flash responses from the double-flash response (Fig. 9). Subtracting the isolated flash response from both the first and the second flash in a double-flash experiment would cancel out both responses if the retinal response were linear. In the case of the highly nonlinear ERG it contains the combination from both backward and forward effects. The first negative peak represents the suppression of P1 of the first response by the second, whereas the second negativity results from the suppression of the same feature in the second response by the first. The two features are thus separated by precisely one base period of the pseudorandom stimulation (13.3 ms). Their amplitudes were measured as shown in Figure 9 (double arrows). Response densities from both forward and backward effects in the double-flash experiment show a significant decrease with age in areas 2 and 3, whereas the rate of change with age was not different between the two areas for both effects. Figure 9 illustrates this age-related reduction in response densities for four observers.
Discussion
Apart from phototransmission, adaptation to luminance and contrast are among the retina's most important functions. A comprehensive study of aging processes in the function of the retina must therefore include consideration of the retina's highly nonlinear response dynamics. As a nonlinear systems analysis technique, the multifocal ERG permits us to study these processes locally. However, the information on adaptation and recovery from photostress is presented in the form of a series of binary kernels that is not directly amenable to an intuitive interpretation.
Specifically, the first-order kernel is the mean response to all focal flashes that occur during stimulation minus the response sequence in the absence of a focal flash regardless of the context. It includes effects that a focal flash may have on responses to following as well as preceding flash responses. Similarly, the first slice of the second-order kernel represents the difference between the double-flash response and the two corresponding single-flash responses, again regardless of context. It thus follows that both first- and second-order kernels contain effects of a two-flash as well as multiflash interactions. A comparison of responses in the presence and absence of preceding and following flash responses would provide a much more direct and intuitive understanding of adaptive processes and their age-related changes. Although such response comparisons are not directly accessible from a multifocal data set, they can be synthesized from the series of binary kernels.14 In this study, we compared the synthesized response sequences that we believe to be most revealing and studied their changes with age in a large group of subjects.
The present isolated flash response analysis revealed an age-related decrease in response density P1 – N1 in all analyzed areas and an increase in implicit time N1 in areas 2 and 3 and in implicit time P1 in area 3. Previous aging studies of mfERG responses have reported various results.1-6 In our previous study the first-order kernel analysis revealed an age-related linear decline in log response density and an increase in log implicit time of P1 in all six concentric rings (71 subjects, ages 9 to 80 years). Jackson et al.,5 in 46 subjects, age-groups 19 to 30 years and 60 to 74 years, detected an age-related reduction in amplitude density in the central 36°. Fortune and Johnson4 found among 32 subjects ages 16 to 69 years an age-related response density decrease and implicit time increase that they concluded has predominately optical origins. Nabeshima et al.6 found in their study of 52 subjects aged 12 to 76 years a linear decline in response density from the 50-year-old age group in all rings, whereas implicit time P1 did not show a change with age. Mohidin et al.2 did not find an age-related response density change within the central 5° (90 subjects, ages 18 − 52 years). These variations may be due to the small sample sizes and different age ranges used in some studies, or they may be due to insufficient screening for retinal abnormalities and/or testing under different conditions (not in room light, with undilated pupils). The analysis of the first-order kernel of the data set used herein3 demonstrated significant age-related decreases in response density P1 – N1 and increase in implicit time P1 in all six analyzed concentric rings. In addition, we repeated the first-order kernel analysis for the three areas analyzed in this article (see the Methods section). Again, response density P1 – N1 and implicit times N1 and P1 showed significant age-related changes in all three areas. Thus, the isolated flash response revealed a smaller aging effect for implicit times. This may be attributed to the absence of flash-flash interactions in the isolated flash response.
Studies on aging of photopic full-field ERG responses have shown a linear change in amplitude and/or latency.17-19 Birch and Anderson19 reported a decline of 7.9%/decade and 8.4%/decade in the single-flash cone response and in the 30-Hz flicker response, respectively. In the present study we found a 1.3%, 2.3%, and 3.4% decline per decade in the isolated flash response density in areas 1, 2, and 3, respectively. Hood et al.20 demonstrated, that multifocal and the full-field ERG responses can be compared only under certain testing conditions. The higher change with age in the full-field ERG compared with that in the isolated flash response may originate from the different retinal areas stimulated, flash and background intensity, flash or frame frequency, or state of light adaptation.
An important question is whether age-related changes in the isolated flash response are due to neural and/or optical factors, such as age-related decreases in ocular media transmission attributable to an increase in lenticular density and an increase in intraocular scatter. This question has been addressed previously only for the first-order kernel.3-5 We showed in this study that the change in the isolated flash response due to those optical factors did not explain entirely both the age-related decrease in the synthesized isolated flash response density P1 – N1 and the increase in implicit time P1. Thus, both optical and neural factors are needed to account for the age-related changes in the isolated flash response.
The comparison of the isolated flash responses and fast adaptive effects revealed that for the unadapted state (isolated flash response) latency P1 changed more with age than in the adapted state (in the context of preceding and following flashes). Psychophysical data by Schefrin et al.21 indicate that much of the sensitivity loss in elderly subjects is due to age-related changes that are mathematically equivalent to a reduction in photon capture. Adjustment in cone sensitivity, or gain control may be responsible for this smaller aging effect for the adapted state.22 Retinal gain controls could partially compensate for the aging effect in the isolated flash response.
Psychophysically measured IRFs using a double-pulse method revealed a significant decline in amplitude and nearly constant latency with age except in a small subset of elderly observers.23 The psychophysically derived IRF may be compared with the isolated flash response derived from mfERGs if the latter is accepted as a linear approximation of the retinal response. For this reason, the isolated flash extracted from the binary kernels was derived from the same area, 5° to 10° in radius, that was tested in the psychophysical experiment.23 The results of this analysis are consistent with the aging effects measured in the psychophysically derived IRF. They showed a significant age-related decrease in log response density (P < 0.0001), a small but significant increase in log implicit time N1 (P = 0.048), and nearly constant log implicit time of P1 (P = 0.08).
Are the age-related changes in short-term adaptive effects related to the responses of one retinal cell type? Physiological studies have shown that amacrine cells exhibit a nonlinear response to temporally and spatially modulated inputs (reviewed in Ref. 24). Most amacrine cells are inhibitory in their connection to bipolar cells, ganglion cells, and other amacrine cells and form a complex network with several levels of inhibition under different control mechanisms (also reviewed in Ref. 25). Hood et al.26 described retinal responses in rhesus monkeys after suppressing inner retinal activity with different pharmacological agents. The shelf in the waveform of the first-order kernel after the first prominent peak P1 (Fig. 8 in Ref. 26) was removed after applying N-methyl-d-aspartate (NMDA), a glutamate agonist that is expected to suppress inner retinal activity. This shelf may be a higher-order kernel contribution, or in other words, a result of adaptive effects.14,15 However, not all amacrine cells have NMDA receptors. In addition, the amacrine cell output should not be directly affected by NMDA. Most of these cells are GABAergic or glycerinergic or even use other neurotransmitters.25 Therefore, the contribution removed from the first-order kernel26 may derive at least partly from amacrine cells.
Does the outer retina (e.g., the receptor-horizontal-bipolar cell network) contribute to the adaptive effect? Horizontal cells behave linearly in their interactions with photoreceptors and bipolar cells.27 The highly nonlinear amacrine cells are therefore more likely to contribute the adaptive effects seen in the higher-order kernels.
Acknowledgments
The authors thank Martin Wilson for helpful discussions.
Supported by National Institute on Aging Grant AG04058, National Eye Institute Grants EY12576 and EY06861, a Jules and Doris Stein Professorship from Research to Prevent Blindness, and the Smith-Kettlewell Eye Research Foundation.
Footnotes
Disclosure: C. Gerth, None; E.E. Sutter (P); J.S. Werner, None
References
- 1.Nagatamo A, Nao-i N, Maruiwa F, Arai M, Sawada A. Multifocal electroretinograms in normal subjects. Jpn J Ophthalmol. 1998;42:129–135. doi: 10.1016/s0021-5155(97)00118-4. [DOI] [PubMed] [Google Scholar]
- 2.Mohidin N, Yap MKH, Jacobs RJ. Influence of age on the multifocal electroretinography. Ophthalmic Physiol Opt. 1999;19:481–488. doi: 10.1046/j.1475-1313.1999.00468.x. [DOI] [PubMed] [Google Scholar]
- 3.Gerth C, Garcia SM, Ma M, Keltner JL, Werner JS. Multifocal electroretinogram: age-related changes for different luminance levels. Graefes Arch Clin Exp Ophthalmol. 2002;240:202–208. doi: 10.1007/s00417-002-0442-6. [DOI] [PMC free article] [PubMed] [Google Scholar]
- 4.Fortune B, Johnson CA. The decline of photopic multifocal electroretinogram responses with age is primarily due to pre-retinal optical factors. J Opt Soc Am A. 2002;19:173–184. doi: 10.1364/josaa.19.000173. [DOI] [PubMed] [Google Scholar]
- 5.Jackson RG, Ortega JDL, Girkin C, Rosenstiel CE, Owsley C. Aging-related changes in the multifocal electroretinogram. J Opt Soc Am A. 2002;19:185–189. doi: 10.1364/josaa.19.000185. [DOI] [PubMed] [Google Scholar]
- 6.Nabeshima T, Tazawa Y, Mita M, Sano M. Effect of aging on the first and second-order kernels of multifocal electroretinogram. Jpn J Ophthalmol. 2002;46:261–269. doi: 10.1016/s0021-5155(02)00475-6. [DOI] [PubMed] [Google Scholar]
- 7.Sutter EE. The fast m-transform: a fast computation of cross-correlations with binary m-sequences. Soc Ind Appl Math. 1991;20:686–694. [Google Scholar]
- 8.Sutter EE, Tran D. The field topography of ERG components in man. 1. The photopic luminance response. Vision Res. 1992;32:433–446. doi: 10.1016/0042-6989(92)90235-b. [DOI] [PubMed] [Google Scholar]
- 9.Schnapf JL, Nunn BJ, Meister M, Baylor DA. Visual transduction in cones of the monkey Macaca fascicularis. J Physiol. 1990;427:681–713. doi: 10.1113/jphysiol.1990.sp018193. [DOI] [PMC free article] [PubMed] [Google Scholar]
- 10.Kaplan E, Bernadete E. The dynamics of primate retinal ganglion cells. Prog Brain Res. 2001;134:17–34. doi: 10.1016/s0079-6123(01)34003-7. [DOI] [PubMed] [Google Scholar]
- 11.Ikeda M. Temporal summation of positive and negative flashes in the visual system. J Opt Soc Am. 1965;55:1527–1534. [Google Scholar]
- 12.Tyler CW. Two processes control variations in flicker sensitivity over the life span. J Opt Soc Am A. 1989;6:481–490. doi: 10.1364/josaa.6.000481. [DOI] [PubMed] [Google Scholar]
- 13.Kim CBY, Mayer MI. Flicker sensitivity in healthy eyes. II. Cross-sectional aging trends from 18 to 77 years of age. J Opt Soc Am A. 1994;11:1958–1969. doi: 10.1364/josaa.11.001958. [DOI] [PubMed] [Google Scholar]
- 14.Sutter EE. The interpretation of multifocal binary kernels. Doc Ophthalmol. 2000;100:49–75. doi: 10.1023/a:1002702917233. [DOI] [PubMed] [Google Scholar]
- 15.Sutter EE. Imaging visual function with the multifocal m-sequence technique. Vision Res. 2001;41:1241–1255. doi: 10.1016/s0042-6989(01)00078-5. [DOI] [PubMed] [Google Scholar]
- 16.Judd CM, McClelland GH, Smith ER. Testing treatment by covariate interactions when treatment varies within subjects. Psychol Methods. 1996;1:366–378. [Google Scholar]
- 17.Weleber RG. The effect of age on human cone and rod Ganzfeld electroretinograms. Invest Ophthalmol Vis Sci. 1981;20:392–399. [PubMed] [Google Scholar]
- 18.Wright CE, Williams DE, Drasdo N, Harding GFA. The influence of age on the electroretinogram and visual evoked potential. Doc Ophthalmol. 1985;59:365–384. doi: 10.1007/BF00159171. [DOI] [PubMed] [Google Scholar]
- 19.Birch DG, Anderson JL. Standardized full-field electroretinography: normal values and their variation with age. Arch Ophthalmol. 1992;110:1571–1576. doi: 10.1001/archopht.1992.01080230071024. [DOI] [PubMed] [Google Scholar]
- 20.Hood DC, Seiple W, Holopigian K, Greenstein V. A comparison of the components of the multifocal and full-field ERGs. Vis Neurosci. 1997;14:533–544. doi: 10.1017/s0952523800012190. [DOI] [PubMed] [Google Scholar]
- 21.Schefrin BE, Werner JS, Plach M, Utlaut N, Switkes E. Sites of age-related sensitivity loss in a short-wave cone pathway. J Opt Soc Am A. 1992;9:355–363. doi: 10.1364/josaa.9.000355. [DOI] [PubMed] [Google Scholar]
- 22.Werner JS. Visual problems of the retina during ageing: Compensation mechanisms and colour constancy across the life span. Prog Retinal Eye Res. 1996;15:621–645. [Google Scholar]
- 23.Shinomori K, Werner JS. Senescence of the temporal impulse response to a luminance pulse. Vision Res. 2003;43:617–627. doi: 10.1016/S0042-6989(03)00009-9. [DOI] [PMC free article] [PubMed] [Google Scholar]
- 24.Chan RY, Naka KI. The amacrine cell. Vision Res. 1976;16:1119–1129. doi: 10.1016/0042-6989(76)90252-2. [DOI] [PubMed] [Google Scholar]
- 25.Wilson M. Retinal synapses. In: Chalupa LM, Werner JS, editors. The Visual Neurosciences. The MIT Press; Cambridge, MA: in press. [Google Scholar]
- 26.Hood DC, Frishman LJ, Saszik S, Viswanathan S. Retinal origins of the primate multifocal ERG: implications for the human response. Invest Ophthalmol Vis Sci. 2002;43:1673–1685. [PubMed] [Google Scholar]
- 27.Naka KI. The cells horizontal cells talk to. Vision Res. 1982;22:653–660. doi: 10.1016/0042-6989(82)90101-8. [DOI] [PubMed] [Google Scholar]


