

Abstract
Radiation-induced genomic instability (RIGI) manifests as a heritable increased rate of genetic alterations in the progeny of irradiated cells generations after the initial insult. The progeny can show an increased frequency of chromosomal translocations, deletions, mutations, micronuclei, and decreased plating efficiency. What perpetuates RIGI is unclear; however, persistently increased levels of reactive oxygen species (ROS) are frequently associated with genomically unstable clones. Furthermore, addition of free radical scavengers (e.g., DMSO, glycerol, and cationic thiol cysteamine) reduces the incidence of instability after irradiation, implicating a ROS-mediated role in RIGI induction. Because mitochondria are a major natural cellular source of ROS, we tested the hypothesis that mitochondrial dysfunction has a role in maintaining the elevated ROS levels in our irradiated, genetically unstable GM10115 Chinese hamster ovary cells. Amplex Red fluorometry measurements indicate that the relative contribution of uncoupler-sensitive mitochondrial hydrogen peroxide production to total cellular hydrogen peroxide generation is greater in unstable cells. Measurements of mitochondrial DNA levels and cell cytometric fluorescent measurements of Mitotracker Green FM indicate that differences in mitochondrial ROS production are not due to varying mitochondrial levels. However, mitochondrial respiration measured in digitonin-permeabilized cells is impaired in unstable clones. In addition, manganese superoxide dismutase, a major mitochondrial antioxidant enzyme, exhibits increased immunoreactivity but decreased enzyme activity in unstable clones, which along with decreased respiration rates may explain the increased levels of cellular ROS. These studies show that mitochondria from unstable cells are abnormal and likely contribute to the persistent oxidative stress in the unstable clones.
Introduction
Accumulating evidence suggests that radiation-induced genomic instability (RIGI) is a nontargeted phenomenon triggered by radiation that may initiate and likely contribute to radiation carcinogenesis (1). RIGI is defined as an increased heritable frequency of nuclear genetic alterations in the progeny of the irradiated cell long after the initial radiation exposure. In RIGI, the progeny of irradiated cells display changes, such as aneuploidy, micronucleus formation, sister chromatid exchanges, gene mutations, amplifications, reduced plating efficiency, and chromosomal destabilization (2). Genomic instability is believed to play a role in promoting tumorigenesis through genome destabilization resulting in the high frequencies of genomic changes seen in most cancers (3).
The frequency of RIGI initiation exceeds the frequency of nuclear gene mutation at the same radiation dose; thus, a single gene mutation cannot be the initiating event (4). DNA damage caused by direct radiation cannot explain the persistence of these delayed phenotypes in the progeny of irradiated cells that themselves saw no radiation (5). There is growing evidence that oxidative stress has a role in instability initiation and perpetuation (6). High levels of free radicals as well as products of oxidative stress, including oxidative base damage, have been described in radiation-induced chromosomally unstable cell lines by different investigators. In fact, in unstable cells derived from our GM10115 system, Limoli et al. found increased levels of lipid peroxidation products (7–9). Chronic hydrogen peroxide (H2O2) or glucose oxidase administration induces instability (10, 11). Likewise, free radical scavenger treatment and hypoxic conditions reduce the incidence of delayed genetic instability after irradiation (12, 13), implicating a role for reactive oxygen species (ROS) in RIGI induction. In our unstable cell lines, we find increased levels of ROS many generations after the radiation insult (9). Ionizing radiation transiently increases cellular ROS levels through water hydrolysis, but these radicals are extremely short lived (e.g., the hydroxyl radical has a lifetime of ∼10−9 seconds; ref. 14). Thus, ROS must be continuously produced as we find persistently increased levels in the unstable clones for prolonged periods after the initial radiation insult (8, 9).
Several cellular sources can generate ROS: peroxisomes, plasma membrane proteins, such as NADPH oxidase, cytosolic enzymatic reactions, and mitochondria. Mitochondria contribute to ∼90% of total cellular ROS levels (15) where normally 1% to 5% of the oxygen it consumes is converted into superoxide anions and other ROS (16). Damaged mitochondria can produce even more free radicals from an impaired electron transport chain (17), increasing the potential for chromosomal abnormalities (18). Some of the consequences of dysfunctional respiration are highlighted in a study that observed a point mutation in the mitochondrial DNA (mtDNA) gene MTATP6 causing deficient mitochondrial respiratory activity and promotion of carcinogenesis through inhibition of apoptosis (19).
Preliminary studies examining mitochondria from radiation-induced genetically unstable cells showed abnormal membrane potential, the driving force for ATP synthesis (8). We examined mitochondrial function in genetically unstable clones to test the hypothesis that dysfunctional mitochondria contribute to the persistently increased ROS levels. Our findings support this hypothesis and provide further evidence for a role for mitochondrial dysfunction in RIGI.
Materials and Methods
Cell culture
Chinese hamster ovary (CHO) cells, GM10115 (Human Genetic Mutant Cell Repository, Camden, NJ), which contain one copy of human chromosome 4 in a background of 20 to 24 CHO chromosomes, were cultured in DMEM supplemented with 10% fetal bovine serum, 100 units penicillin, 100 μg/mL streptomycin, 2 mmol/L glutamine, and 0.2 mmol/L l-proline. Cultures were maintained in 5% CO2 in air at 34°C.
Stable and unstable colonies were isolated from irradiated parental GM10115 cells by isolating and clonally expanding a surviving irradiated cell (20–22). Unstable clones were identified through cytogenic analysis of metaphase chromosomes using fluorescence in situ hybridization for human chromosome 4. At a dose of 1 Gy, ∼3% of clones analyzed are genetically unstable (5). An unstable clone contains at least three metaphase subpopulations with unique rearrangements of the human chromosome. These rearranged subpopulations consist of ≥5% of the 200 metaphases scored. Two unstable clones, LS12 and Fe10-3, isolated from GM10115 cells irradiated with 10 Gy of X-rays or iron ions, respectively, were used in this investigation. LS12 and Fe10-3 showed 13 and 18 unique rearrangements of chromosome 4, respectively (23). Unstable clones are monitored regularly for instability through metaphase analysis (21).
ROS levels
ROS levels were measured using the ROS-specific probe, 5′6′-chloromethyl-2′7′-dichlorodihydrofluorescein diacetate (CM-H2DCFDA; Molecular Probes, Carlsbad, CA). DCFDA diffuses into cells and becomes trapped inside the cell after being cleaved by intracellular esterases. Within the cell, the probe reacts with ROS and becomes highly fluorescent with excitation and emission at 490 and 530 nm, respectively. Cells at a concentration of 1 × 10⁶ per mL in PBS were loaded with freshly prepared 5 μmol/L CM-H2DCFDA in DMSO for 30 minutes, spun down, and rinsed once with PBS. Dead cells were excluded from analysis using 5 mmol/L propidium iodide, which is unable to stain live cells with intact membranes. Fluorescence intensity representing ROS levels of live cells was measured using flow cytometry using a Becton Dickinson FACScan flow cytometer (Franklin Lakes, NJ).
H2O2 production
The generation of H2O2 was measured using 1 mmol/L Amplex Red (Molecular Probes) in DMSO in the presence of 40 units/mL superoxide dismutase (SOD) and 10 units/mL horseradish peroxidase (HRP; Sigma, St. Louis, MO). Amplex Red reacts with H2O2 producing a fluorescent signal, measured at excitation and emission wavelengths of 563 and 587 nm, respectively, using a fluorescence spectrophotometer with a temperature-regulated chamber equipped with constant stirring. H2O2 is generated by the reaction between mitochondrial-produced superoxide radical and SOD. SOD was also used to prevent auto-oxidation of Amplex Red that could interfere with H2O2 measurements. The Amplex Red signal was calibrated by sequential additions of fresh H2O2. The mitochondrial respiratory uncoupler, p-trifluoromethoxy carbonyl cyanide phenyl hydrazone (FCCP; Sigma), was used to probe for the mitochondrial contribution to cellular H2O2 production (24). The rate of uninhibited ROS production of intact cells (5 × 10⁶ cells/mL) in NaCl buffer (140 mmol/L NaCl, 3 mmol/L KCl, 0.4 mmol/L KH2PO4, 20 mmol/L HEPES, 5 mmol/L NaHCO3, 5 mmol/L glucose, 1 mmol/L MgCl2) was measured at 34°C with constant stirring. FCCP (10 μmol/L) was then added causing a reduction in the rate of H2O2 generation. The difference in the rate of H2O2 ± FCCP is defined as the minimum H2O2 contribution of mitochondria to total cellular H2O2 production.
Mitochondrial mass
The fluorescent probe Mitotracker Green FM (Molecular Probes) binds to mitochondrial membrane lipids regardless of mitochondrial membrane potential or oxidant status (25). Although nonyl acridine orange has been used to determine mitochondrial mass (26), binding may be influenced by altered mitochondrial respiratory states (27). To determine levels of mitochondria within each clone (28), a suspension of 1 × 10⁶ cells/mL in PBS was loaded with 250 nmol/L Mitotracker Green FM in DMSO for 30 minutes at 34°C. Flow cytometric fluorescence measurements were made with excitation at 490 nm and emission at 516 nm using a Becton Dickinson FACScan flow cytometer. Amounts were determined by comparing the means of the fluorescent signal.
mtDNA quantification
Total cellular DNA was isolated using GenElute Mammalian genomic DNA kit (Sigma). Total cellular DNA (20 μg) was digested with 5 units/μg Kpn1, which linearizes all mtDNA because CHO mtDNA has a single Kpn1 restriction site (29). Fragments were run on a 0.7% agarose gel and then transferred and fixed to a positively charged nylon membrane. The membrane was hybridized with [32P]dATP-labeled cytochrome c oxidase subunit 2 and subunit 3 [cyclooxygenase (COX) 2 and COX3] genes to detect levels of mtDNA. mtDNA levels were normalized to β-actin DNA. Membranes were washed for 2 hours with 2× SSC, 0.1% SDS buffer, 2 hours with 0.1× SSC, 1% SDS buffer, and then 2 hours with 0.1× SSC buffer at 65°C. Membranes were analyzed using phosphoimaging (Bio-Rad Personal Molecular Imaging FX, Hercules, CA) and band intensity was quantified using Quantity One software (Bio-Rad).
Digitonin-permeabilized respiration
Mitochondrial oxygen consumption within cells was measured using a Clark-type oxygen electrode in a thermostatically controlled chamber. Cells were trypsinized, rinsed with PBS, and resuspended in 100 μL of a sodium chloride buffer (140 mmol/L NaCl, 3 mmol/L KCl, 0.4 mmol/L KH2PO4, 20 mmol/L HEPES, 5 mmol/L NaHCO3, 5 mmol/L glucose, 1 mmol/L MgCl2) and then brought to a final concentration of 2 × 10⁷ cells/mL in a potassium buffer [125 mmol/L KCl, 2 mmol/L KH2PO4, 10 mmol/L HEPES, 1 mmol/L MgCl2, (pH 7.0)] in the electrode chamber. The plasma membrane of cells was selectively permeabilized using 0.03% digitonin (Sigma) in DMSO. Respiration was measured using the oxidizable substrates, 5 mmol/L malate and 5 mmol/L glutamate. State 3 respiration (active oxidative phosphorylation) was measured after the addition of 1.6 mmol/L ADP. State 4 respiration (resting respiration limited by the inner membrane proton permeability) was measured after the addition of the ATP synthase poison oligomycin at 5 μg/mL (Sigma; ref. 30). Rates for both state 3 and 4 respiration were recorded in units of nanomolar O2/min/107 cells. In two experiments, respiration by intact, nonpermeabilized cells was measured in sodium chloride buffer plus glucose (see above) but in the absence of other oxidizable substrates and ADP. Under these conditions, endogenous respiration was measured before and after the addition of oligomycin.
Cytochrome c oxidase activity assay
Cytochrome c oxidase enzyme activity was monitored by the oxidation of reduced cytochrome c at 550 nm (31). Cells were trypsinized, rinsed twice with PBS, and resuspended in 10 mmol/L phosphate (KH2PO4/K2HPO4) buffer (pH 7.4) containing 20 mmol/L succinate. Cells were then lysed using 0.5% Triton X-100. Cytochrome c (Sigma) was dissolved in 10 mmol/L phosphate buffer in the presence of 0.1 mol/L l-ascorbate as a reductant, which was later removed using a Sephadex G-25 column. Reduced cytochrome c (20 μmol/L) was added to lysates containing 30 μg protein in 1 mL of 20 mmol/L phosphate buffer, and decreases in absorbance, which indicate cytochrome c oxidation, were recorded for 2 minutes. Activity was determined by assessing the rate and extent of enzymatic cytochrome c oxidation and calculated in units of nanomolar cytochrome c oxidized/min/mg protein with an extinction coefficient of 19 per mmol/L/cm (32).
Western blotting for manganese SOD
Exponentially growing cells were washed twice with cold PBS and protein was isolated from cells scraped off 75-cm2 flasks. Cells were then lysed with buffer containing 500 mmol/L NaCl, 50 mmol/L Tris (pH 8.0), 1% NP40, and protease inhibitors (Calbiochem, San Diego, CA) and complete cell lysis was ensured by sonication. Lysates were centrifuged at 14, 000 rpm at 4°C and protein concentration of the collected supernatants was determined through a Bradford protein assay (Bio-Rad). Proteins (30 μg) were electrophoresed on 4% to 12% Bis-Tris polyacrylamide gels (Invitrogen, Carlsbad, CA) in MES buffer and transferred by electrophoresis to polyvinylidene fluoride membranes (Invitrogen). Proteins on the membrane were incubated with a rabbit polyclonal anti-manganese SOD (MnSOD) primary antibody (Upstate, Charlottesville, VA). A secondary anti-rabbit antibody and chemiluminescent substrate solution (KPL, Inc., Gaithersburg, MD) was used to visualize these bands and Quantity One software was used to quantify protein band intensities in digital images of the blot. As a loading control, blots were also incubated with mouse anti-glyceraldehyde-3-phosphate dehydrogenase antibodies (StressGen, Victoria, British Columbia, Canada).
MnSOD activity
MnSOD activity was measured using a spectrophotometric assay (R&D Systems, Minneapolis, MN). Cell extracts were prepared from exponentially growing cultures. Activity was determined as per the manufacturer's instructions using a colorimetric assay based on the ability of SOD to form H2O2 from superoxide radicals generated by an exogenous reaction involving xanthine and xanthine oxidase. The extent of prevention of a colorimetric reaction involving superoxide and a superoxide scavenging molecule, nitroblue tetrazolium, indicated the activity of MnSOD. Activity was measured using 50 μg protein lysate per cell clone in the presence of 5 mmol/L sodium cyanide (NaCN; Sigma) to inhibit copper/zinc SOD (CuZnSOD) activity, leaving MnSOD activity unchanged. Mitochondrial and microsomal fractions produce free radicals that reduce the sensitivity of the assay especially on addition of NaCN. Bathocuproine sulfate (BCS; 0.05 mmol/L) and fatty acid-free bovine serum albumin (BSA; 0.13 mg/mL; Sigma) were added to the reaction to prevent mitochondrial electron transport oxidant production that interfered with measurements. BCS is an iron chelator that blocks the electron transport chain effectively without interfering with this assay and the BSA increases BCS solubility (33). Absorbance changes were recorded for 5 minutes and rates were calculated for three independent sets of lysates for each of the clones.
Statistical analysis
Data are expressed as the mean of three independently replicated experiments ± SE unless otherwise indicated. Statistical significance was taken as P < 0.05 and determined by one-way ANOVA followed by the Dunnett's test.
Results
Chromosomal instability
Instability is characterized by chromosomal rearrangements visualized through metaphase analysis of chromosomes with the hamster chromosome by fluorescence in situ hybridization (21, 22). The two unstable clones used in this study, LS12 and Fe10-3, were derived from irradiated surviving GM10115 cells using ionizing radiation. These unstable clones contain several numbers of different subpopulations of rearranged metaphase chromosomes and were used for subsequent studies with the unirradiated GM10115 cell line.
Total ROS levels and mitochondrial contribution to H2O2 production in stable and unstable clones
Evidence of oxidative stress, including increased ROS levels and lipid peroxidation, was previously found in unstable clones generated from irradiated clonal expansions of GM10115 cells (8, 9, 12). To confirm persistent oxidative stress in our unstable clones, cells were incubated with the free radical indicator probe, DCFDA. Measuring fluorescence emission with flow cytometry, unstable cells showed higher levels of ROS than the stable parental cell line. Figure 1A shows that LS12 and Fe10-3 cells present a 36% and 70% increase in ROS levels, respectively, over the parental GM0115 cell line (P = 0.004).
Figure 1.
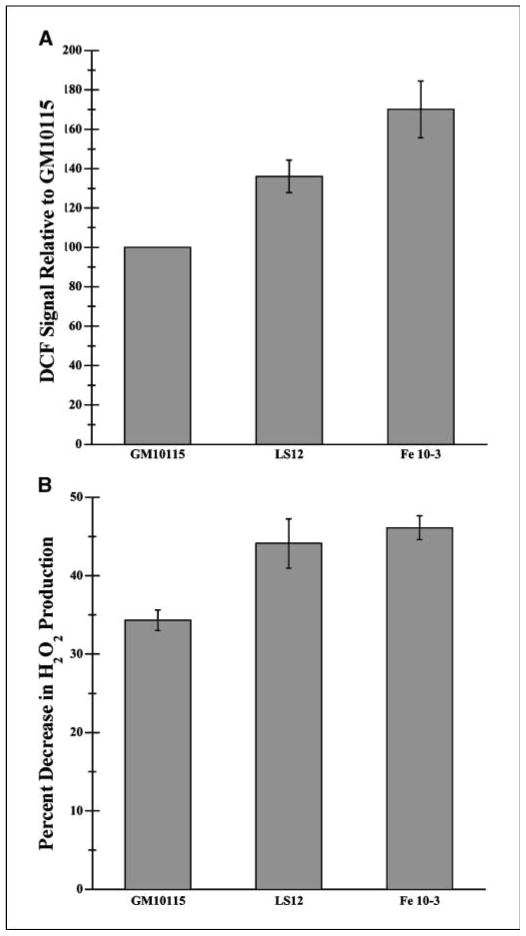
ROS present in genetically stable and unstable cells. A, 1 × 10⁶ cells/mL in PBS were incubated with 5 μmol/L DCFDA in DMSO for 30 minutes at 34°C. Fluorescence was analyzed using flow cytometry measuring fluorescence emission at 530 nm with excitation at 490 nm. Propidium iodide staining was used to eliminate dead cells from the analysis. Values represent percentage increase in DCF fluorescence compared with that of stable GM10115 cells. (n = 3; P < 0.001). B, 1 × 10⁷ cells were resuspended in 2 mL sodium buffer (140 mmol/L NaCl, 3 mmol/L KCl, 0.4 mmol/L KH2PO4, 20 mmol/L HEPES, 5 mmol/L NaHCO3, 5 mmol/L glucose, 1 mmol/L MgCl2). Rates of total cellular H2O2 production were measured using the Amplex red dye with 5 units/mL HRP and 40 units/mL SOD. Fluorescence measurements were made at 37°C over 5 minutes at 563 nm excitation and 585 nm emission. After a stable baseline rate was recorded, the respiratory uncoupler FCCP (10 μmol/L) was added to minimize the mitochondrial contribution to cellular H2O2 production. Values represent the percentage reduction in the rate of fluorescence on addition of FCCP (n = 5; P = 0.003).
To determine relative mitochondrial contribution to the increased ROS levels in the unstable cells (i.e., the differences between the clones in mitochondrial production of electron transport–generated ROS to the total cellular ROS levels), a fluorometric Amplex Red assay was used to detect real-time rates of cellular H2O2 production. The mitochondrial contribution to the total cellular H2O2 production was defined as the difference in the rate of Amplex Red fluorescence in the absence and presence of the protonophoric uncoupler molecule, FCCP. FCCP reduces H2O2 production by isolated mitochondria by up to 70% (24). Although this calculation somewhat underestimates the mitochondrial contribution, unstable cells showed a greater percentage decrease in ROS after addition of FCCP than GM10115 cells. LS12 and Fe10-3 ROS levels decreased by about 43% and 46%, respectively, and the parental cell line decreased by 34% (P = 0.003; Fig. 1B). The degree to which FCCP reduces mitochondrial ROS production is dependent on the level of metabolism relative to state 3 respiration (low rate of ROS production) versus state 4 respiration (high rate). To determine the relative rates of endogenous mitochondrial metabolism in the cell lines, O2 electrode measurements of respiration by intact cells in the absence and presence of the ATP synthetase inhibitor oligomycin were made. The ratio of rates obtained in the absence compared with the presence of oligomycin ranged from 2.0 to 2.3 (n = 2) and was the same for each cell type, indicating that the differences in FCCP-sensitive H2O2 production are not due to differences in cellular metabolism. Thus, the mitochondrial contribution to cellular H2O2 generation is greater in the unstable cells, likely due to some inherent alteration in the number of mitochondria or specific electron transport activities.
Mitochondria levels
Because increased numbers of mitochondria may be the source of the increased ROS levels in the unstable cells, we examined mitochondrial amounts in each of the clones. Because the Mitotracker Green FM probe stains mitochondria in a membrane potential-independent manner, it is a reliable indicator of mitochondrial levels (25). Flow cytometry measurements indicate that mitochondrial levels are not significantly different among the three cell lines (Fig. 2A).
Figure 2.
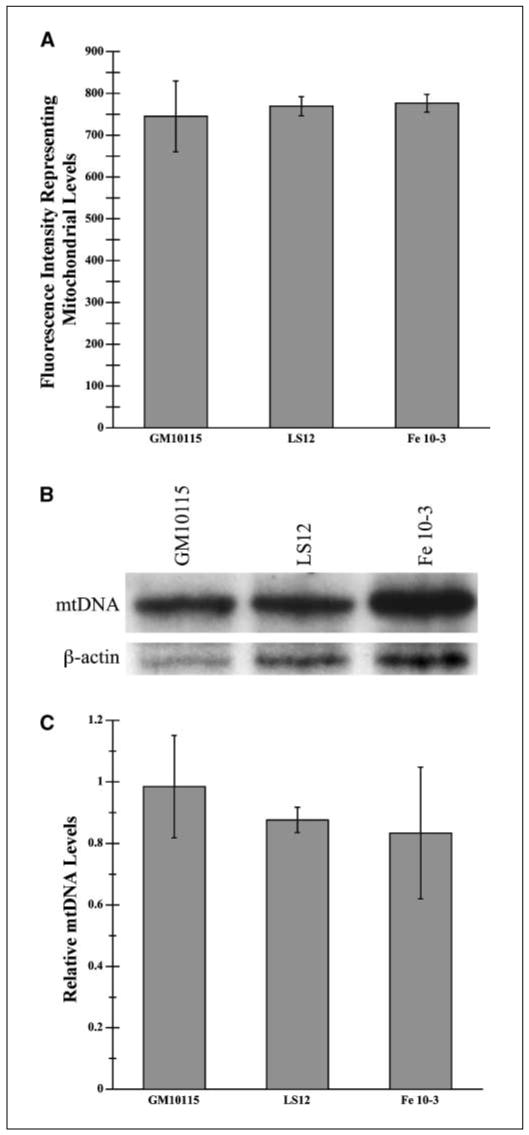
Relative cellular mitochondrial levels. A, mitochondrial levels were estimated using flow cytometry of cells stained with Mitotracker Green FM, a membrane potential-independent mitochondrial probe. Cells were incubated at 1 × 10⁶ cells/mL in PBS with 250 nmol/L Mitotracker Green FM in DMSO for 30 minutes at 34°C. Fluorescence was analyzed through flow cytometry with excitation and emission at 490 and 516 nm, respectively (n = 3). B, mtDNA was quantified by Southern blotting. Total cellular DNA (20 μg) was cleaved with Kpn1 and fragments were run out on a 0.7% agarose gel and transferred to a nylon membrane. A mix of 32P-labeled labeled cytochrome oxidase subunit 2 (COX2) and subunit 3 (COX3) probes were used to visualize mtDNA. Membranes were washed 2 hours with 2× SSC, 0.1% SDS buffer, 2 hours with 0.1× SSC, 1% SDS buffer, and then 0.1× SSC buffer at 65°C. C, as a control, 32P-labeled actin was hybridized to the membrane overnight and then washed. Levels of mtDNA were quantified using densitometry and normalized with β-actin gene levels (n = 2).
Levels of mtDNA can also reflect amounts of mitochondria. MtDNA levels were quantified through Southern blotting (34, 35) for two mtDNA encoded genes, COX2 and COX3, using β-actin DNA for normalization. There were no significant differences in mtDNA levels between cell lines (Fig. 2B and C).
Respiration
Although respiration produces ATP for cellular processes, a harmful by-product of electron transport is the superoxide radical formed when electrons do not completely transfer through the electron transport chain and react with molecular oxygen. Increased superoxide radical production occurs with respiratory defects or blockage (36, 37). To determine whether altered respiration may be the cause of the higher ROS levels in unstable cells, we measured respiratory rates of mitochondria in whole cells with plasma membranes permeabilized by digitonin. Digitonin can be used to permeabilize cell membranes, whereas intact mitochondria respiration is measured in situ in a physiologically relevant environment (38). In contrast to intact cells where metabolic demand normally limits the rate of respiration, the rate of O2 consumption by permeabilized cells can be measured at maximum and minimum rates using high levels of ADP and oligomycin, respectively. As seen in Fig. 3A, the state 3 respiration rates for both unstable lines were ∼40% lower than the parent cell line (GM10115: 106.8 nmol O2/min/107 cells; LS12, 62.6 nmol O2/min/107 cells; Fe10-3, 60.3 nmol O2/min/107 cells; P < 0.01), whereas rates of state 4 respiration were not significantly different. These results suggest all or a portion of the chain may be altered in a way that ultimately inhibits oxygen uptake. One set of additional experiments was done to verify that the electron transport chain rather than the ATP synthase or adenine nucleotide translocase is responsible for the decrease in state 3 respiration observed in the unstable cell lines. Following the addition of oligomycin, the protonophore uncoupler FCCP (10 μmol/L) was added and the rate of uncoupled respiration was measured, thereby bypassing the activity of enzymes involved in ATP synthesis and transport. Compared with the GM10115 cells, uncoupled respiration in LS12 and Fe10-3 cells was reduced by 42% and 27%, respectively. This degree of reduction was similar to the impairment observed in state 3 respiration (50% and 32%, respectively), thereby indicating that the electron transport chain or possibly tricarboxylic acid cycle enzymes are responsible for the reduced state 3 respiration observed in unstable cell lines.
Figure 3.
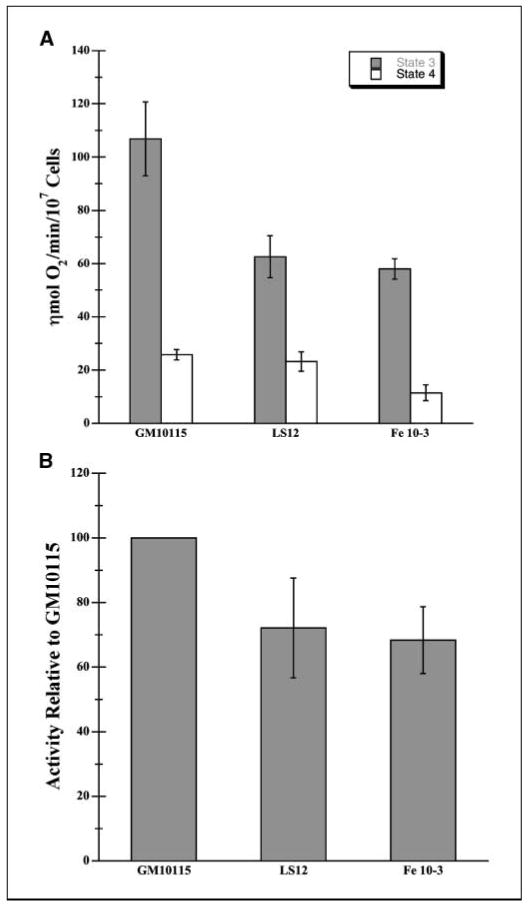
Cellular respiration and cytochrome oxidase activities. A, mitochondrial respiration in situ was measured using a thermostatically controlled Clark oxygen electrode. Cells (1 × 10⁷) were resuspended in 0.5 mL sodium buffer (140 mmol/L NaCl, 3 mmol/L KCl, 0.4 mmol/L KH2PO4, 20 mmol/L HEPES, 5 mmol/L NaHCO3, 5 mmol/L glucose, 1 mmol/L MgCl2) at 37°C. The plasma membrane was selectively permeabilized with 0.03% digitonin in DMSO. Malate (5 mmol/L) and glutamate (5 mmol/L) and ADP (1.6 mmol/L) were added to initiate state 3 respiration. Oligomycin (5 μg/mL), an ATPase synthase inhibitor, was added to initiate state 4 respiration. Columns, mean respiratory rates for state 3 and 4 respiration (n = 4); bars, SE. P < 0.01. B, cytochrome oxidase activity was measured using cells lysed with 0.5% Triton X-100 in 10 mmol/L phosphate (KH2PO4/K2HPO4) buffer containing 20 mmol/L succinate (pH 7.4) at room temperature. Reduced cytochrome c was added to cell lysates containing 30 μg protein in 20 mmol/L phosphate buffer. The rate of cytochrome c oxidation was determined over 2 minutes using a spectrophotometric assay at 550 nm. Values represent activities of unstable cells as a percentage of activity of stable cells. (n = 10; P < 0.001).
Therefore, we examined complex IV, cytochrome c oxidase, which is the final step in the respiratory chain where oxygen is reduced to a water molecule while cytochrome c becomes oxidized. We determined complex IV function by measuring the rate of oxidation of exogenous reduced cytochrome c using a spectrophotometric complex IV activity assay. Figure 3B shows the results of complex IV activity: LS12 and Fe10-3 show a 28% and 32% lower activity, respectively, compared with GM10115 (P < 0.001).
MnSOD protein level and enzyme activity determination
The oxidant status in our cell lines is dependent on both oxidant production and antioxidant activity. Consequently, we examined MnSOD enzyme activity and immunoreactivity in our clones. We found no significant differences in MnSOD levels, and although there seems to be increased relative levels for Fe10-3, the difference is not statistically significant (Fig. 4A and B). In contrast, the MnSOD enzyme activity in the unstable cells is significantly lower (40-60%) than in the stable parental cell line. (P < 0.001; Fig. 4C).
Figure 4.
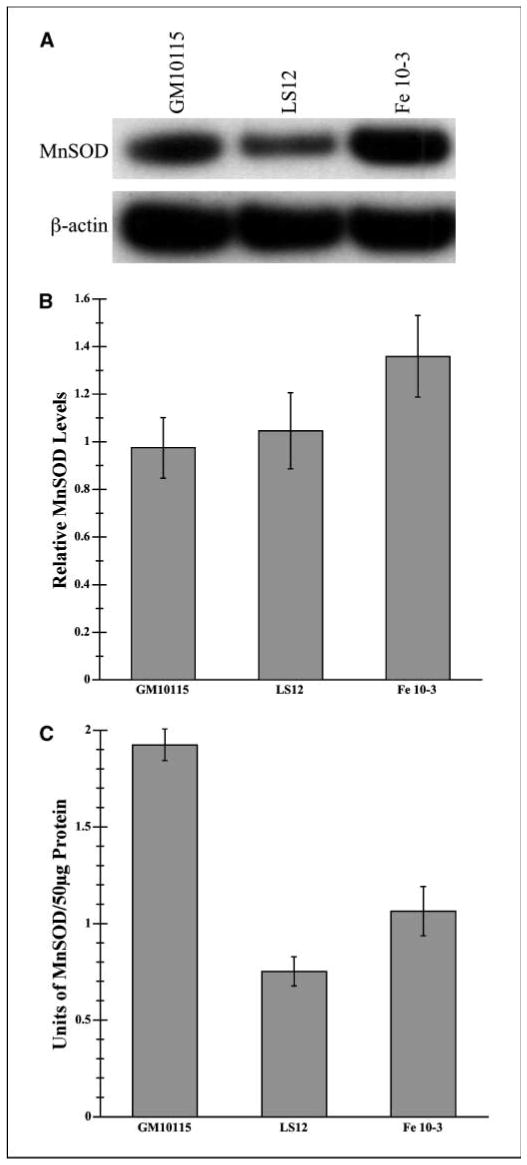
Manganese superoxide immunoreactivity and enzyme activity. A, total cellular protein was isolated and Western blotting was done for MnSOD for all three clones. β-Actin was used to normalize values. B, densitometric quantification of MnSOD immunoreactivity present in cell lysates was normalized for each Western immunoblot to β-actin levels (n = 3). C, MnSOD enzyme activity present in 50 μg cell lysate protein was measured by the ability of enzyme to prevent a colorimetric reaction involving nitroblue tetrazolium and superoxide anions generated by an exogenous reaction involving xanthine oxidase. NaCN (5 mmol/L) was added to inhibit CuZnSOD leaving MnSOD activity unaffected. BSA (0.13 mg/mL) and BCS (0.05 mmol/L) were added to eliminate electron transport–generated oxidants. For three independent experiments with three sets of lysates, absorbance changes were measured over 5 minutes at 550 nm. Units of activity were determined through a standard curve. (P < 0.001).
Discussion
Mitochondria-induced oxidative stress is implicated in many diseases, including cancer (18, 39). Morphologic changes in the mitochondria have also been seen in association with cancer (40) and in response to oxidative stress caused by respiratory defects and cytochrome oxidase inhibition (41). In a study of nontransformed NIH3T3 cells, most ROS production derives from cytosolic NADPH oxidase, whereas, in transformed liver and colon tumor cells, the increased ROS production is of mitochondrial origin (42). Some suggested mechanisms by which dysfunctional mitochondria may lead to carcinogenesis are apoptotic resistance or increased ROS leading to either (a) direct damage to crucial homeostatic genes or (b) activation of tumorigenic signaling pathways [e.g., those involving nuclear factor-κB (NF-κB) or activator protein (AP-1); ref. 43]. As genomic instability may play a role in carcinogenesis, understanding the initiation and perpetuation of RIGI may elucidate the mechanisms of tumorigenesis (44).
In investigating the role of mitochondria in RIGI, we found functional differences between the mitochondria of stable and unstable clones. Mitochondria within genetically unstable cells contribute more to total cellular ROS production than those of stable cells (Fig. 2B). This mechanism of ROS production may be responsible for the elevated cellular superoxide levels, measured by dichlorofluorescein fluorescence, and elevated lipid oxidation documented previously with the same genomically unstable cell lines used in this study (7). The elevated respiratory uncoupler-sensitive H2O2 production is not due to an abnormally high level of mitochondria (Fig. 4) or to differences in cellular energy metabolism. One possible explanation for increased mitochondrial ROS production is respiratory inhibition (e.g., caused by gene mutations or impaired gene expression; ref. 16). Oxidative stress due to increased mitochondrial ROS formation in response to respiratory defects (36, 37) may in fact contribute to tumorigenesis (45).
Although electron transport chain complexes I and III are the primary sites of mitochondrial ROS production (46), inhibition of complex IV (cytochrome oxidase) can induce the formation of ROS at these proximal sites of electron flow (47). Moreover, cyanide inhibition of complex IV induces an oxidative stress–mediated cell transformation (48). We therefore compared complex IV enzyme activity in the unstable cells and observed a significantly reduced cytochrome oxidase redox activity in the unstable cells (Fig. 3B), which correlates with their decreased state 3 respiratory activity (Fig. 3A). The cause of reduced cytochrome oxidase activity is, at this juncture, unknown. Additional measures of electron transport chain complex activities are in progress to determine if impairment is specific or generalized. Despite the reduced cytochrome oxidase activity and state 3 respiration measured in digitonin-permeabilized genomically unstable cells, rates of respiration by intact stable and unstable cells are very similar. Although the respiratory defects do not seem to limit basal cellular aerobic energy metabolism, the increased DCF fluorescence and elevated mitochondrial contribution to cellular H2O2 production strongly suggest that the respiratory dysfunction contributes to elevated oxidative stress in the unstable cell lines.
Another possible contributor to oxidative stress in the unstable clones is reduced MnSOD activity. Although the unstable clones exhibit reduced enzymatic activity (Fig. 4B), immunoreactive levels of the MnSOD protein are similar (Fig. 4A). The decreased enzymatic activity could be due to increased ROS as MnSOD is subject to inactivation by several reactive oxygen and nitrogen species, including H2O2 (49, 50). Although reduced MnSOD activity could contribute to the increased DCF fluorescence seen in the unstable cells, it does not explain elevated mitochondrial contribution to cellular H2O2 production. The Amplex Red method for measuring H2O2 production precludes the detection of altered MnSOD activity as exogenous CuZnSOD is included in the assay medium primarily to reduce background Amplex Red oxidation. In addition, the cellular CuZnSOD activity and spontaneous superoxide dismutation likely mask any defect in MnSOD activity when measuring cellular H2O2 production. A cycle of perpetuated oxidative stress may be occurring in the unstable cell system that is promoted by decreased MnSOD activity, mitochondrial molecular alterations, respiratory inhibition, and elevated mitochondrial ROS production. Decreased MnSOD activity is found in most cancers (51), whereas up-regulation of MnSOD suppresses tumor growth (52). Evidence also suggests that MnSOD helps maintain genomic stability. Heterozygous MnSOD knockout fibroblasts experience a loss of cell viability, increased mitochondrial oxidative stress, and increased chromosomal abnormalities, including double-strand breaks, end-to-end fusions, and chromosomal translocations (53).
We have shown mitochondrial abnormalities in the unstable cells and that they contribute to the oxidative stress seen in RIGI. These results extend initial studies by Nagar et al. (54) where unstable clones showed increased cytochrome c release and variations in apoptotic protein profiles. What we suspect may be occurring is a combination of events that each lead to overall cellular oxidative stress, including mitochondrial dysfunction, stress signaling pathways, including NF-κB (55) or AP-1, or cytokine signaling pathways, involving transforming growth factor-β or interleukin-8, which increase ROS levels. We are currently testing these possibilities. How ROS is involved in genetic instability is unclear. In addition to direct ROS-mediated cellular damage, global processes involved in genome stabilization are probably disrupted. Our results contribute to the growing evidence that mitochondrial abnormalities are involved in oncogenesis through its role in nuclear genome destabilization.
Acknowledgments
Grant support: NIH grant NS34152.
We thank Keshav K. Singh, Tibor Kristian, Rosemary Schuh, Erica Martin, Christos Chinopoulos, Jim Corcoran, Leslie Smith, and Melinda Wilson for their help and advice.
References
- 1.Little JB. Radiation carcinogenesis. Carcinogenesis. 2000;21:397–404. doi: 10.1093/carcin/21.3.397. [DOI] [PubMed] [Google Scholar]
- 2.Morgan WF. Non-targeted and Delayed effects of exposure to ionizing radiation: I. Radiation-induced genomic instability and bystander effects in vitro. Radiat Res. 2003;159:567–80. doi: 10.1667/0033-7587(2003)159[0567:nadeoe]2.0.co;2. [DOI] [PubMed] [Google Scholar]
- 3.Ullrich RL, Ponnaiya B. Radiation-induced instability and its relation to radiation carcinogenesis. Int J Radiat Biol. 1998;74:747–54. doi: 10.1080/095530098141023. [DOI] [PubMed] [Google Scholar]
- 4.Snyder AR, Morgan WF. Radiation-induced chromosomal instability and gene expression profiling: searching for clues to initiation and perpetuation. Mutat Res. 2004;568:89–96. doi: 10.1016/j.mrfmmm.2004.06.048. [DOI] [PubMed] [Google Scholar]
- 5.Limoli CL, Corcoran JJ, Milligan JR, Ward JF, Morgan WF. Critical target and dose and dose-rate responses for the induction of chromosomal instability by ionizing radiation. Radiat Res. 1999;151:677–85. [PubMed] [Google Scholar]
- 6.Spitz DR, Azzam EI, Li JJ, Gius D. Metabolic oxidation/reduction reactions and cellular responses to ionizing radiation: a unifying concept in stress response biology. Cancer Metastasis Rev. 2004;23:311–22. doi: 10.1023/B:CANC.0000031769.14728.bc. [DOI] [PubMed] [Google Scholar]
- 7.Clutton SM, Townsend KM, Walker C, Ansell JD, Wright EG. Radiation-induced genomic instability and persisting oxidative stress in primary bone marrow cultures. Carcinogenesis. 1996;17:1633–9. doi: 10.1093/carcin/17.8.1633. [DOI] [PubMed] [Google Scholar]
- 8.Limoli CL, Giedzinski E, Morgan WF, Swarts SG, Jones GD, Hyun W. Persistent oxidative stress in chromosomally unstable cells. Cancer Res. 2003;63:3107–11. [PubMed] [Google Scholar]
- 9.Limoli CL, Hartmann A, Shephard L, et al. Apoptosis, reproductive failure, and oxidative stress in Chinese hamster ovary cells with compromised genomic integrity. Cancer Res. 1998;58:3712–8. [PubMed] [Google Scholar]
- 10.Hunt CR, Sim JE, Sullivan SJ, et al. Genomic instability and catalase gene amplification induced by chronic exposure to oxidative stress. Cancer Res. 1998;58:3986–92. [PubMed] [Google Scholar]
- 11.Limoli CL, Giedzinski E. Induction of chromosomal instability by chronic oxidative stress. Neoplasia. 2003;5:339–46. doi: 10.1016/S1476-5586(03)80027-1. [DOI] [PMC free article] [PubMed] [Google Scholar]
- 12.Limoli CL, Kaplan MI, Giedzinski E, Morgan WF. Attenuation of radiation-induced genomic instability by free radical scavengers and cellular proliferation. Free Radic Biol Med. 2001;31:10–9. doi: 10.1016/s0891-5849(01)00542-1. [DOI] [PubMed] [Google Scholar]
- 13.Roy K, Kodama S, Suzuki K, Fukase K, Watanabe M. Hypoxia relieves X-ray-induced delayed effects in normal human embryo cells. Radiat Res. 2000;154:659–66. doi: 10.1667/0033-7587(2000)154[0659:hrxrid]2.0.co;2. [DOI] [PubMed] [Google Scholar]
- 14.Hall EJ. Radiobiology for the radiologist. 5th. Philadelphia: Lippincott Williams & Wilkins; 2000. [Google Scholar]
- 15.Balaban RS, Nemoto S, Finkel T. Mitochondria, oxidants, and aging. Cell. 2005;120:483–95. doi: 10.1016/j.cell.2005.02.001. [DOI] [PubMed] [Google Scholar]
- 16.Boveris A, Oshino N, Chance B. The cellular production of hydrogen peroxide. Biochem J. 1972;128:617–30. doi: 10.1042/bj1280617. [DOI] [PMC free article] [PubMed] [Google Scholar]
- 17.Wei YH, Lu CY, Lee HC, Pang CY, Ma YS. Oxidative damage and mutation to mitochondrial DNA and age-dependent decline of mitochondrial respiratory function. Ann N Y Acad Sci. 1998;854:155–70. doi: 10.1111/j.1749-6632.1998.tb09899.x. [DOI] [PubMed] [Google Scholar]
- 18.Singh KK. Mitochondrial dysfunction is a common phenotype in aging and cancer. Ann N Y Acad Sci. 2004;1019:260–4. doi: 10.1196/annals.1297.043. [DOI] [PubMed] [Google Scholar]
- 19.Shidara Y, Yamagata K, Kanamori T, et al. Positive contribution of pathogenic mutations in the mitochondrial genome to the promotion of cancer by prevention from apoptosis. Cancer Res. 2005;65:1655–63. doi: 10.1158/0008-5472.CAN-04-2012. [DOI] [PubMed] [Google Scholar]
- 20.Limoli CL, Ponnaiya B, Corcoran JJ, Giedzinski E, Morgan WF. Chromosomal instability induced by heavy ion irradiation. Int J Radiat Biol. 2000;76:1599–606. doi: 10.1080/09553000050201082. [DOI] [PubMed] [Google Scholar]
- 21.Marder BA, Morgan WF. Delayed chromosomal instability induced by DNA damage. Mol Cell Biol. 1993;13:6667–77. doi: 10.1128/mcb.13.11.6667. [DOI] [PMC free article] [PubMed] [Google Scholar]
- 22.Limoli CL, Kaplan MI, Corcoran J, Meyers M, Boothman DA, Morgan WF. Chromosomal instability and its relationship to other end points of genomic instability. Cancer Res. 1997;57:5557–63. [PubMed] [Google Scholar]
- 23.Nagar S, Smith LE, Morgan WF. Characterization of a novel epigenetic effect of ionizing radiation: the death-inducing effect. Cancer Res. 2003;63:324–8. [PubMed] [Google Scholar]
- 24.Starkov AA, Fiskum G. Regulation of brain mitochondrial H2O2 production by membrane potential and NAD(P)H redox state. J Neurochem. 2003;86:1101–7. doi: 10.1046/j.1471-4159.2003.01908.x. [DOI] [PubMed] [Google Scholar]
- 25.Pendergrass W, Wolf N, Poot M. Efficacy of MitoTracker Green and CMXrosamine to measure changes in mitochondrial membrane potentials in living cells and tissues. Cytometry A. 2004;61:162–9. doi: 10.1002/cyto.a.20033. [DOI] [PubMed] [Google Scholar]
- 26.Petit JM, Maftah A, Ratinaud MH, Julien R. 10N-nonyl acridine orange interacts with cardiolipin and allows the quantification of this phospholipid in isolated mitochondria. Eur J Biochem. 1992;209:267–73. doi: 10.1111/j.1432-1033.1992.tb17285.x. [DOI] [PubMed] [Google Scholar]
- 27.Garcia Fernandez MI, Ceccarelli D, Muscatello U. Use of the fluorescent dye 10-N-nonyl acridine orange in quantitative and location assays of cardiolipin: a study on different experimental models. Anal Biochem. 2004;328:174–80. doi: 10.1016/j.ab.2004.01.020. [DOI] [PubMed] [Google Scholar]
- 28.Nisoli E, Clementi E, Paolucci C, et al. Mitochondrial biogenesis in mammals: the role of endogenous nitric oxide. Science. 2003;299:896–9. doi: 10.1126/science.1079368. [DOI] [PubMed] [Google Scholar]
- 29.Nass MM. Restriction map of Chinese hamster mitochondrial DNA containing replication coordinates: comparison with Syrian hamster mitochondrial genome. Gene. 1983;21:249–55. doi: 10.1016/0378-1119(83)90008-2. [DOI] [PubMed] [Google Scholar]
- 30.Fiskum G, Kowaltowksi AJ, Andreyev AY, Kushnareva YE, Starkov AA. Apoptosis-related activities measured with isolated mitochondria and digitonin-permeabilized cells. Methods Enzymol. 2000;322:222–34. doi: 10.1016/s0076-6879(00)22023-5. [DOI] [PubMed] [Google Scholar]
- 31.Trounce IA, Kim YL, Jun AS, Wallace DC. Assessment of mitochondrial oxidative phosphorylation in patient muscle biopsies, lymphoblasts, and transmitochondrial cell lines. Methods Enzymol. 1996;264:484–509. doi: 10.1016/s0076-6879(96)64044-0. [DOI] [PubMed] [Google Scholar]
- 32.Storrie B, Madden EA. Isolation of subcellular organelles. Methods Enzymol. 1990;182:203–25. doi: 10.1016/0076-6879(90)82018-w. [DOI] [PubMed] [Google Scholar]
- 33.Spitz DR, Oberley LW. An assay for superoxide dismutase activity in mammalian tissue homogenates. Anal Biochem. 1989;179:8–18. doi: 10.1016/0003-2697(89)90192-9. [DOI] [PubMed] [Google Scholar]
- 34.Wredenberg A, Wibom R, Wilhelmsson H, et al. Increased mitochondrial mass in mitochondrial myopathy mice. Proc Natl Acad Sci U S A. 2002;99:15066–71. doi: 10.1073/pnas.232591499. [DOI] [PMC free article] [PubMed] [Google Scholar]
- 35.Wiedemann FR, Manfredi G, Mawrin C, Beal MF, Schon EA. Mitochondrial DNA and respiratory chain function in spinal cords of ALS patients. J Neurochem. 2002;80:616–25. doi: 10.1046/j.0022-3042.2001.00731.x. [DOI] [PubMed] [Google Scholar]
- 36.Turrens JF. Mitochondrial formation of reactive oxygen species. J Physiol. 2003;552:335–44. doi: 10.1113/jphysiol.2003.049478. [DOI] [PMC free article] [PubMed] [Google Scholar]
- 37.Geromel V, Kadhom N, Cebalos-Picot I, et al. Superoxide-induced massive apoptosis in cultured skin fibroblasts harboring the neurogenic ataxia retinitis pigmentosa (NARP) mutation in the ATPase-6 gene of the mitochondrial DNA. Hum Mol Genet. 2001;10:1221–8. doi: 10.1093/hmg/10.11.1221. [DOI] [PubMed] [Google Scholar]
- 38.Steyn SJ, Pieterse DJ, Mienie LJ, Van der Schyf CJ. Measurement of mitochondrial respiration in permeabilized murine neuroblastoma (N-2α) cells, a simple and rapid in situ assay to investigate mitochondrial toxins. J Biochem Biophys Methods. 2005;62:25–40. doi: 10.1016/j.jbbm.2004.07.002. [DOI] [PubMed] [Google Scholar]
- 39.Ishii T, Yasuda K, Akatsuka A, Hino O, Hartman PS, Ishii N. A mutation in the SDHC gene of complex II increases oxidative stress, resulting in apoptosis and tumorigenesis. Cancer Res. 2005;65:203–9. [PubMed] [Google Scholar]
- 40.Bandy B, Davison AJ. Mitochondrial mutations may increase oxidative stress: implications for carcinogenesis and aging? Free Radic Biol Med. 1990;8:523–39. doi: 10.1016/0891-5849(90)90152-9. [DOI] [PubMed] [Google Scholar]
- 41.Walker DW, Benzer S. Mitochondrial “swirls” induced by oxygen stress and in the Drosphila mutant hyperswirl. Proc Natl Acad Sci U S A. 2004;101:10290–5. doi: 10.1073/pnas.0403767101. [DOI] [PMC free article] [PubMed] [Google Scholar]
- 42.Laurent A, Nicco C, Chereau C, et al. Controlling tumor growth by modulating endogenous production of reactive oxygen species. Cancer Res. 2005;65:948–56. [PubMed] [Google Scholar]
- 43.Enns GM. The contribution of mitochondria to common disorders. Mol Genet Metab. 2003;80:11–26. doi: 10.1016/j.ymgme.2003.08.009. [DOI] [PubMed] [Google Scholar]
- 44.Selvanayagam CS, Davis CM, Cornforth MN, Ullrich RL. Latent expression of p53 mutations and radiation-induced mammary cancer. Cancer Res. 1995;55:3310–7. [PubMed] [Google Scholar]
- 45.Copeland WC, Wachsman JT, Johnson FM, Penta JS. Mitochondrial DNA alterations in cancer. Cancer Invest. 2002;20:557–69. doi: 10.1081/cnv-120002155. [DOI] [PubMed] [Google Scholar]
- 46.Lenaz G. The mitochondrial production of reactive oxygen species: mechanisms and implications in human pathology. IUBMB Life. 2001;52:159–64. doi: 10.1080/15216540152845957. [DOI] [PubMed] [Google Scholar]
- 47.Dawson TL, Gores GJ, Nieminen AL, Herman B, Lemasters JJ. Mitochondria as a source of reactive oxygen species during reductive stress in rat hepatocytes. Am J Physiol. 1993;264:C961–7. doi: 10.1152/ajpcell.1993.264.4.C961. [DOI] [PubMed] [Google Scholar]
- 48.Kamendulis LM, Zhang H, Wang Y, Klaunig JE. Morphological transformation and oxidative stress induced by cyanide in Syrian hamster embryo (SHE) cells. Toxicol Sci. 2002;68:437–43. doi: 10.1093/toxsci/68.2.437. [DOI] [PubMed] [Google Scholar]
- 49.MacMillan-Crow LA, Thompson JA. Tyrosine modifications and inactivation of active site manganese superoxide dismutase mutant (Y34F) by peroxynitrite. Arch Biochem Biophys. 1999;366:82–8. doi: 10.1006/abbi.1999.1202. [DOI] [PubMed] [Google Scholar]
- 50.Ramirez DC, Gomez Mejiba SE, Mason RP. Mechanism of hydrogen peroxide-induced Cu,Zn-superoxide dismutase-centered radical formation as explored by immuno-spin trapping: the role of copper- and carbonate radical anion-mediated oxidations. Free Radic Biol Med. 2005;38:201–14. doi: 10.1016/j.freeradbiomed.2004.10.008. [DOI] [PubMed] [Google Scholar]
- 51.Oberley LW. Mechanism of the tumor suppressive effect of MnSOD overexpression. Biomed Pharmacother. 2005;59:143–8. doi: 10.1016/j.biopha.2005.03.006. [DOI] [PubMed] [Google Scholar]
- 52.Clair DK, Wan XS, Oberley TD, Muse KE, Clair WH. Suppression of radiation-induced neoplastic transformation by overexpression of mitochondrial superoxide dismutase. Mol Carcinog. 1992;6:238–42. doi: 10.1002/mc.2940060404. [DOI] [PubMed] [Google Scholar]
- 53.Samper E, Nicholls DG, Melov S. Mitochondrial oxidative stress causes chromosomal instability of mouse embryonic fibroblasts. Aging Cell. 2003;2:277–85. doi: 10.1046/j.1474-9728.2003.00062.x. [DOI] [PubMed] [Google Scholar]
- 54.Nagar S, Smith LE, Morgan WF. Variation in apoptosis profiles in radiation-induced genomically unstable cell lines. Radiat Res. 2005;163:324–31. doi: 10.1667/rr3287. [DOI] [PubMed] [Google Scholar]
- 55.Snyder AR, Morgan WF. Differential induction and activation of NF-κB transcription complexes in radiation-induced chromosomally unstable cell lines. Environ Mol Mutagen. 2005;45:177–87. doi: 10.1002/em.20092. [DOI] [PubMed] [Google Scholar]