Abstract
Wall teichoic acids (WTAs) are anionic polymers that coat the cell walls of Gram-positive bacteria. Because they are essential for survival or virulence in many organisms, the enzymes involved in the biosynthesis of WTAs are attractive antibiotic targets. The first committed step in the WTA biosynthetic pathway in Bacillus subtilis is catalyzed by TagA, which transfers N-acetyl mannosamine (ManNAc) to the C4 hydroxyl of a membrane-anchored N-acetyl glucosaminyl diphospholipid (GlcNAc-pp-undecaprenyl, lipid I) to make ManNAc-β-(1,4)-GlcNAc-pp-undecaprenyl (lipid II). We have previously shown that TagA utilizes an alternative substrate containing a saturated C13H27 lipid chain. Here we use unnatural substrates and products to establish the lipid preferences of the enzyme and to characterize the kinetic mechanism. We report that TagA is a metal ion-independent glycosyltransferase that follows a steady-state ordered Bi Bi mechanism in which UDP-ManNAc binds first and UDP is released last. TagA shares homology with a large family of bacterial glycosyltransferases, and the work described here should facilitate structural analysis of the enzyme in complex with its substrates.
WTAs are anionic phosphate-rich polymers that are covalently linked to peptidoglycan in the cell walls of many Gram-positive bacteria, including pathogens such as Staphylococcus aureus, Staphylococcus epidermis, Streptococcus pneumoniae, Enterococcus faecalis and Listeria monocytogenes (1). Although the functions of WTAs are poorly understood, they have been shown to be essential for survival in some organisms (2, 3) and involved in virulence in others (4, 5). For example, in S. aureus, WTAs are required for colonization of epithelial and endothelial tissues, and mutant strains lacking WTAs are poorly infective (4, 5). Blocking WTA biosynthesis may thus be a promising strategy for combating Gram-positive bacterial infections. Structural and mechanistic information on enzymes involved in WTA biosynthesis could facilitate the identification of inhibitors, making it possible to evaluate the potential of the WTA pathway as a target for antimicrobial intervention.
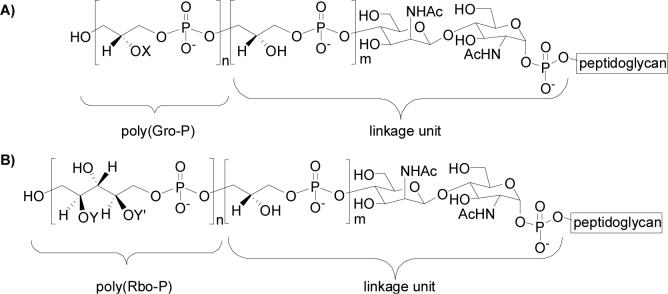
WTAs from many different bacterial strains have been isolated and characterized, and they exhibit considerable structural variety. However, these polymers all share a general structure that can be divided into two parts: a main chain composed of repeating monomer units joined through phosphodiester linkages, and a linkage unit that attaches the main chain to peptidoglycan (1). The most common main chain monomers are polyglycerol phosphate and polyribitol phosphate (Figure 1). The linkage unit is highly conserved, and consists of one to three glycerol phosphate (Gro-P) units attached to an N-acetyl mannosaminyl β-(1,4)-N-acetyl glucosaminyl (ManNAc-β-(1,4)-GlcNAc) disaccharide, which is anchored to peptidoglycan through a phosphodiester linkage to C6 of some of the N-acetyl muramoyl pentapeptide units (Figure 2) (6).
Figure 1. Representative wall teichoic acid structures. The polyol chains are usually modified with sugars, aminosugars or D-alanyl esters (1). The type and extent of modification vary among bacterial strains, and also depend on the bacterial environment.
(A) Polyglycerol phosphate variants. B. subtilis 168: X = D-alanine/ α-glucose/H; S. epidermis RP62A: X = D-alanine/ α-glucose/ α-glucose-6-O-alanine/ α-GlcNAc. (B) Polyribitol phosphate variants. S. aureus H: Y = D-alanine and Y' = α or β GlcNAc; Listeria monocytogenes serotype 1/2: Y = α-rhamnose and Y' = α-GlcNac.
Figure 2.
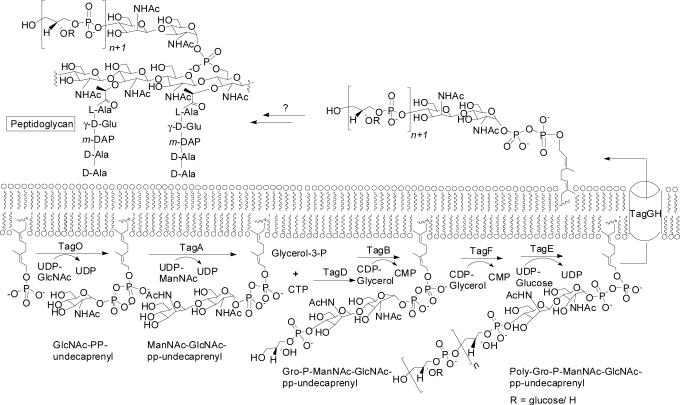
Polyglycerol phosphate WTA biosynthesis in B. subtilis 168. Different bacterial strains synthesize different main chain monomers, but synthesis of the linkage unit is largely conserved.
WTA biosynthesis has been studied most extensively in B. subtilis, which is the major model organism for Gram-positive bacteria. The tag pathway for polyglycerol phosphate WTA synthesis in B. subtilis 168 is outlined in Figure 2, and serves as the paradigm for WTA biosynthesis in other organisms (1).
WTAs are assembled on an undecaprenyl “carrier lipid” anchored in the cytoplasmic membrane, then flipped across the membrane by an ABC-type transporter, and attached to peptidoglycan (1). The initial GlcNAc-PP-undecaprenyl membrane acceptor is formed by TagO, an enzyme that may also be involved in the synthesis of teichuronic acids and various minor teichoic acid polymers (7). Therefore, the first committed step in the WTA biosynthetic pathway in Bacillus subtilis is catalyzed by TagA, a glycosyltransferase (Gtf) that forms a β-glycosidic linkage between N-acetyl mannosamine (ManNAc) and the C4 hydroxyl of a membrane-anchored N-acetyl glucosaminyl diphospholipid (GlcNAc-pp-undecaprenyl, lipid I), to give ManNAc-β-(1,4)-GlcNAc-pp-undecaprenyl (lipid II). Sequence homologies indicate that TagA is related to a family of uncharacterized glycosyltransferases involved in the biosynthesis of bacterial cell-surface structures (8), including WecG, a UDP-N-acetyl-D-mannosaminuronic acid transferase involved in enterobacterial common antigen synthesis (9), and CpsF, a CMP-N-acetylneuraminic acid synthetase involved in capsular polysaccharide biosynthesis (10). These enzymes do not appear to resemble any Gtfs for which structural information is available (11-14). Therefore, TagA is a potential target for antimicrobial agents as well as a model system for an uncharacterized family of Gtfs. Information on the kinetic mechanism of the enzyme may lay the groundwork for more detailed structural and mechanistic investigations.
We have recently reconstituted the activity of B. subtilis TagA in vitro using the synthetic substrate analog GlcNAc-pp-C13H27 (15). This synthetic substrate contains a much shorter lipid chain than the natural substrate, which has a 55 carbon undecaprenyl “carrier” lipid that makes substrate isolation and kinetic studies of TagA challenging. Here we investigate the optimal reaction conditions and substrate preferences of B. subtilis TagA and then use this information in the kinetic characterization of the enzyme. We demonstrate that TagA follows an ordered Bi Bi kinetic mechanism, where UDP-ManNAc binds first and the UDP product is released last. Information concerning the substrate preferences and kinetic mechanism of the enzyme should facilitate crystallization of TagA bound to substrate or product analogs, and may help guide efforts to obtain specific inhibitors of this enzyme.
Materials and Methods
General Materials and Methods
All chemicals were purchased from Sigma-Aldrich and used without further purification except where otherwise noted. Reagent grade solvents were used, and were further dried when necessary. 1H NMR spectra were recorded on Varian Inova 600 MHz spectrometer. Mass spectra (ESI) were recorded using an Agilent 1100 series LC/MSD instrument.
Bacillus subtilis TagA was overexpressed, purified as described (15), and then stored at − 80°C as a 20% glycerol stock (20 mM Tris-HCl, pH 7.9, 200 mM imidazole, and 0.5 M NaCl). The enzyme concentration was calculated from the absorbance of the protein at 280 nm (denatured in 6M guanidinium hydrochloride) using the molar extinction coefficient of 40,680 calculated for TagA. Lipid I analogs 1−5 (Figure 4) were prepared according to literature methods (15-17). The 1H NMR spectrum of 1 was reported previously (15).
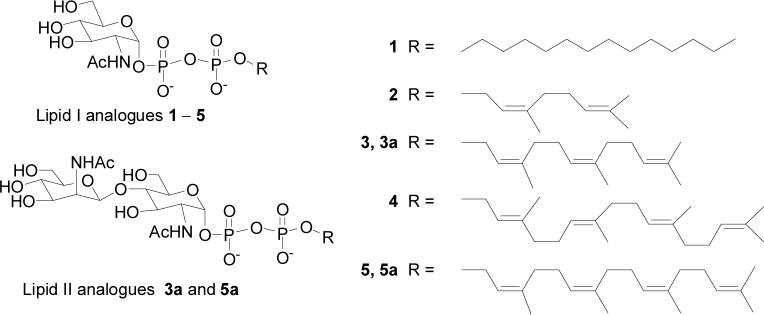
Figure 4.
Lipid I and lipid II analogs described in the text.
Lipid I analog 2
1H NMR (600 MHz, D2O) δ 5.35 (dd, J = 3.2, 7.3 Hz, 1H), 5.32 (t, J = 7.0 Hz, 1H), 5.09−5.06 (m, 1H), 4.36−4.31 (m, 2H), 3.85 (dt, J = 3.2, 10.6 Hz, 1H), 3.79 (ddd, J = 2.3, 4.4, 10.0 Hz, 1H), 3.74 (dd, J = 2.3, 12.3 Hz, 1H), 3.68 (dd, J = 9.1, 10.6 Hz, 1H), 3.66 (dd, J = 4.4, 12.3 Hz, 1H), 3.40 (dd, J = 9.1, 10.0 Hz, 1H), 2.03−1.99 (m, 4H), 1.94 (s, 3H), 1.65 (s, 3H), 1.57 (s, 3H), 1.50 (s, 3H); ESI-MS calculated for C18H32NO12P2 [M−]: 516.1, found: 516.2.
Lipid I analog 3
1H NMR (600 MHz, D2O) δ 5.35 (dd, J = 3.2, 7.3 Hz, 1H), 5.32 (t, J = 7.0 Hz, 1H), 5.09−5.06 (m, 2H), 4.36−4.31 (m, 2H), 3.85 (dt, J = 3.2, 10.6 Hz, 1H), 3.79 (ddd, J = 2.3, 4.4, 10.0 Hz, 1H), 3.74 (dd, J = 2.3, 12.3 Hz, 1H), 3.68 (dd, J = 9.1, 10.6 Hz, 1H), 3.66 (dd, J = 4.4, 12.3 Hz, 1H), 3.40 (dd, J = 9.1, 10.0 Hz, 1H), 2.03−1.99 (m, 4H), 1.98−1.96 (m, 4H), 1.93 (s, 3H), 1.63 (s, 3H), 1.56 (s, 6H), 1.50 (s, 3H); ESI-MS calculated for C23H40NO12P2 [M−]: 584.2, found: 584.3.
Lipid I analog 4
1H NMR (600 MHz, D2O) δ 5.38 (dd, J = 2.9, 7.0 Hz, 1H), 5.29 (t, J = 6.5 Hz, 1H), 5.02−4.95 (m, 3H), 4.36−4.34 (m, 2H), 3.85 (dt, J = 2.9, 10.6 Hz, 1H), 3.79 (ddd, J = 2.3, 4.4, 10.0 Hz, 1H), 3.74 (dd, J = 2.3, 12.3 Hz, 1H), 3.68 (dd, J = 9.1, 10.6 Hz, 1H), 3.66 (dd, J = 4.4, 12.3 Hz, 1H), 3.40 (dd, J = 9.1, 10.0 Hz, 1H), 2.00−1.89 (m, 8H), 1.93 (s, 3H), 1.86−1.82 (m, 4H), 1.59 (s, 3H), 1.53 (s, 3H), 1.48 (s, 3H), 1.45 (s, 6H); ESI-MS calculated for C28H48NO12P2 [M−]: 652.2, found: 652.2.
Lipid I analog 5
1H NMR (600 MHz, D2O) δ 5.35 (dd, J = 3.2, 7.3 Hz, 1H), 5.30 (t, J = 6.7 Hz, 1H), 5.04−4.90 (m, 3H), 4.32−4.30 (m, 2H), 3.85 (dt, J = 3.2, 10.6 Hz, 1H), 3.79 (ddd, J = 2.3, 4.4, 10.0 Hz, 1H), 3.74 (dd, J = 2.3, 12.3 Hz, 1H), 3.68 (dd, J = 9.1, 10.6 Hz, 1H), 3.66 (dd, J = 4.4, 12.3 Hz, 1H), 3.40 (dd, J = 9.1, 10.0 Hz, 1H), 2.01−1.98 (m, 4H), 1.96−1.89 (m, 8H),1.92 (s, 3H), 1.60 (s, 3H), 1.54 (s, 3H), 1.52 (s, 6H), 1.45 (s, 3H); ESI-MS calculated for C28H48NO12P2 [M−]: 652.2, found: 652.3.
Enzymatic synthesis of 5a
5a (Figure 4) was prepared from 5 using purified TagA. 3.2 mg 5 was dissolved in 1 mL 50:50 CH3OH:H2O and added to 50 mL TagA reaction buffer (50 mM Tris-HCl, pH 7.8, 250 mM NaCl, 100 mM imidazole, 10 mg TagA), followed by 6.1 mg UDP-ManNAc dissolved in 0.5 mL H2O. After 12 hours at room temperature, LC/MS analysis showed almost 100% conversion to product. The crude reaction mixture was concentrated to ∼1 mL, 15 mL MeOH was added to recrystallize the salts, and the resulting mixture was filtered. The filtrate was concentrated and the residue was dissolved in 300 μL H2O and purified over an Alltech® High-Flow C18 Extract-Clean™ SPE Column (60 Å, 100mg, 1.5 mL). The disaccharide product was eluted with a gradient of 0−100% CH3OH in 0.1% aqueous NH4HCO3 to obtain pure 5a in quantitative yield (ESI-MS calculated for C31H53N2O17P2 [M−]: 787.2, found: 787.4).
HPLC Assay
Reaction mixtures were analyzed using an Agilent 1100 series HPLC instrument with a binary pump and a standard autosampler. 20 μL of each sample solution was injected on a Phenomenex Luna NH2 column (3μm, 150 × 4.6 mm), and eluted at a flow rate of 0.5 mL/min using a gradient of 50−100 % B over 10 min, followed by a 12 min wash with 100% B (Solution A: 20 mM sodium phosphate, pH 7.0, 10 % acetonitrile; Solution B: 20 mM sodium phosphate, pH 7.0, 10 % acetonitrile, 1 M sodium chloride). UV peaks corresponding to UDP were measured at 260 nm and automatically integrated using the Agilent ChemStation data browser. To convert the measured peak areas to UDP concentrations, a calibration curve was constructed using known concentrations of UDP. Control experiments described in the text have established that UDP formation correlates with the extent of glycosyltransfer.
LC/MS assay
Reactions were quenched with 15 μL DMF containing 20 μM 4 as an internal standard. Mass spectrometric data were obtained on an Agilent 1100 series LC/MSD mass spectrometer equipped with a binary pump and a standard autosampler. 10 μL of each sample solution were injected on an Agilent C18 column (5 μm, 250 × 4.6 mm), and eluted at a flow rate of 0.5 mL/min using a step gradient: 0−20% B over 8 min, 20−95% B over 1 min, 95% B for 14 min (Solution A: water; Solution B: acetonitrile). The column temperature was set to 35 °C. The eluate was directed to waste for 10 minutes to flush the salts out of the system, after which the entire eluate was redirected into the ESI source of the quadruple mass spectrometer. The drying gas temperature and the spray voltage were kept at 350 °C and 3.0 kV, respectively. Selective ion monitoring (SIM) was used to detect ions of lipid II and internal standard 4. The total ion chromatogram (TIC) peak area for each SIM ion was automatically integrated using the Agilent ChemStation data browser. The integrated peak areas of the product ion and the internal standard ion were used to calculate a peak area ratio (Ap/Ais). Calibration curves were constructed using known concentrations of the lipid II product and internal standard 4, and used to convert the lipid II concentration from the peak area ratio.
Preliminary Enzyme Assays
The pH dependence of TagA activity was measured at room temperature between pH 6.3 and 9.5 using Bis-Tris propane buffer (50 mM). The effects of NaCl, divalent metal ions, and EDTA on catalysis were determined in Tris-HCl buffer (50 mM, pH 7.8). Reactions were carried out in a total volume of 15 μL, and contained 100 nM TagA, 250 mM NaCl, 100 μM UDP-ManNAc and 100 μM 1. Reaction rates were determined using the HPLC assay.
Enzyme Kinetics
Substrates and TagA were added at the indicated concentrations to a 15 μL reaction mixture containing 50 mM Tris, pH 7.8, and 250 mM NaCl. 1 and 2 were added to the reactions in water and 3−5 were added in 1:1 H2O:CH3OH. Reactions were initiated by the addition of TagA, and incubated at room temperature. To obtain initial rate data, incubation times were chosen so that there was less than 15% conversion to product. Reactions were quenched with 15 μL DMF, and centrifuged for 20 minutes at 14,000 × g prior to analysis.
The values of Km,app and Vmax for 1−5 were determined using the HPLC assay. Assays were carried out with [UDP-ManNAc] fixed at 600 μM (about three times Km) because of the limited supply of this synthetic substrate. For 3−5, 10 % DMSO was added to the reaction mixtures to ensure the solubility of the glycosyl acceptors. Preliminary experiments using substrate 1 have shown that DMSO concentrations up to 17% have a negligible effect on the activity of TagA (see Supporting Information).
For the mechanistic analysis, a 5 × 5 matrix of initial rate reactions was constructed, with [UDP-ManNAc] at 25, 50, 100, 200, 600 μM and [3] at 25, 50, 100, 200, 500 μM. Rates were determined using the HPLC assay.
Product inhibition studies
The inhibition of TagA activity by UDP was determined using the LC/MS assay. For inhibition with respect to UDP-ManNAc, [3] was held at 100 μM, and UDP and UDP-ManNAc were added at the concentrations indicated in Figure 6A. For inhibition with respect to 3, [UDP-ManNAc] was held at 100 μM, and UDP and 3 were added at the concentrations indicated in Figure 6B. Prior to analysis, all reactions were quenched with 15 μL DMF containing 20 μM 4 as the internal standard.
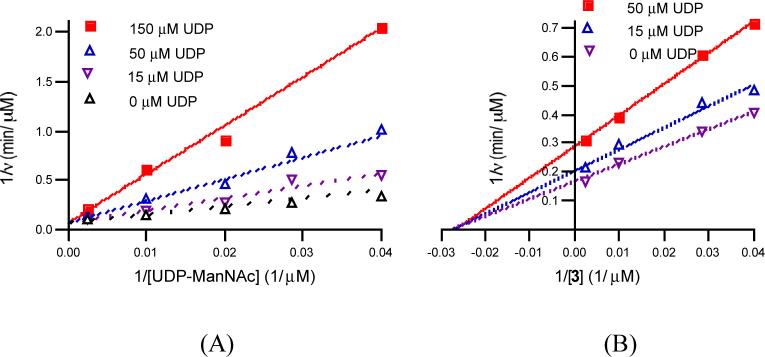
Figure 6.
(A) Product inhibition by UDP vs. UDP-ManNAc. Initial rates were measured at 52 nM TagA and 100 μM 3 in the presence of several fixed concentrations of UDP (0, 15, 50 and 150 μM) and varied UDP-ManNAc (25−400 μM). The data were fit to Equation 3 for competitive inhibition. (B) Inhibition of UDP vs. lipid I analog 3. Initial rates were measured at 52 nM TagA and 100 μM UDP-ManNAc in the presence of several fixed concentrations of UDP (0, 15 and 50 μM) and varied lipid I analog 3 (25−400 μM). The data were fit to Equation 4 for noncompetitive inhibition.
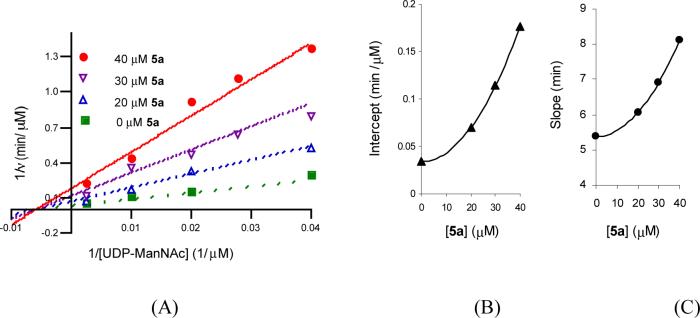
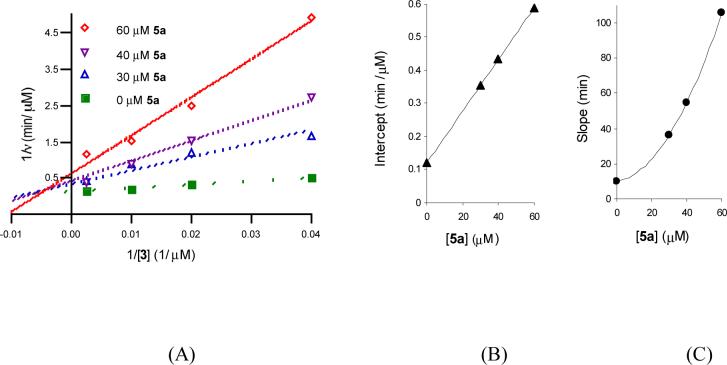
To look at inhibition of TagA by 5a, reaction rates were determined using the HPLC assay. For inhibition with respect to UDP-ManNAc, [3] was held at 200 μM, and 5a and UDP-ManNAc were added at the concentrations indicated in Figure 7A. For inhibition with respect to 3, [UDP-ManNAc] was held at 100 μM, and 5a and 3 were added at the concentrations indicated in Figure 8A. 5a was added to the reactions in 1:1 MeOH:DMSO.
Figure 7.
(A) Product inhibition by lipid II analog 5a vs. UDP-ManNAc. Initial rates were measured at 52 nM TagA and 200 μM 3 in the presence of several fixed concentrations of lipid II analog 5a (0, 20, 30 and 40 μM) and varied UDP-ManNAc (25− 400 μM). The data were fit to Equation 5 for I-parabolic S-parabolic noncompetitive inhibition. (B) Secondary plot of intercept vs. [5a]. (C) Secondary plot of intercept slope vs. [5a].
Figure 8.
(A) Product inhibition by lipid II analog 5a vs. 3. Initial rates were measured at 52 nM TagA and 100 μM UDP-ManNAc in the presence of several fixed concentrations of 5a (0, 30, 40 and 60 μM) and varied 3 (25− 400 μM). The data were fit to Equation 6 for I-linear S-parabolic noncompetitive inhibition. (B) Secondary plot of intercept vs. [5a]. (C) Secondary plot of intercept slope vs. [5a].
Data processing
Initial rate data from the kinetic studies described were plotted as 1/(initial velocity) vs. 1/(substrate concentration). The data were fit to the appropriate rate equations using the program Prism 4.0 (GraphPad software). Km and kcat values were determined by fitting the initial rates to the Michaelis-Menten equation 1. Data conforming to a sequential mechanism were fit to Eq. 2. Data for competitive inhibition, noncompetitive inhibition, I-parabolic S-parabolic noncompetitive inhibition and I-linear S-parabolic noncompetitive inhibition were fit to Eqs. 3, 4, 5 and 6, respectively.
| (1) |
| (2) |
| (3) |
| (4) |
| (5) |
| (6) |
In Eqs. 1-6, A and B are the concentrations of the reactants, I is the concentration of inhibitor, v and V represent initial and maximum velocities, respectively, Ka and Kb are Michaelis constants for A and B, Kia is the inhibition constant for substrate A, and Kis and Kii are the inhibition constants for the slope and the intercept, respectively.
Results
Conditions for Optimal Activity of TagA
Preliminary experiments were carried out to determine suitable conditions for studying the kinetics of TagA. TagA showed optimal activity at pH 7.8 in Bis-Tris propane buffer (see Supporting Information), and the enzymatic activity proved to be sensitive to NaCl concentration, with the highest activity observed at 250 mM (Figure 3A). Because many enzymes that bind dinucleotide substrates require divalent, oxophilic cations such as Mg2+ or Mn2+, we also examined the effects of these metal ions on the activity of TagA. Activity does not improve with the addition of Mg2+ or Mn2+ at concentrations up to 30 mM, and does not decrease with the addition of EDTA (Figure 3). Therefore, TagA does not require Mg2+ or Mn2+ cations for activity.
Figure 3.
Effect of increasing concentrations of NaCl (A), Mn2+ (■) and Mg2+ (▲) ions (B) and EDTA (C) on TagA activity. Assays were carried out at 100 μM UDP-ManNAc, 100 μM lipid I analog 1 and100 nM TagA.
Evaluation of Lipid I Analogs
The natural acceptor substrate for TagA contains a 55 carbon undecaprenyl chain. This substrate is difficult to isolate from bacterial membranes, and the undecaprenyl chain renders it insoluble in aqueous buffer, complicating kinetic studies of TagA activity. We previously demonstrated that TagA is able to utilize a synthetic substrate (1) containing a 13 carbon saturated chain (15). Here we investigate several additional substrate analogs to determine how sensitive TagA is to the structure of the lipid chain, and to identify better substrates, if possible, for monitoring enzymatic activity. To this end, we synthesized lipid I analogs 2−5 (Figure 4), containing lipids of varying length and double-bond geometry (15-17). Compounds 2, 3 and 5 contain cis double bonds like the natural substrate, but vary in length from 10 to 20 carbons. Compound 4, like compound 5, contains 20 carbons, but the double bonds are trans.
Preliminary studies showed that TagA converts all of these lipid I analogs to products, so we determined the kinetic parameters for each acceptor using a HPLC assay that monitors formation of UDP to determine the reaction rate. To ensure that UDP production was the result of glycosyltranfer rather than hydrolysis, we first incubated UDP-ManNAc with TagA for 4 hours in the absence of the acceptor. No UDP formation was detected by HPLC. We then determined the kinetic parameters of 1 at 600 μM UDP-ManNAc using the HPLC assay and LC/MS assay that directly monitors formation of the glycosylated lipid II product (see below and Materials and Methods for details). The values of Km, app and kcat obtained for 1 using both assays were almost identical. These results show that UDP formation correlates directly with glycosyltransfer (see Supporting Information) and suggest that hydrolysis of the glycosyl donor does not occur to a significant extent in either the presence or absence of glycosyl acceptors.
Having established that validity of the HPLC assay for reporting on glycosyltransfer, we used it to measure the catalytic efficiencies of substrates 1 − 5 at 600 μM UDP-ManNAc. Substrates 4 and 5 showed substrate inhibition at concentrations above 100 and 300 μM, respectively, and only the initial rates of 1, 2, 3 and 5 could be fit to the Michaelis-Menten equation (see Supporting Information). The Km, app and kcat of 4 are crude estimates based on the first part of the reaction rate curve. The results (Table 1) show that 4 and 5, which both contain 20 carbon lipid chains, have the lowest Kms, and that the turnover numbers are similar for all substrates except 2, which turns over 10-fold more slowly than the others. Taken together, these data indicate that TagA is sensitive to lipid length/hydrophobicity, but not sensitive to lipid structure (branched or unbranched; saturated or unsaturated), or double bond geometry.
Table 1.
Apparent Km and kcat of lipid I analogs at 600 μM UDP-ManNAc.
| Lipid I analog | Km (μM) | kcat (min−1) | kcat/Km (min−1μM−1) |
|---|---|---|---|
| 1 | 193 ± 34 | 551 | 2.85 |
| 2 | 258 ± 49 | 52 | 0.20 |
| 3 | 227 ± 10 | 835 | 3.67 |
| 41,2 | 30 | 615 | 20.50 |
| 52 | 35 ± 4 | 517 | 14.77 |
Due to substrate inhibition above 100 μM, the Km, app of 4 is estimated as the substrate concentration at 1/2 × highest observed rate.
The substrate range lower limit for 4 and 5 (25 μM) is close to the calculated Kms, and the reported values may thus be underestimates. This does not affect the validity of the conclusions.
Selection of Substrate for Kinetic Studies
The substrate comparison described above shows that compound 5 is preferred to 1, 2 and 3. Nevertheless, initial attempts to use 5 for more detailed kinetic studies of TagA were hampered by substrate inhibition at concentrations above 300 μM. To determine if substrate inhibition correlates with aggregation, we measured the critical micelle concentrations (CMCs) of 4 and 5, which both show substrate inhibition, and of 1, which shows no obvious inhibition at the concentrations tested. CMCs were determined using dye-binding (18) and surface tension (drop weight) methods (data not shown) (19, 20). None of the substrates formed micelles in the reaction buffer up to 600 μM, the highest concentration tested. We have concluded that none of the substrates aggregate at the concentrations used, and that the observed substrate inhibition is a result of inhibitory interactions of these substrates with TagA. To enable kinetic studies of the enzyme over a broad range of substrate concentrations, we decided to use compound 3 as the acceptor substrate because it shows no inhibition at the working concentrations.
Initial Rate Analysis for TagA
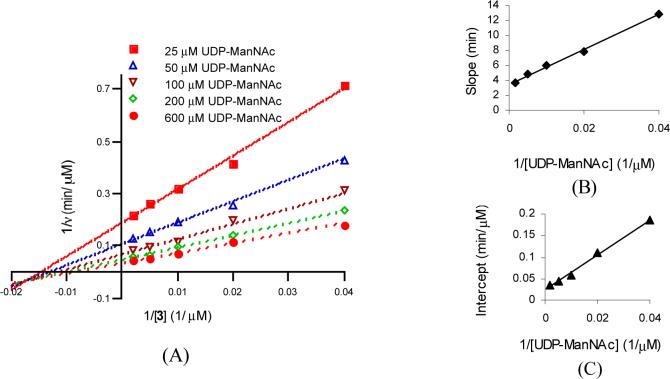
Having identified an appropriate acceptor substrate and conditions for kinetic studies of TagA, we carried out initial velocity measurements to determine whether the enzyme follows a sequential or a ping-pong kinetic mechanism. A 5×5 matrix of reactions was carried out, with UDP-ManNAc and lipid I analog 3 at varying concentrations. To determine the reaction rate, formation of UDP was monitored by HPLC. Double reciprocal plots of the initial rate data are shown in Figure 5A. The lines in the double reciprocal plots converge, implying that the enzyme utilizes a sequential mechanism in which both substrates bind prior to product release. The slope replot does not pass through the origin, indicating that the mechanism is not a rapid equilibrium ordered mechanism (Figure 5B). Kinetic parameters for TagA based on the initial rate measurements were obtained by fitting the data to the appropriate rate equation after establishing the kinetic mechanism, as described below.
Figure 5.
(A) Double reciprocal plots of the initial velocity data with respect to 3 as the varied substrate. Initial velocities were measured at the indicated fixed UDP-ManNAc concentrations. Assays were carried out with [UDP-ManNAc] at 25−600 μM, [3] at 25−500 μM and 52 nM TagA. The data were fit to Equation 2. (B) Secondary plot of slope vs. 1/[UDP-ManNAc]. (C) Secondary plot of intercept vs. 1/[UDP-ManNAc].
Product Inhibition Analysis
To understand sequential enzymes, it is important to know whether the substrates bind in a compulsory order and, if so, to determine which substrate binds first. Information on substrate binding order provides insight into the catalytic mechanism, can influence the design of high-throughput screens (21), and can facilitate efforts to obtain co-crystals with substrate bound (22). Product inhibitors yield distinct inhibition patterns depending on the kinetic mechanism of an enzyme, and can be used to elucidate the order of substrate binding (see Supporting Information).
To carry out a product inhibition analysis using UDP, we needed an assay that does not rely on detection of UDP. Therefore, we used an LC/MS assay to monitor formation of the other product, lipid II. This assay was adapted from a broadly applicable ESI-MS assay developed by Leary and coworkers, which has been used for kinetic analysis and substrate specificity evaluation of several enzymes, including glutathione-S-transferase (23), hexokinase (24), phosphoglucomutase (25), and NodH sulfotransferase (26, 27). A similar ESI-MS assay was developed by Pohl and coworkers for kinetic analysis of nucleotidyltransferases (28). Ionization can vary from sample to sample, so for accurate product quantitation each sample is doped with an internal standard. We used 4 as an internal standard and to construct a calibration curve for product quantitation. With UDP as a product inhibitor, a competitive inhibition pattern with respect to UDP-ManNAc (Figure 6A) and a non-competitive inhibition pattern (Figure 6B) with respect to the acceptor 3 were obtained at nonsaturating levels of the fixed substrate. This inhibition pattern ruled out a steady-state ordered Bi Bi mechanism in which the acceptor binds first, but left several other possibilities (see Supporting Information). To distinguish between these possibilities, we next evaluated the inhibition patterns obtained using lipid II analogs as product inhibitors.
Preliminary experiments showed that the IC50 value of lipid II analog 3a (Figure 4) was higher than 1 mM when 3 was used as the acceptor (data not shown). By comparison, the IC50 value of lipid II analog 5a (Figure 4) with respect to 3 was ∼15 μM (data not shown). Therefore, product inhibition experiments were performed using the 3/5a acceptor/product pair. Reactions were monitored using the HPLC assay, which detects the formation of UDP. Product 5a proved to be an I-parabolic, S-parabolic noncompetitive inhibitor with respect to UDP-ManNAc (Figure 7A) and an I-linear, S-parabolicnoncompetitive inhibitor (Figure 8A) with respect to the acceptor 3 at nonsaturating levels. These inhibition patterns are consistent with an ordered Bi Bi mechanism in which the UDP-ManNAc donor binds first and the UDP product is released last (see Supporting Information).
The nonlinear noncompetitive patterns suggest that the product 5a may exist in more than one enzymatic complex. Given that substrate inhibition was observed when 5 was the acceptor, and that 5 and 5a are similar in structure, we propose that there are two dead-end complexes, TagA. Lipid II (EP) and TagA. UDP-ManNAc. Lipid II (EAP), involved in the reaction mechanism (Scheme 1). The denominator terms multiplied by (1 + P/Ki) and (1 + P/Kii) correspond to the relative concentrations of TagA (E) and the TagA. UDP-ManNAc (EA) complex, respectively. Consequently, the initial rate equation in the presence of P for the ordered Bi Bi mechanism is
or, in the reciprocal forms:
| (7) |
| (8) |
Scheme 1.
Steady-state ordered Bi Bi mechanism with two dead-end complexes.
A and B are reactant concentrations and P is the product concentration; v and V represent initial and maximum velocities, respectively; Ka, Kb, Kp and Kq are Michaelis constants for A, B, P and Q; Kia, Kip, and Kiq are inhibition constants for A, P, and Q; Ki and Kii are the dissociation constants of the product from the dead-end TagA. Lipid II (EP) and TagA. UDP-ManNAc. Lipid II (EAP) complexes, respectively.
When A (UDP-ManNAc) is varied, the resulting P2 term appears in the Intercept1/A and Slope1/A functions, consistent with the I-parabolic, S-parabolic noncompetitive pattern (Figure 7B and 7C); when B (lipid I) is the varied substrate, the resulting P2 term only appears in the Slope1/B function, in agreement with the I-linear, S-parabolic noncompetitive pattern (Figure 8B and 8C).
Taken together, these data imply an ordered Bi Bi mechanism where UDP-ManNAc binds first and UDP is released last. To obtain the kinetic parameters for the enzyme, the initial rate data from the 5×5 matrix described earlier were fit to equation 8 for the determined mechanism. Since initial rate data were used, the product terms in the equation were set to 0. This fit yielded the following values: kcat = 735 ± 129 min−1, Ka = 154.2 ± 33.9 μM, Kb = 133.1 ± 30.2 μM, and Kia = 67.2 ± 6.9 μM (A = UDP-ManNAc; B = lipid I analog 3).
Discussion
TagA is involved in a biosynthetic pathway that is a potential target for antimicrobial intervention. Previous mechanistic studies of this enzyme have been hampered by the fact that the natural acceptor for the enzyme contains a 55 carbon undecaprenyl chain. This substrate is anchored in the bacterial membrane, and TagA is believed to be peripherally associated with the membrane. We have previously demonstrated, however, that TagA is active following purification away from bacterial membranes and accepts an artificial substrate containing a short lipid chain. Here, we have expanded on our earlier work, exploring the extent to which TagA recognizes features of the natural lipid chain. Our results show that TagA is moderately sensitive to the length of the lipid, but not sensitive to its structure. Thus, the catalytic efficiencies of substrates of equivalent length are almost identical, regardless of unsaturation, branching, or double bond geometry. The demonstrated insensitivity of TagA even to features of the lipid close to the diphosphate linkage at the reducing end of the substrate is consistent with early reports showing that enzymes in the tag pathway are able to utilize substrates containing dolichol rather than undecaprenyl chains (6).
We report here that the examined substrates containing the longest lipid chains (4 and 5) have the highest catalytic efficiencies, showing that lipid length is an important variable in activity. These substrates, however, also display substrate inhibition. We measured the CMCs (critical micelle concentrations) of the substrates in order to determine whether their high catalytic efficiencies or their inhibitory behavior could be attributed to the formation of micellar aggregates. Our results show that these substrates do not form micelles at concentrations up to 600 μM, well above the concentrations at which substrate inhibition is observed. Previously reported data are consistent with our findings, showing that the CMCs of related compounds are in the mM range (29). Therefore, neither the catalytic efficiencies nor the inhibitory behavior of these substrates result from aggregation. Since the increased catalytic efficiencies of 4 and 5 relative to 2 and 3 are largely due to a decrease in Km values, we have concluded that the tetraprenyl substrates are more efficient than shorter chain substrates because the longer lipids make more favorable hydrophobic interactions with TagA.
The severe substrate inhibition observed with the longer chain substrates may arise because there is a structural resemblance between the acceptor and the donor. That is, the acceptor contains a diphospho-GlcNAc moiety whereas the donor contains a diphospho-ManNAc moiety. The synthetic acceptors with the longer lipid chains may be able to establish sufficiently favorable hydrophobic interactions that they bind stably in the donor site. Consistent with this hypothesis, we have found that inhibition by these acceptor substrates is dependent on the donor sugar concentration (data not shown).
Based on information about the behavior of the different artificial substrates, we selected a substrate/product pair with suitable properties for a kinetic analysis. Using a product inhibition analysis, we have shown that TagA uses an ordered Bi Bi mechanism in which UDP-ManNAc binds first and UDP is released last. The turnover number for the enzyme, obtained from a 5 × 5 matrix of reactions, was found to be 735 min−1, which is relatively fast and consistent with the function of this enzyme in a primary metabolic pathway. The Km for UDP-ManNAc is also reasonable given estimated concentrations of this substrate in cells. We do not think it is possible to draw any conclusions about the Km of the natural acceptor substrate from the Km measured for the synthetic substrates used in these studies because of the differences in presentation – that is, the natural substrate is anchored in a membrane while the synthetic analogs are not. Nevertheless, these studies have conclusively established that TagA does not require biological membranes or a micellar interface to function well. They have also provided information on acceptor substrates that may be useful tools in further kinetic studies of TagA. It should be possible, for example, to use these substrates to analyze mutants of TagA to probe the roles of various amino acids. Finally, we note that information on the kinetic mechanism of TagA should simplify efforts to obtain crystals of the enzyme with substrates bound, and may also influence the design of high throughput assays for inhibitors.
We note in closing that the glycosylation reaction catalyzed by TagA — the transfer of a sugar from a nucleotide sugar donor to a lipid-linked monosaccharide acceptor — is not unique. Analogous reactions are performed by many enzymes, including other CAZy family 26 members as well as the second enzyme in the eukaryotic dolichol pathway for N-linked glycosylation (30) and MurG (14, 22, 31), which is involved in the biosynthesis of peptidoglycan. MurG and the second enzyme in the dolichol pathway are members of the GT-B superfamily of glycosyltransferases (11-14), which consist of two Rossmann domains, one containing a signature nucleotide-binding motif. TagA does not appear to belong to the GT-B superfamily because it is substantially shorter than these enzymes and lacks the nucleotide binding motif. It also bears little resemblance to characterized enzymes of the GT-A superfamily, the other major glycosyltransferase fold family. These enzymes have an absolute requirement for a Mg2+ or Mn2+ cation, which chelates the nucleotide-sugar in the active site. Although TagA is predicted to be an α/β protein like the GT-A superfamily members, threading analysis suggests that it does not have the same fold (11), and the experiments reported here show that it does not require metal ions for activity. TagA and its relatives in CAZy family 26 (8) may represent a new fold variant, and the studies reported here suggest that TagA is a particularly promising model system for understanding CAZy family 26. Efforts to crystallize TagA are currently underway.
Supplementary Material
Acknowledgment
We thank Dr. David Rudner for providing purified B. subtilis PY79 genomic DNA.
Abbreviations
- WTA
wall teichoic acid
- Gtf
glycosyltransferase
- Gro-P
glycerol phosphate
- Rbo-P
ribitol phosphate
- GlcNAc
N-acetyl glucosamine
- ManNAc
N-acetyl mannosamine
- PP
pyrophosphate
- Lipid I
GlcNAc-pp-undecaprenyl
- Lipid II
ManNAc-GlcNAc-pp-undecaprenyl
Footnotes
This work was partially supported by NIH Grant A144854.
Supporting Information Available. Michaelis-Menten plots of 1−5, the effect of pH and DMSO on TagA activity and Table of expected product inhibition patterns for selected ordered and random Bi Bi kinetic mechanisms. This material is available free of charge via the Internet at http://pubs.acs.org.
References
- 1.Neuhaus FC, Baddiley J. A continuum of anionic charge: structures and functions of D-alanyl-teichoic acids in Gram-positive bacteria. Microbiol. Mol. Biol. Rev. 2003;67:686–723. doi: 10.1128/MMBR.67.4.686-723.2003. [DOI] [PMC free article] [PubMed] [Google Scholar]
- 2.Bhavsar AP, Erdman LK, Schertzer JW, Brown ED. Teichoic acid is an essential polymer in Bacillus subtilis that is functionally distinct from teichuronic acid. J. Bacteriol. 2004;186:7865–7873. doi: 10.1128/JB.186.23.7865-7873.2004. [DOI] [PMC free article] [PubMed] [Google Scholar]
- 3.Kobayashi K, Ehrlich SD, Albertini A, Amati G, Andersen KK, Arnaud M, Asai K, Ashikaga S, Aymerich S, Bessieres P, et al. Essential Bacillus subtilis genes. Proc. Natl. Acad. Sci. U. S. A. 2003;100:4678–4683. doi: 10.1073/pnas.0730515100. [DOI] [PMC free article] [PubMed] [Google Scholar]
- 4.Weidenmaier C, Peschel A, Xiong YQ, Kristian SA, Dietz K, Yeaman MR, Bayer AS. Lack of wall teichoic acids in Staphylococcus aureus leads to reduced interactions with endothelial cells and to attenuated virulence in a rabbit model of endocarditis. J. Infect. Dis. 2005;191:1771–1777. doi: 10.1086/429692. [DOI] [PubMed] [Google Scholar]
- 5.Weidenmaier C, Kokai-Kun JF, Kristian SA, Chanturiya T, Kalbacher H, Gross M, Nicholson G, Neumeister B, Mond JJ, Peschel A. Role of teichoic acids in Staphylococcus aureus nasal colonization, a major risk factor in nosocomial infections. Nat. Med. 2004;10:243–245. doi: 10.1038/nm991. [DOI] [PubMed] [Google Scholar]
- 6.Yokoyama K, Mizuguchi H, Araki Y, Kaya S, Ito E. Biosynthesis of linkage units for teichoic acids in Gram-positive bacteria: distribution of related enzymes and their specificities for UDP-sugars and lipid-linked intermediates. J. Bacteriol. 1989;171:940–946. doi: 10.1128/jb.171.2.940-946.1989. [DOI] [PMC free article] [PubMed] [Google Scholar]
- 7.Soldo B, Lazarevic V, Karamata D. TagO is involved in the synthesis of all anionic cell-wall polymers in Bacillus subtilis 168. Microbiology. 2002;148(Pt 7):2079–2087. doi: 10.1099/00221287-148-7-2079. [DOI] [PubMed] [Google Scholar]
- 8.Coutinho PM, Henrissat B. Carbohydrate-Active Enzymes server. http://www.cazy.org.
- 9.Erbel PJ, Barr K, Gao N, Gerwig GJ, Rick PD, Gardner KH. Identification and biosynthesis of cyclic enterobacterial common antigen in Escherichia coli. J. Bacteriol. 2003;185:1995–2004. doi: 10.1128/JB.185.6.1995-2004.2003. [DOI] [PMC free article] [PubMed] [Google Scholar]
- 10.Haft RF, Wessels MR, Mebane MF, Conaty N, Rubens CE. Characterization of cpsF and its product CMP-N-acetylneuraminic acid synthetase, a group B streptococcal enzyme that can function in K1 capsular polysaccharide biosynthesis in Escherichia coli. Mol. Microbiol. 1996;19:555–563. doi: 10.1046/j.1365-2958.1996.395931.x. [DOI] [PubMed] [Google Scholar]
- 11.Breton C, Snajdrova L, Jeanneau C, Koca J, Imberty A. Structures and mechanisms of glycosyltransferases. Glycobiology. 2006;16:29R–37R. doi: 10.1093/glycob/cwj016. [DOI] [PubMed] [Google Scholar]
- 12.Rosen ML, Edman M, Sjostrom M, Wieslander A. Recognition of fold and sugar linkage for glycosyltransferases by multivariate sequence analysis. J Biol. Chem. 2004;279:38683–38692. doi: 10.1074/jbc.M402925200. [DOI] [PubMed] [Google Scholar]
- 13.Ünligil UM, Rini JM. Glycosyltransferases structure and mechanism. Curr. Opin. Struct. Biol. 2000;1:510–517. doi: 10.1016/s0959-440x(00)00124-x. [DOI] [PubMed] [Google Scholar]
- 14.Hu Y, Walker S. Remarkable structural similarities between diverse glycosyltransferases. Chem. Biol. 2002;9:1287–1296. doi: 10.1016/s1074-5521(02)00295-8. [DOI] [PubMed] [Google Scholar]
- 15.Ginsberg C, Zhang Y-H, Yuan Y, Walker S. In vitro reconstitution of two essential steps in wall teichoic acid biosynthesis using synthetic substrate analogs. ACS Chemical Biology. 2006;1:25–28. doi: 10.1021/cb0500041. [DOI] [PubMed] [Google Scholar]
- 16.Zahn TJ, Whitney J, Weinbaum C, Gibbs RA. Synthesis and evaluation of GGPP geometric isomers: divergent substrate specificities of FTase and GGTase I. Bioorg. Med. Chem. Lett. 2001;11:1605–1608. doi: 10.1016/s0960-894x(01)00292-x. [DOI] [PubMed] [Google Scholar]
- 17.Xie H, Shao Y, Becker JM, Naider F, Gibbs RA. Synthesis and biological evaluation of the geometric farnesylated analogs of the a-factor mating peptide of Saccharomyces cerevisiae. J. Org. Chem. 2000;65:8552–8563. doi: 10.1021/jo000942m. [DOI] [PubMed] [Google Scholar]
- 18.Ananthapadmanabhan KP, Goddard ED, Turro NJ, Kuo PL. Fluorescence probes for critical micelle concentration. Langmuir. 1985;1:352–355. doi: 10.1021/la00063a015. [DOI] [PubMed] [Google Scholar]
- 19.Yildirim OE, Xu Q, Basaran OA. Analysis of the drop weight method. Phys. Fluid. 2005;17:062107/1–062107/13. [Google Scholar]
- 20.Jho C, Burke RJ. Drop weight technique for the measurement of dynamic surface tension. J. Colloid Interface Sci. 1983;95:61–71. [Google Scholar]
- 21.Helm JS, Hu Y, Chen L, Gross B, Walker S. Identification of active-site inhibitors of MurG using a generalizable, high-throughput glycosyltransferase screen. J. Am. Chem. Soc. 2003;125:11168–11169. doi: 10.1021/ja036494s. [DOI] [PubMed] [Google Scholar]
- 22.Hu Y, Chen L, Ha S, Gross B, Falcone B, Walker D, Mokhtarzadeh M, Walker S. Crystal structure of the MurG:UDP-GlcNAc complex reveals common structural principles of a superfamily of glycosyltransferases. Proc. Natl. Acad. Sci. U.S.A. 2003;100:845–849. doi: 10.1073/pnas.0235749100. [DOI] [PMC free article] [PubMed] [Google Scholar]
- 23.Ge X, Sirich TL, Beyer MK, Desaire H, Leary JA. A strategy for the determination of enzyme kinetics using electrospray ionization with an ion trap mass spectrometer. Anal. Chem. 2001;73:5078–5082. doi: 10.1021/ac0105890. [DOI] [PubMed] [Google Scholar]
- 24.Gao H, Leary JA. Multiplex inhibitor screening and kinetic constant determinations for yeast hexokinase using mass spectrometry based assays. J. Am. Soc. Mass Spectrom. 2003;14:173–181. doi: 10.1016/S1044-0305(02)00867-X. [DOI] [PubMed] [Google Scholar]
- 25.Gao H, Leary JA. Kinetic measurements of phosphoglucomutase by direct analysis of glucose-1-phosphate and glucose-6-phosphate using ion/molecule reactions and Fourier transform ion cyclotron resonance mass spectrometry. Anal. Biochem. 2004;329:269–275. doi: 10.1016/j.ab.2004.03.011. [DOI] [PubMed] [Google Scholar]
- 26.Pi N, Armstrong JI, Bertozzi CR, Leary JA. Kinetic analysis of NodST sulfotransferase using an electrospray ionization mass spectrometry assay. Biochemistry. 2002;41:13283–13288. doi: 10.1021/bi020457g. [DOI] [PubMed] [Google Scholar]
- 27.Pi N, Yu Y, Mougous JD, Leary JA. Observation of a hybrid random ping-pong mechanism of catalysis for NodST: a mass spectrometry approach. Protein Sci. 2004;13:903–912. doi: 10.1110/ps.03581904. [DOI] [PMC free article] [PubMed] [Google Scholar]
- 28.Zea CJ, Pohl NL. General assay for sugar nucleotidyltransferases using electrospray ionization mass spectrometry. Anal. Biochem. 2004;328:196–202. doi: 10.1016/j.ab.2004.01.019. [DOI] [PubMed] [Google Scholar]
- 29.Visscher I. Ph. D thesis. Amphiphiles containing aromatic groups in the hydrophobic part. 2004:21–33. chapter 2. http://irs.ub.rug.nl/ppn/269298355.
- 30.Chantret I, Dancourt J, Barbat A, Moore SE. Two proteins homologous to the N- and C-terminal domains of the bacterial glycosyltransferase MurG are required for the second step of dolichyl-linked oligosaccharide synthesis in Saccharomyces cerevisiae. J. Biol. Chem. 2005;280:9236–9242. doi: 10.1074/jbc.M413941200. [DOI] [PubMed] [Google Scholar]
- 31.Ha S, Walker D, Shi Y, Walker S. The 1.9 Å crystal structure of Escherichia coli MurG, a membrane-associated glycosyltransferase involved in peptidoglycan biosynthesis. Protein Sci. 2000;9:1045–1052. doi: 10.1110/ps.9.6.1045. [DOI] [PMC free article] [PubMed] [Google Scholar]
Associated Data
This section collects any data citations, data availability statements, or supplementary materials included in this article.


