

Abstract
Most adult tissues consist of stem cells, progenitors, and mature cells, and this hierarchical architecture may play an important role in the multistep process of carcinogenesis. Here, we develop and discuss the important predictions of a simple mathematical model of cancer initiation and early progression within a hierarchically structured tissue. This work presents a model that incorporates both the sequential acquisition of phenotype altering mutations and tissue hierarchy. The model simulates the progressive effect of accumulating mutations that lead to an increase in fitness or the induction of genetic instability. A novel aspect of the model is that symmetric self-renewal, asymmetric division, and differentiation are all incorporated, and this enables the quantitative study of the effect of mutations that deregulate the normal, homeostatic stem cell division pattern. The model is also capable of predicting changes in both tissue composition and in the progression of cells along their lineage at any given time and for various sequences of mutations. Simulations predict that the specific order in which mutations are acquired is crucial for determining the pace of cancer development. Interestingly, we find that the importance of genetic stability differs significantly depending on the physiological expression of mutations related to symmetric self-renewal and differentiation of stem and progenitor cells. In particular, mutations that lead to the alteration of the stem cell division pattern or the acquisition of some degree of immortality in committed progenitors lead to an early onset of cancer and diminish the impact of genetic instability.
Introduction
It is widely accepted that tumorigenesis is a multistep process, the progression of which depends on a sequential accumulation of mutations within tissue cells. Although tumor cells often exhibit a large number of mutations [1,2], only a relatively small subset is crucial for neoplastic development [2–6]. These mutations result in violation of tissue homeostasis as the transformed cells gain fitness by increasing their proliferation rate, decreasing their death rate, and creating a growth-promoting environment. The variety of genetic alterations observed in tumors suggests that genetic instability is a characteristic of many cancers [7,8]. The process of acquiring genetic mutations and the role of genetic instability in tumorigenesis have received a great deal of attention in the cancer modeling community and have been studied using both deterministic and stochastic approaches [9–25]. Spencer et al. [16], for example, used a deterministic model to study carcinogenesis within a homogeneous population of cells. They predicted that the pace of cancer development depends on the particular ordering of mutations and that the fastest pathways to cancer were those for which genetic instability was the last mutation acquired. Conversely, Beckman and Loeb [20], who also used a deterministic mathematical model to calculate the probabilities of cancer occurrence for pathways that did or did not include mutator mutations, found that these types of mutations have the most influence when they occur as an initial step in carcinogenesis. The relative importance of processes such as selection and clonal expansion versus genetic instability has been addressed in numerous modeling studies, mostly in the context of colorectal carcinogenesis. Some of the models, both deterministic and stochastic, have lead to the conclusion that genetic instability is not necessary to explain the large number of mutations found in tumors [21,24], whereas others noticed the importance of genomic instability as a driver of cancer formation [22,23].
Experimental evidence shows that only a small fraction of tumor cells are actually capable of tumor initiation [26–28]. Studies suggest that cancers originate from stem cells or cells that have gained stem cell properties. These tumorigenic cells, cancer stem cells, are believed to be the driving force in tumor progression and a possible cause of tumor heterogeneity [26,27]. Adult stem cells are present in many tissues, and although their number is relatively small, they persist for long periods, in some cases, throughout the entire lifetime of an individual. Given that carcinogenesis requires acquisition of multiple mutations during a long period, stem cells are reasonable candidates for the accumulation of mutations that results in a malignant transformation. In addition to their long life span, stem cells are able to generate full lineages of differentiated cells, thereby perpetuating mutations through uncontrolled clonal expansion. Since the identification of cancer stem cells in hematopoietic malignancies [29,30], cancer stem cells have been found in a variety of cancers [31–36]. It is believed that cancer stem cells may arise from mutations in normal stem cells, or in some cases, such as blast crisis associated with chronic myeloid leukemia (CML) [37], mutations might cause restricted progenitors to acquire properties of cancer stem cells, particularly the ability to limitlessly self-renew, leading to a rapid outbreak of aggressive cellular growth.
The cancer stem cell hypothesis has enormous implications for cancer therapeutics. Current treatments target the rapidly dividing differentiating cells that comprise the major bulk of tumors, often leading to significant reduction in tumor size. However, even if treatment seems successful, a single cancer stem cell that survives therapy may drive tumor recurrence [38]. Being a crucial factor in designing successful treatment, the need to understand the deregulated mechanisms that alter the homeostatic pattern of divisions in stem cells is a strong motivation to include cellular hierarchy in computational models of tumorigenesis.
Numerous modeling studies have considered hierarchical tissue architecture in the context of cancer development [39–48]. It has been shown that hierarchical tissue design, in which a small population of stem cells maintains mature cells through a transient population of differentiating cells, may reduce the accumulation of hazardous mutations [39–42]. In addition, certain aspects of the cancer stem cell hypothesis have been addressed using both stochastic and deterministic approaches. For example, Dingli et al. [44] used a stochastic model to study evolutionary paths of cancer stem cells and demonstrated that stochastic effects within a small population of cycling stem cells may influence the dynamics of cancer evolution in different manners by inducing a wide variability in the dynamics of the mutated clone. Ganguly and Puri [45] proposed a predictive, multicompartment model to study the effect of the cancer stem cell hypothesis in the neural system. Their model verifies that the mutations in the stem cell compartment are more significant for cancer development; however, similarly to Dingli's stochastic model, only normal and cancerous cells are considered, without including any intermediate stage cellular mutations; therefore, the progressive phenotypical changes in cells owing to sequentially acquired mutations and their associated dynamics are not discussed.
The various models of cancer development that have appeared in the literature so far have led to a deeper understanding of the different biological aspects of tumorigenesis by focusing on a particular aspect of tumor growth. Some have modeled carcinogenesis as a multistep process of mutation acquisition within a homogeneous cell population, others studied the consequence of hierarchy in tissues; however, to our knowledge, the sequential acquisition of phenotype altering mutations in hierarchical population of cells has only been considered in few works, such as that of Bankhead et al. [47] who have used a computational model based on the Genetic Cellular Automata to compare genetic heterogeneity of mutated populations of cells assuming different internal hierarchies. In the present work, we consider the simplest hierarchy to study propagation of somatic mutations in stem cells and progenitors and their effect on the pace of carcinogenesis. We propose a simple mathematical framework that brings together the various aspects of the current understanding of tumorigenesis into a comprehensive model that accounts for the development and dynamics of transformed cells. The basic model may be extended to include different phenotypic alterations in cells as well as intercellular population and cell-environment interactions. An example of one possible extension for the case of immortal progenitors is discussed in this paper.
This work marks the first time that all possible modes of stem cell divisions (Figure 1B), symmetric and asymmetric [47], have been included and dynamically modeled. This enables a quantitative study (within the limits of model assumptions) of the deregulation of stem cell division modes and its potential to result in neoplastic growth. We note that Dingli et al. [46] studied the impact of various stem cell division modes on the growth dynamics of a mutant stem cell population; however, they assumed that the stem cell pool remains constant in size and used a stochastic Moran process to describe the dynamics of the stem cell pool (comprised of normal and mutated stem cells). Although capturing the stochastic nature of mutation acquisition, this type of model is not capable of describing mutations that lead to the change of stem cell division pattern that results in possible expansion of the stem cell pool, which in turn leads to tumor growth.
Figure 1.

The model's basic components. (A) Mutations: Schematic view of the multistep process of mutation acquisition. (B) Stem cell division modes: symmetric self-renewal division results in two daughter stem cells, asymmetric self-renewal division results in one stem cell and one progenitor cell, and symmetric differentiation division results in two progenitor cells.
In this article, we consider the multistage process of mutation acquisition within a tissue comprised of stem cells that give rise to progenitor cells, which in turn divide and differentiate into mature functioning cells. We assume that all cells divide at the same average rate and do not include explicitly quiescent stem cells [48]. We only consider somatic mutations and, at the present model, ignore environmental effects [49–51]. In particular, we assume that the deregulation of stem cell division occurs because of a somatic mutation in stem cells rather than because of environmental changes. In our model, the change in the division pattern of mutated stem cells may be a direct result of a mutated division mechanism or may be caused by ignored environmental signaling. Using a simple mathematical model, we explore the effects of a variety of somatic mutations in stem cells and their progeny. In particular, we address some of the very different findings regarding genetic instability that have appeared in the literature. The model is general enough to study both advantageous and deleterious mutations. Within the proposed framework, we have incorporated mutations that affect proliferation, death, and mutation rates as well as division and differentiation patterns. Therefore, we have been able to explore the effects of differences in the order in which mutations are accumulated and to quantify their influence on both the pace toward cancer and on temporal changes in tissue composition during cancer development. We have shown that the cancer stem cell hypothesis arises as a natural consequence of the hierarchical structure of the model, and therefore, the model can be used to test its implications. In addition, we have investigated the effect of mutations that deregulate the division pattern in stem cells or lead to some degree of immortality in progenitor cells, both of which may be crucial for the development of aggressive cancers.
The rest of the paper is organized in three main sections. In the Materials and Methods section, we introduce the compartmental model for a normal tissue and then extend it to include mutations. The complete set of the basic model equations can be found in the Supplemental Material. Simulation results are presented in the Results section, each subsection of which focus on a different aspect of the model or its extension. In the Pathways to Cancer subsection, we consider the effect of various sequences of mutations that alter cell phenotype according to the Mutated A column in Table 1. In the Tissue Composition subsection, we point out the differences in resulting tissue composition for the different mutation sequences. The results of three alterations of the basic model are discussed in the last three subsections where we consider mutations that affect the division pattern of stem cells (Mutated B column in Table 1), mutations that lead to immortality of progenitors, and a mechanism that decreases survival of mutated cells. In the last section, these results are discussed, and some possible future extensions are suggested. The equations for the altered models and a demonstration of the compatibility of the model with the cancer stem cell hypothesis are given in the Supplemental Material.
Table 1.
Parameters Used for Simulations.
| Normal | Mutated (A) | Mutated (B) | Mutated (C) | Mutated (D) | |
|---|---|---|---|---|---|
| Stem cells | |||||
| Rate of division (per day) [59,66] | 0.0115 | 0.0207 | 0.0115 | 0.0207 | 0.0207 |
| Percentage of asymmetrically self-renewing stem cells | 80% | 80% | 60% | 80% | 80% |
| Percentage of symmetrically self-renewing stem cells | 10% | 10% | 30% | 10% | 10% |
| Percentage of symmetrically differentiating stem cells | 10% | 10% | 10% | 10% | 10% |
| Rate of death (per day) [66] 0.0001 | 0.00006 | 0.00006 | 0.00006 | 0.00006 | |
| Rate of death if protection mechanism is included (per day) | NA | NA | NA | NA | 0.1 |
| Rate of mutations* [8,16,67,68] | 0.00001 | 0.001 | 0.001 | 0.001 | 0.001 |
| Number of stem cells [61,69] | 900,000 | > | |||
| Differentiating cells | |||||
| Number of progenitor divisions [61] | 28 | 28 | 28 | 28† | 28 |
| Probability of immortality for progenitors with immortality mutation | NA | NA | NA | 0.000001 | NA |
| Division rate in progenitors (per day) | 0.5 | 3.6 | 3.6 | 3.6 | 3.6 |
| Death rate in progenitors (per day) | 0.001 | 0.0006 | 0.0006 | 0.0006 | 0.0006 |
| Rate of death if protection mechanism is included (per day) | NA | NA | NA | NA | 0.1 |
| Death rate in mature cells (per day) | 1 | 0.6 | 0.6 | 0.6 | 0.6 |
| Rate of mutations [8,16,67,68] | 0.00001 | 0.001 | 0.001 | 0.001 | 0.001 |
| Number of mature cells [61,66] | 9 x 10¹¹ | ||||
The parameters listed here have been used in the numerical simulations of the model equations. These parameters are taken mainly from the hematopoietic system because the parameters for other tissues are significantly less known. The mutated rates are shown for four cases: (A) refers to the case where R-mutation increases division rate; (B) refers to the case where R-mutation leaves proliferation rate unchanged but alters the pattern of division in stem cells while increasing proliferation rate in progenitors; (C) refers to the scenario discussed in the Immortality of Progenitors subsection; (D) refers to the case discussed in the Protection Mechanism subsection.
The mutation rate, i.e., the probability of a mutation to occur in a gene during cell division, is estimated in the literature to be 10-8 to 10-6. Because we are interested in the probability of occurrence of a mutation in one of the physiological gene categories, assuming that each is a group of approximately 100 genes, we multiply the rate for individual gene by 100. Therefore, in our simulations, we use the mutation rate of 10-5.
This number of division refers to the non-self-renewing progenitors that have not acquired the immortality mutation.
Materials and Methods
Here, a mathematical framework is developed to study carcinogenesis as a multistep process evolving within normal tissue. The tissue is modeled compartmentally by a system of ordinary differential equations that describe the coexisting cell populations with an underlying hierarchy. The cell populations differ in their proliferation potential, division, and death rates and ultimately play very different roles in cancer development.
Model for Normal Tissue
Three main types of cells constitute the normal tissue: stem cells, progenitor cells, and mature, functioning tissue cells (Figure 2A). Stem cells are characterized by their ability to self-renew and to differentiate into all cell types that are found in a specific tissue. These long-lived cells have limitless proliferation potential and can undergo three types of division [52] (Figure 1B). Symmetric renewal results in two daughter stem cells, asymmetric division results in one stem cell and one progenitor cell, leaving the number of stem cells unchanged, and symmetric differentiation gives rise to two progenitor cells. The net rate of change in the number of stem cells is determined by combining the rates of symmetric renewal, symmetric differentiation, and death (Eq. 1).
Figure 2.

Schematic representation of the mathematical model: (A) Normal tissue: stem cells self-renew and differentiate into progenitors that mature with each division until they become totally differentiated cells, lose their ability to proliferate, and die. (B) Mutation acquisition: mutations accumulate in tissue cells and are inherited by progeny (Eqs. S6–9 in the Supplemental Material).
Eq. 1.

Asymmetric division maintains a constant number of stem cells and is believed to be dominant in normal tissue homeostasis [51–55]; however, no solid evidence exists to support a preference of asymmetric over symmetric modes of division [52]. Furthermore, data suggest that most stem cells are able to switch between the different modes of division, depending on internal and external cues [51], so that the balance of stem cell numbers may be maintained by a variety of division scenarios [52]. This evidence provides strong motivation for the inclusion of all three mechanisms of division in our model. Note, however, that asymmetric division does not affect the number of stem cells and therefore does not contribute to Eq. 1.
Stem cells give rise to progenitor cells that undergo a limited number of mitotic divisions, producing the complete progeny of mature functioning cells for a particular tissue. Unlike stem cells, the population of differentiating cells goes through a maturation process, gradually losing their proliferative potential as they divide and progress toward their final fate [56]. These cells continue dividing until full differentiation is achieved; they remain in the tissue for a certain period to perform their specific function before undergoing apoptosis. Our model simulates the process of maturation of the differentiating progenitors as it occurs biologically, through division, by a set of N + 1 ordinary differential equations, where N is the maximal number of cell divisions for progenitors in the specific tissue. Each equation is a statement of balance for the number of cells in a particular generation. The number of divisions and the time required for the entire process starting from a division of a stem cell until terminal differentiation vary with tissue type.
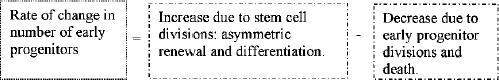
The number of the earliest progenitors is increased owing to the addition of the newly born progenitors resulting from asymmetric division and symmetric differentiation in stem cells. Whereas stem cell divisions increase this population, its size is reduced owing to progenitor division (the resulting daughter cells contribute to the next generation of progenitors) and death in this compartment. These processes are summarized in Eq. 2. Notice that each asymmetric division contributes one progenitor, whereas symmetric differentiation division contributes two.
Eq. 2.
The subsequent generations (N - 1) of transient progenitor cells are described by Eq. 3. Each generation of progenitors is increased by dividing cells in the preceding generation and decreases in size through division of its constituent cells. For any generation labeled n between 1 and N - 1, we can write:
Eq. 3.

Lastly, following similar reasoning, the rate of change in the number of fully mature, nonproliferating cells is given in Eq. 4.
Eq. 4.

For appropriate rates of proliferation and death, Eqs. 1–4 lead to homeostatic dynamics, that is, a steady state of a healthy tissue. The exact mathematical formulation of the above balance statements, together with the steady state solution, is given in Supplemental Material (Eqs. S1–5).
Model for Mutation Acquisition
We now extend the model of normal tissue homeostasis to include the process of mutation acquisition. Somatic mutations that occur in the DNA of individual cells at some time during a person's lifetime are considered. Although these changes can be caused by environmental factors such as ultraviolet radiation from the sun, we restrict our attention to those that occur when a mistake is made as DNA copies itself during cell division. Our model follows the paradigm of Hanahan and Weinberg [57], who suggest that a common feature in all cancers is that only a small number of mutations in the cell's physiology are needed for cancer to develop. Whereas these authors suggested that there are six categories of changes in cellular physiology that lead to malignancy, we consider only three, because our interest is in the pathways that initiate cancerous growth rather than in cancer progression, invasion, and metastasis.
We restrict consideration to the following classes of somatic mutations which are involved in tumorigenesis: 1) R-mutation (R) represents either a gain of function mutation in a proto-oncogene that causes the inappropriate or excess expression of proteins that control cell proliferation or a loss of function mutation to a tumor-suppressor gene that controls cell cycle checkpoints or regulates the secretion of receptor hormones that inhibit cell proliferation. Ultimately, the R-mutation leads to the deregulation of the cellular proliferation, either owing to self-sufficiency in growth signals or to insensitivity to anti-growth signals, resulting in a net increase of the replication rate or a shift in the balance of stem cell division modes. 2) D-mutation (D) represents a loss of function mutation to a tumor-suppressor gene that mediates the synthesis of proteins that promote apoptosis. This mutation decreases the death rate of cells and may also be associated with the acquisition of extensive (or even limitless) replication potential by the mutated cells during their extended life span. 3) G-mutation (G) stands for genomic instability, which increases the cellular mutation rate. This last mutation is considered by Hanahan and Weinberg [57] as an enabling tool to acquire enough mutations that cause malignancy to develop during human lifetime. These three categories of mutations are believed to be sufficient for the description of early stage of tumor initiation. As our focus is on the dynamics of carcinogenesis, that is, in the period before the onset of angiogenesis, mutations associated with the angiogenic switch are not considered. These mutations become relevant at later stages of tumor development, after the tumor has reached the diffusion limit [58]. We also do not discuss tissue invasion and metastases, which are relevant in later stages of the disease.
Our mathematical formulation rests on the assumption that the multistep transformation that mediates the transition of cells from a normal to a cancerous state requires the presence of all three mutations, D, R, and G (Figure 1A). Biological evidence suggests that tumors exhibit a cellular hierarchy similar to that of normal tissue, and this hierarchical structure of the mutated populations occurs naturally in our model. The inclusion of mutations into the model Eqs. S1–4 not only changes the dynamics of normal tissue but also adds mutated populations of stem, progenitor, and mature cells, as illustrated in Figure 2B. As cells acquire mutations, they move to a population with a higher number of mutations, until they reach the population with three mutations and stay there, as they become, according to our definitions, cancerous cells (Figure 2B, rightmost column). The populations considered in the model vary by cell type, number of divisions, and number of acquired mutations. The dynamics of each population can be studied separately or collectively, depending on the question of interest. The complete set of equations that describes the normal and the mutated populations is constructed following the reasoning used for normal tissue modeling and is given in detail in Supplemental Material, Eqs. S6–9.
Model Parameters
Using the model to simulate cancer initiation in specific tissues requires the knowledge of the various parameter values associated with the particular tissue of interest. Cells within different tissues show evidence of significantly different rates of proliferation and death and different numbers of divisions along the lineages that take a cell from a stem cell all the way to maturation. These differences lead to the specialized tissue dynamics that are attributed to the variety of tissues in the body. For example, whereas hematopoietic stem cells are believed to divide on average every 23 to 67 weeks [59], colonic crypt stem cells divide much more frequently, approximately once in every 10 days [60], on average. The number of divisions required to reach maturation also differs between those two tissues. Whereas 20 to 30 divisions are estimated for hematopoietic progenitors [61], colonic crypt progenitors complete only 4 to 6 divisions [60] as they climb up the crypt on their way to becoming mature functioning cells. Unfortunately, many of the parameter values associated with the model have not been experimentally determined for most tissues. We therefore simulated the model using a wide range of parameters; however, we present results for parameters related to the well-studied hematopoietic system (Table 1). Even in that case, many parameters are allusive, for example, we had to adjust the number of stem cells (9 x 10⁵ cells) so that for a chosen division rate of stem cells (0.016 divisions per day) and progenitors (0.5 divisions per day) and for a chosen number of progenitor generations (28 generations), the homeostatic number of mature cells (estimated as 1012 cells) will be maintained.
Table 1 contains parameters that correspond to the different scenarios discussed in the text. The column named Normal presents the parameters used to simulate normal, homeostatic tissue. Deviations from homeostasis that occur as a result of acquiring a certain mutation are presented in the four columns named Mutated (A)-Mutated (D), each corresponds to the different scenarios described in the Results section. Notice that in the absence of mutations, the value from column Normal has to be used. For example, stem cells that have acquired only the R-mutation in scenario referred to as Mutated (A) will exhibit increased rate of division—as is indicated in the appropriate entry in column Mutated (A), whereas the rates of death and mutation will remain normal (the values taken from the column Normal). Notice that in this case, the proportion of stem cell undergoing symmetric and asymmetric divisions does not change. Alternatively, stem cells that have acquired only the R-mutation in scenario referred to as Mutated (B) will divide at a normal rate, but the proportions of the symmetric and asymmetric modes of division will be changed according to column Mutated (B). The rates of division and mutation of these cells will remain normal (the values taken from column Normal). Progenitor cells that have acquired all three mutations in scenario referred to as Mutated (A) will exhibit changes in rates of division, death, and mutation, as indicated in column Mutated (A).
Results
The mathematical model was numerically simulated using the parameter values listed in Table 1. Consistent with cancer initiation, the simulations start with initially a healthy tissue in a homeostatic regime, defined as the steady state solution to Eqs. S1–4, using the parameters in the column labeled Normal.
Pathways to Cancer
The basic model describes the acquisition of mutations from three classes, denoted by R, D, and G, associated with increased rates of proliferation, decreased rate of death, and increased rate of occurrence of mutations, respectively. We considered all six possible orders in which these mutations may be accumulated and have compared the dynamics of the resulting mutated populations (N denotes normal state of a cell, with no mutations).
The model enables us to distinguish between populations of cells that have acquired the same types of mutations but in a different order. This key feature allows us to perform a quantitative study of the dynamics associated with the different sequences of mutations and their effect on the pace of carcinogenesis. For each of the six sequences of mutations, we looked at the emergence and development of cancer stem cells and cancerous differentiating cells that, by our definition, have accumulated all three mutations.We found that the size of each population and its temporal dynamics strongly depend on the particular order in which the mutations are acquired. The results are summarized in Figure 3 for parameters listed in Table 1. In Figure 3, A and B, the number of cancer stem cells and cancer-differentiating cells is plotted for each mutation sequence as a function of time. It is interesting to observe how the development of the transformed stem cell populations correlates and determines the dynamics of the transformed differentiating population. This shows that our model supports the hypothesis that the transformed stem cells are critical mediators of large-scale tumor growth dynamics. It is also apparent that the location of the G-mutation within the sequence has a critical effect on the pace of development of the cancerous cell population. The fastest-emerging tumors are related to sequences of mutations with the G-mutation being the first acquired mutation, whereas the slowest pace is associated with sequences in which the G-mutation is acquired last. Although the G-mutation is not a mutation that is associated with increased fitness of cells, it acts as an accelerator toward acquisition of mutations that increase fitness leading to fast clonal expansion of the mutated cell population and earlier onset of cancer. The details of the dynamics of the cancerous population depend on the relative rates of proliferation and death and on the effect of the R and D mutations on those rates. However, this striking result, which is shown for the set of parameters in column labeled Mutated (A) in Table 1, is robust for a wide range of parameters for both stem cell and progenitor populations.
Figure 3.

G-mutation sets the pace: The transformed stem (A) and differentiating (B) cells2 are plotted as a function of time [Table 1 (Normal and Mutated (A)) for parameters]. The time at which the first cancer stem cell appears (C) and the age at which the population of transformed cells reaches 108 cells (D) is determined.
It is interesting to note that the first transformed cell (i.e., a cell that has acquired all three mutations) is a differentiating cell and not a stem cell; however, owing to the limited proliferative capacity of this cell, it will not cause tumor formation. Actually, many transformed cells are present in the tissue at any one time; however, it is the appearance of a cancer stem cell that leads to continuous tumor growth. In Figure 3C, we point to the time at which the first cancer stem cell appears, and in Figure 3D, the time to macroscopic cancerous population of 108 cells is shown. The emergence of the first cancer stem cell corresponds to the onset of a malignancy. Clearly, when G-mutation is first, there is an early onset of cancer at 14.6 or 17.7 years, whereas if the G-mutation is last, the first cancer stem cell appears around 80 or 90 years. For the specified set of parameters, only sequences with early acquisition of the G-mutation will lead to a detectable disease during the human lifetime, as shown in Figure 3D.
Tissue Composition
As mutated populations emerge and develop, the tissue composition changes with time. Our model allows for a simple tracking of these changes, by looking at the sizes of the various populations of normal and mutated cells at different time points.We have compared the dynamics of tissue composition for the fastest and slowest sequences of mutations ([N ⇒ G ⇒ R ⇒ D] and [N ⇒ D ⇒ R ⇒ G], respectively), focusing separately on the populations of stem cells (Figure 4, A and B) and differentiating cells (Figure 4, C and D). It is apparent that for the slowest sequence, stem cells that have acquired only one mutation are the dominant population and no cancer stem cell is expected to emerge until approximately 80 to 90 years; whereas for the fastest sequence, the population of stem cells with three mutations emerges quickly, resulting in a large number of cancer stem cells at a much younger age. The dynamics of the differentiating populations in both cases reflects the differences in stem cell composition. For the fastest sequences (Figure 4C), the population of differentiating cells with all three mutations develops at the fastest pace, tending to overgrow the other mutated populations with one and two mutations; whereas for the slowest sequence (Figure 4D), the overall number of transformed cells is well below detection. So, for example, if we examine the tissue at 40 years, we will find that for the fastest sequence of mutations ([N ⇒ G ⇒ R ⇒ D]), the mutated stem cell population in the tissue is composed of 86% cells with G mutation, 12% with both G and R mutations and 2% with all three mutations; whereas in the case of the slowest sequence ([N ⇒ D ⇒ R ⇒ G]), mutated stem cells only acquired one mutation and comprise 100% of the mutated stem cells. The composition of mutated differentiating cells behaves similarly, and we find that, whereas for the slowest sequence, almost 100% of the mutated differentiating cells have only one mutation, for the fastest sequence, the populations with one, two, and three mutations comprise 72%, 19%, and 8%, respectively.
Figure 4.

Tissue composition: The stem cell populations are plotted, as a function of time for (A) the fastest ([N ⇒ G ⇒ R ⇒ D]) and (B) the slowest ([N ⇒ D ⇒ R ⇒ G]) mutation sequences. The predictions for the differentiating cells are plotted in (C) and (D). Cancerous cells resulting from a single transformed stem cell exhibit characteristics of sigmoid growth (E).
Although differences in tissue composition over time between the fastest and slowest paths are evident, the overall significance of the mutated populations is small and does not exceed 2% of the total number of tissue cells (Figure W3 in Supplemental Material). The tissue has sufficient normal cells to keep functioning, while the emerging mutated cell populations intrude locally on the healthy balance. In the case of the slowest sequence, there are no emerging cancer stem cells during a human lifetime, and the cancerous cells comprise a small percentage of tissue cells and are spread randomly within the tissue, without disturbing it significantly. In the case of the fastest sequence of mutations, where cancer stem cells do emerge, tumors start to develop locally by clonal expansion of these cancer stem cells. Over time, this excess growth in the tissue may disturb its normal function.
The predictions of the number of cancer cells presented in Figures 3 and 4, A–D, include all the transformed cells in the tissue, without considering specific clones of mutated cells. Our results suggest that in the absence of cancer stem cells, the excess of mutated cells does not lead to a significantly large population of cancer cells and therefore no noticeable distraction of tissue function is experienced during the period of human lifetime. It is the presence of cancer stem cells that leads to malignancy. Therefore, the most significant event in carcinogenesis is the appearance of a cancer stem cell.
We have been able to identify the appearance of the first cancer stem cell and to follow the size of tumor that is developed owing to this cell of origin. We have isolated the cancerous population that arises owing to the appearance of the first cancer stem cell for the fastest mutation sequence [N ⇒ G ⇒ R ⇒ D], Figure 4E. For this particular sequence, the tumor reaches the maximal size for an avascular tumor (106 cells) shortly after the first cancer cell appears (at approximately 14.5 years). The cancerous population grows rapidly initially as the asymmetric division of the cancer stem cell starts a cascade of divisions in progenitors that divide at a relatively high rate and therefore produce a large population of cancerous cells in a short period. When reaching a quasi-steady state, the cancer stem cell continuously seeds this population, resulting in a slowly growing phase. This pattern of fast initial growth and slower growth in later stages is typical to many cancers and is well described by a sigmoid function [62]. In breast tumors, for example, the growth is described by a particular case of the sigmoid, referred to as the Gompertzian growth curve [63–65].
Mutations Effecting Stem Cell Division Pattern
Proliferation in R-mutated stem cells may be affected in two distinct ways. So far, the case where the R-mutation increases the proliferation rate without changing the relative proportion of the different division modes has been investigated. However, because cancer may be associated with deregulation in self-renewal pathways of stem cells, it is important to study the effect of the deregulation of the pattern of self-renewal on cancer initiation. Therefore, we have simulated the case where the R-mutated stem cells experience a change in their division pattern; specifically, a larger proportion of R-mutated stem cells exhibit symmetric self-renewal rather than asymmetric division [for parameters, see Table 1, column labeled Mutated (B)]. Our results suggest that changes in division pattern fatally affects all six sequences of mutation acquisition, leading to the onset of malignant disease at early ages, ranging between 6.7 years for the fastest sequence and 15.9 years for the slowest sequence. In Figure 5A, we present the age of the appearance of the first cancer stem cell for each sequence side by side with the age of onset of cancer in the case where R mutation only affected the proliferation rate of stem cells. This clearly emphasizes that the significant speeding of the process of cancer initiation in the case when the R-mutation affects the division pattern of stem cells diminishes the accelerating effect of genetic instability (Figure W5). Also, when only the rates of stem cell division are affected by the R-mutation, the number of cancer cells in most sequences does not reach detectable levels until very old age if at all; however, when the balance between symmetric self-renewal and asymmetric division is broken, a rapid outbreak of disease is experienced, and all sequences result in detectable malignancies within 20 years (Figure 5B).
Figure 5.

Modifying the R-mutation: The time of the first cancer stem cell appearance (A, right bars) and the age at which transformed cells reach 108 (B, right bars) is determined using Mutated (B) parameters (Table 1). The left bars in (A) and (B) are the results shown in Figure 4, presented here for reference. Mutated stem cell population compositions are plotted as a function of time for (C) the fastest ([N ⇒ G ⇒ R ⇒ D]) and (D) the slowest ([N ⇒ D ⇒ R ⇒ G]) mutation sequences. The predictions for the population of mutated differentiating cells are plotted in (E) and (F).
Mutated tissue composition is shown in the graphs in Figure 5, C–F, where the relative proportions of cells with one (dash), two (dash-dot), and three (solid) mutations in stem cell and differentiating populations is displayed for the fastest and the slowest sequences. Comparison of the population dynamics for the slowest and fastest sequences shows that, in both cases, the population of cells with one mutation that comprise the bulk of mutated cells for shorter times reduces in proportion in favor of population of two mutations and later the population with three mutations. This shift in the dominating mutated population occurs sooner for the fastest sequence. We have been able to compare the dynamics in the case of altered pattern of division in stem cells to the dynamics of mutated populations in the case of only increased rate of division (Supplemental Material, Figure W4). In the latter case, even the fastest sequence leads to a much slower and smaller rise in the relative proportion of the populations with two or three mutations. Taken together, these results illustrate that the disturbance of the normal division pattern in stem cells has fatal consequences on the course of the disease, with or without the presence of genetic instability.
Immortality of Progenitors
Cancer may also develop owing to mutated progenitor cells that acquire some degree of self-renewal ability and therefore fail to properly differentiate. We have investigated the effect of this type of additional immortality mutation that interrupts the differentiation of progenitor cells by adding an additional mutation that blocks differentiation of proliferating progenitors, triggering self-renewal rather than stepping down the lineage.
We have simulated the case in which this mutation may occur in completely transformed progenitors of second generation (those that have already accumulated the R, D, and G mutations and have divided twice). The system of equations that we have used for this case can be found in the Supplemental Material (Eqs. S6–9 with the appropriate modification given in Eqs. S10a–10c). For parameters, see Table 1 column Mutated (C).
The result of this mutation is dramatic. In Figure 6, we present the dynamics of the cancer cell population for the case described above. The differentiation of these progenitors is then arrested leading to the rapid emergence of aggressively self-renewing cells that do not mature. Figure 6 clearly demonstrates that the course of growth in the cancer population exhibits a steep rise when the immortality mutation is acquired, reaching lethal numbers within weeks. Existence of cells that acquired this mutation dramatically changes tissue composition, now dominated by nondifferentiating early progenitors as its main component. This mutation that affects committed progenitors rather than stem cells largely overrides the effect of mutations that induce genetic instability, leading to a lethal burden of mutated cells that block normal tissue function.
Figure 6.

Immortal progenitors: Size of the cancer cell population is plotted as a function of time for the case where a fourth mutation that leads to immortality of progenitors may be acquired by early progenitors. Here, the dynamics of the cancer cell population owing to possible acquisition of this mutation by progenitors of second generation that only divided twice is plotted.
Protection Mechanism
In the simulations so far, mutated cells have not had any survival restrictions and protection mechanisms have not been considered. We, therefore, have simulated a possible protection mechanism that ensures activation of apoptotic triggers in case of the lethal mutations by increasing the death rate of cells that acquire a mutation other than the D-mutation. The results are summarized in Figure 7, where we show both the effect of this protection on the overall dynamics of carcinogenesis and the particular effect on the appearance of the first cancer stem cell. Figure 7A presents the dynamics of the population of cancer stem cells if the mutated cells with mutations other than D die with rate of 0.1/day (very high compared with the death rates shown in Table 1). The effect of this type of protection, as seen in Figure 7, A and B, is the suppression of sequences that have the D-mutation acquired at later stages. In this case, the order of the G-mutation has only a secondary significance. In particular, the time of occurrence of the first cancer stem cell (Figure 7C, right bars), while left unchanged for the [N ⇒ D ⇒ R ⇒ G] and the [N ⇒ D ⇒ G ⇒ R] sequences, is lengthened significantly, beyond 100 years of age for all other sequences, which notably differs from the unsuppressed case (shown for reference in Figure 7C, left bars). This provides evidence that the sequences of mutations for which the cell cycle checkpoints are not impaired; the mutated cells have a high probability of undergoing apoptosis, and the onset of cancer is significantly delayed.
Figure 7.

Effect of a protection mechanism: The transformed stem (A) and differentiating (B) cells that emerge when the cell cycle checkpoints are included in the model. The time at which the first cancer stem cell appears (C, right bars) and the age at which the population of transformed cells reaches 108 cells (D, right bars) is determined. The left bars in (C) and (D) are the results shown in Figure 4, presented here for reference.
Discussion
We have presented a general mathematical framework to quantitatively study carcinogenesis. The model captures key features such as hierarchical tissue structure and maturation of progenitor cells and includes explicitly all possible division modes of stem cells. The differentiation of progenitors in our model occurs through division, and the dynamics of each progenitor generation can be studied individually. This feature provides information about the distribution of age and differentiation within the total population of progenitors and is particularly useful when studying the effect of mutations that interfere with differentiation and mortality.
We used the model to explore cancer initiation as a multistep process of accumulation of somatic mutations within tissue cells. In particular, we have studied how the order in which mutations are acquired and the phenotypic alterations in mutated cells affect the pace of carcinogenesis. The model predicts that the details of cancer growth dynamics are governed by the specific effect of the mutations that led to cellular transformation. We have also characterized differences in the dynamics of the various cellular populations depending on the particular order of mutations accumulation and on their physiological expression.
In case where the R and D mutations only affect the rates of division and death of mutated cells, respectively, we have found that the fastest transformation occurs when the G-mutation is acquired first, a result that is robust to changes within a wide range of parameters. This finding is not surprising, noticing that the effect of the G-mutation on mutation rates is approximately 100-fold higher than the effect of the R and D mutations on the replication and death rates, respectively. These phenotypic expressions that lead to increased fitness in mutated cells have been discussed in former studies. In this case, the fastest sequence of mutations found in our simulations agrees with the results of Michor et al. for colon cancer [15]; however, it differs from that found by Spencer et al. [16], who considered mutation acquisition in a homogeneous system of cells. The reason for this disagreement does not lie in the incorporation of hierarchy in our model but in the fact that Spencer et al. did not track the particular history of the cells in the various populations, rather they integrated over all the cells with a particular set of mutations regardless of the history of the order of acquisition. In this study, we were able to show that the particular order in which mutations are accumulated is crucial and that different sequences lead to different dynamics governing the emergence of cancerous cells within the tissue. Therefore, by looking carefully at the various mutation histories, we observe that the sequence that Spencer et al. determined to be fastest, [N ⇒ D ⇒ R ⇒ G], is actually the slowest sequence in our analysis.
Not only is mutation order important, each one's specific effect on proliferation and death is critical as well. Using our model, we have been able to simulate and analyze the effect of various phenotypic changes of mutated cells. Recent experiments [51] show that while the oncogene Bcr-Abl, which is associated with CML, drastically alters the rates of division and death in mutated stem cells, the oncogene HoxA9-Nup98 (associated with AML) does not affect cell death or division rates but significantly disturbs the balance between symmetric self-renewal and asymmetric division in stem cells. These experimental results suggest that deregulation of stem cell division modes is related to more aggressive cancers, and our simulations are in agreement with these results. Because the model includes the possible modes of stem cells division, it enabled us to study the deregulation of the homeostatic division pattern. In fact, we found that the impact of mutations that led to an increase in symmetric self-renewal was momentous. These types of mutations diminish the importance of the G-mutation and result in early cancer initiation and extremely rapid cellular growth.
We have also studied the case where early progenitors may acquire a certain degree of immortality, a property normally associated with stem cells. We have found that when progenitors carry a mutation that enables them to cease progressing in their lineage when they divide and allows them to symmetrically self-renew, similarly to stem cells, the increase in number of mutated early progenitors is enormous. This is not surprising given that these cells are dividing at the rate of progenitor cells but without intact mechanisms ensuring maturation and death. These progenitors do not further differentiate, therefore this mutation leads to a fast-emerging population of immature cells that, owing to the relatively high proliferation rate and arrest of maturation and death, result in a population of mutated cells that rapidly reaches lethal numbers. Because, as we have shown, transformed progenitor cells are sporadically present in the tissue from a very early age, this mutation, even if the last to be acquired, can lead to fatal outcome early in life. This scenario has been recently seen experimentally [37], where differentiation blockade of early mutated progenitors has been observed. Emergence of a population of self-renewing progenitors is believed to result in the fatal transition between the less aggressive CML and the fatal blast crisis, which is the aggressive and final stage of the disease.
An additional consequence of the D-mutation may be manifested in a defective mechanism of telomere shortening, resulting in an increase of the maximal number of divisions the committed progenitors can undergo. By simulating this possibility, we have found that although failure of progenitors to properly undergo senescence does not affect the emergence of cancer stem cells, it nonetheless leads to a massive increase in mutated cells in the tissue. Mutated cell numbers become comparable with those of the normal tissue cells within a period of less than 2 weeks owing to the disruption of the highly controlled balance of cell proliferation and senescence.
In the present work, we have studied potential sequences of three or four somatic mutations that accumulate in cells and lead to cancer. Each mutation represents a physiological change in the cell that may be caused by different mutated genes. A recent study in which several types of breast and colorectal tumors were genetically analyzed [6] suggests that a larger number of mutations (11 per tumor, on average) contribute to the neoplastic process. Some of these mutations are related to adhesion and invasion, properties that are beyond the scope of the present work. Our model may be easily extended to study longer sequences of mutations that affect proliferation, differentiation, apoptosis, and reliability of cell cycle checkpoints. Here, we only treated representative mutations to study the effect of each phenotypic alteration.
The basic linear model presented here does not include neither feedbacks between the various cell populations nor the influence of the environment. Recently, researchers were able to demonstrate that the pattern of division in the stem cell population depends on the particular microenvironment in which those stem cells reside [49,51]. A nonlinear model that includes the influence of the stem cell microenvironment and the interactions between the various cell compartments is currently in working progress.
In conclusion, we believe that the proposed mathematical framework may provide a quantitative insight into the process of carcinogenesis. When developing mathematical models, there is always debate concerning the amount of biological information the model captures and its level of complexity; often a delicate balance between the two is achieved. Here, we have presented a simple linear set of equations that incorporate many key features of mutational acquisition in hierarchical tissue. Although linear theories have been presented in the past, none have incorporated both the sequential acquisition of phenotype altering mutations and tissue hierarchy at the same time. The structure of our model is general and flexible so that, as more data become available and key parameters become assessable, greater complexity can easily be incorporated. Future extension of the model that we are already considering include the nonlinear information associated with stem cell niches and regulatory signaling between the various cell types that mediate the rates and patterns of proliferation and death. We believe that our general framework has the potential to provide important assistance in understanding cancer dynamics both in general and in specific malignancies, especially if used in cooperation with biological studies.
Supplemental Material
Model Equations
Normal tissue
Normal tissue is described by a set of N + 2 ordinary differential equations (ODEs), each describing the rate of change in size of a population of cells. These equations correspond to the balance equations schematically shown in the article (Eqs. 1–4). Eq. S1 describes the rate of change in the size of the stem cell population, denoted by S(t). The rates of symmetric self-renewal, symmetric differentiation, and death of stem cells are denoted by αs, αd and δS, respectively.
| S1 |
Note that the asymmetric self-renewal division, the rate of which is denoted by αa, does not affect the number of stem cells and therefore does not contribute to Eq. S1.
The rate of change in the number of earliest progenitors denoted by C0 (the direct outcome of stem cell division, considered as generation 0) is given in Eq. S2. The division and death rates in this population are denoted by β0 and µ0, respectively.
| S2 |
Note that each asymmetric division contributes one progenitor to C0, whereas symmetric differentiation division contributes two.
The dynamics of the populations of the subsequent generations of progenitors (n = 1, 2, …, N - 1) is subject to the N - 1 equations, each has the form of Eq. S3, where N is the number of divisions required for the cells in a particular tissue to reach maturity. For each generation of progenitors, the index n denotes the number of divisions the cell has undergone.
| S3 |
The birth and death rates of the nth generation are denoted by βn and µn, respectively. Finally, the number of mature cells is described by Eq. S4.
| S4 |
We assume that homeostasis is maintained by a constant number of stem cells (dS/dt = 0), so that the rates of symmetric division modes and death, if nonzero, should be balanced, i.e., αs = αd + δS. Therefore, the number of stem cells is constant in time, i.e., S(t) = SH, and we find that the steady state solution for the number of progenitors and mature cells in the tissue is given in Eq. S5.
| S5 |
These expressions show that the number of progenitor cells in each generation and the number of mature cells are determined by the number of stem cells and the rates of division and death of stem cells and the transient progenitors of preceding generations. The schematic view of our model for the normal tissue is shown in Figure W1A, and the steady state solution for one particular choice of parameters, listed in Table 1 column Normal, is given in Figure W1B. Notice that because we use a continuous growth model, the resulting numbers of cells are not necessarily integers.
Tissue with normal and mutated cells
Let S, S(1), S(2), and S(3) denote the size of stem cell populations in the tissue with zero, one, two, or three mutations, respectively. Mutated divisions in stem cells are assumed to occur with probability mS, whereas normal divisions occur at probability 1 - mS. The rates of change in S, S(1), S(2), and S(3) are governed by Eq. S6.
| S6 |
The rates αsi, αai, αdi, δSi, and mSi3 stand for the modified rates for symmetric self-renewal, asymmetric self-renewal, and symmetric differentiation divisions rates, death rate, and probability of mutated division, respectively, where i = 1, 2, 3 denotes the number of mutations acquired by the stem cells. Notice that in the way the model is set, mutations are assumed to occur during division and a mutated division results in two mutated daughter cells.
The various populations of maturing cells are distinguishable by the number of divisions that each cell in the population has undergone (subscript) and by the number of mutations carried by the cells in the population (superscript). For example, denotes the number of cells in the population of progenitors that are derived from stem cells (those cells have not undergone any divisions yet) and carry one mutation, whereas denotes the number of cells in the cancerous progenitor population (with all three mutations) that has undergone n divisions. A decrease in a population of progenitors is assumed to occur solely through division or death, denoted by and , respectively. The probability of mutated divisions of progenitors is denoted by mC and in principle can differ from mS. The set of ODEs for the normal (C0) and mutated () earliest progenitors is given in Eq. S7.
| S7 |
The rate of change in the number of progenitors in the subsequent N - 1 generations of mutated and normal cells is subject to the N - 1 ODEs (Eq. S8), depending in the number of mutations (Cn—normal, — mutated, n = 1, …, N - 1, i = 1, 2, 3).
| S8 |
The temporal behavior of the fully mature normal and mutated cells is given by the set of ODEs in Eq. S9.
| S9 |
In the present work, we present the results obtained by numerically solving our model (using MATLAB stiff ODE solver ode15s) for the parameters listed in Table 1. Because in the present work, we are interested in the initiation of cancer, we assume that initially the tissue is healthy and sustains a homeostatic regime. Therefore, our simulations have been started with normal cell compartments only (the steady state solution of the equations for normal tissue), whereas the mutated cell compartments S(i), (n = 0,…, N, i = 1, 2, 3) were initially set to zero. This is not by any means a restriction of the model, and other initial conditions may be considered as different questions are addressed.
Immortality of progenitors
Here, we consider the mutation that results in immortality of progenitors, i.e., the progenitors that carry this mutation undergo self-renewal rather than progression along their lineage. We have simulated the case in which this mutation may occur in completely transformed second-generation progenitors (those that have already accumulated the R, D, and G mutations and have divided twice). The system of equations that we have used for this case is given in Eqs. S6–9 with the appropriate modification given in Eqs. S10a–10c. In this scenario, it is assumed that the second-generation cancerous progenitors (the number of which is denoted by have a small probability (P = .000001) to become self-renewing progenitors. The equation that describes the dynamics of the progenitors in the second generation does not change (Eq. S10a). The reason is that we assume that mutations occur during divisions; therefore, only the succeeding generations are affected. The number of the newly emerging self-renewing progenitors (denoted by ) increases exponentially with doubling time governed by , an increased rate of progenitor division. The population dynamics of the self-renewing progenitors is described by Eq. S10b. The progenitors that are directly affected by the suppression of differentiation are in the subsequent generation, and their equation is modified according to Eq. S10c. All other equations are not changed, but the effect of suppression propagates down the lineage.
| S10a |
| S10b |
| S10c |
Cancer stem cell hypothesis
According to the cancer stem cell hypothesis, only a small population of tumor cells is capable of forming and maintaining tumors. These tumorigenic cells referred to as cancer stem cells form a self-renewing population of cells that gives rise to phenotypically diverse nontumorigenic cells. Our model has been shown to be compatible with the cancer stem cell hypothesis, indicating that those are the transformed stem cells rather than the maturing cells with limited proliferative potential that may give rise to and sustain tumors. We have compared the outcome of the model (Eqs. S6–9) simulated for two cases: (i) only stem cells have been allowed to acquire mutations, whereas the differentiating cells could only propagate mutations along their lineage (the mutation rates of the dividing progenitors have been set to zero — i.e., mC = mC1 = mC2 = 0 in Eqs. S7–9); and (ii) only differentiating cells have been allowed to mutate, whereas the stem cells are being protected from genetic alteration (the mutation rate of stem cells has been set to zero — i.e., mS = mS1 = mS2 = 0 in Eq. S6). The results of both simulations are summarized in Figure W2A, where the sizes of the emerging cancerous populations for both scenarios have been plotted as a function of time. Although the rise in the number of cancerous cells is initially significantly faster in case (ii), owing to the higher proliferation rate of progenitors compared to the slowly dividing stem cells, their numbers quickly reach a steady state that is significantly below detection level. The limited, albeit mutated, proliferation capacity of the mutated progenitors cells is responsible for this limited expansion. In case (i), however, the number of cancer cells grows steadily, because the transformed stem cells serve as a never-ending source of cancerous progeny, the dynamics of which is off equilibrium owing to increased proliferation and reduced death rates. This figure demonstrates how the hierarchical structure of the tissue prevents mutations that occurred downstream in the lineage from accumulating owing to the limited life span of the mutation carriers. Transformed stem cells alone, however, are capable of initiating perpetual growth of cancerous cell populations.
Experimentally, specific markers have been developed to distinguish between tumorigenic and nontumorigenic cells in tumors. Al Hajj et al. [32], for example, identified tumorigenic human breast cancer cells as CD44+CD24-/lowLineage-. As few as 100 of these cells formed tumors when transplanted in mice, whereas thousands of transplanted nontumorigenic cells failed to initiate tumors. Furthermore, not only could the tumorigenic cells be serially passaged, forming new tumors at each transplantation, but also the tumors initiated by these cells were phenotypically heterogeneous. Figure W2B shows the result of a simulation of such an experiment. In some mice, a total of 10 human transformed stem cells, with no progenitors have been transplanted. In other mice, 350,000 transformed progenitors with no transformed stem cells have been transplanted. In the first case, a steady tumor is initiated (the tumor does not grow further because, in our simulation, we have not allowed further mutations to occur). In the second case, although initially a high number of tumor cells have been transplanted, the tumor eventually degenerates owing to the limited life span of the progenitors and the absence of any transformed stem cell source. It demonstrates the differences in growth owing to transplantation of two types of cells: 1) cancerous stem cells (tumorigenic) and 2) cancerous progenitor cells (nontumorigenic). The resulting curves that show the size of the cancer cell population as a function of time demonstrate that a small number of transplanted cancer stem cells may initiate and maintain a tumor, whereas transplantation of a large number of cancerous progenitor cells, without a cancerous stem cell source, will not result in tumor development. In this latter case, the cancerous population will completely degenerate. Therefore, our model is in agreement with this experiment and others, supporting the cancer stem cell hypothesis. This result has important consequences for therapy, suggesting that the driving force in carcinogenesis are the cancer stem cells, and it is this population that should be targeted during treatment. Leaving cancerous stem cells after treatment will cause recurrence of the disease, therefore only the elimination of all tumor cancer cells will lead to successful therapy [37].
| 1. N ⇒ D ⇒ R ⇒ G, | 4. N ⇒ R ⇒ G ⇒ D, |
| 2. N ⇒ D ⇒ G ⇒ R, | 5. N ⇒ G ⇒ R ⇒ D, |
| 3. N ⇒ R ⇒ D ⇒ G, | 6. N ⇒ G ⇒ D ⇒ R; |
Footnotes
This article refers to supplementary materials, which are designated by Figures W1 to W5 and are available online at www.neoplasia.com
Because we are using a continuous ODE model, the variable that represents the number of cancer stem cells can take any non-negative real value. The graph continues all the way down to zero in the y-axis but we have chosen to crop it at 103.
Population variables and rates that do not have i = 1, 2, and 3 added, have to be understood as quantities that correspond to the normal, nonmutated populations, or rates.
References
- 1.Loeb KR, Loeb LA. Significance of multiple mutations in cancer. Carcinogenesis. 2000;21:379–385. doi: 10.1093/carcin/21.3.379. [DOI] [PubMed] [Google Scholar]
- 2.Knudson A. Two genetic hits (more or less) to cancer. Nat Rev Cancer. 2001;1:157–170. doi: 10.1038/35101031. [DOI] [PubMed] [Google Scholar]
- 3.Barrett JC. Mechanisms of multistep carcinogenesis and carcinogen risk assessment. Environ Health Perspect. 1993;100:9–20. doi: 10.1289/ehp.931009. [DOI] [PMC free article] [PubMed] [Google Scholar]
- 4.Luebeck EG, Moolgavkar SH. Multistage carcinogenesis and the incidence of colorectal cancer. Proc Natl Acad Sci USA. 2002;99:15095–15100. doi: 10.1073/pnas.222118199. [DOI] [PMC free article] [PubMed] [Google Scholar]
- 5.Kinzler KW, Vogelstein B. Lessons from hereditary colorectal cancer. Cell. 1996;87:159–170. doi: 10.1016/s0092-8674(00)81333-1. [DOI] [PubMed] [Google Scholar]
- 6.Sjöblom T, Jones S, Wood LD, Parsons DW, Lin J, Barber TD, Mandelker D, Leary RJ, Ptak J, Silliman N, et al. The consensus coding sequences of human breast and colorectal cancers. Science. 2006;314:268–274. doi: 10.1126/science.1133427. [DOI] [PubMed] [Google Scholar]
- 7.Vessey CJ, Norbury CJ, Hickson ID. Genetic disorders associated with cancer predisposition and genomic instability. Prog Nucleic Acid Res Mol Biol. 1999;63:189–221. doi: 10.1016/s0079-6603(08)60723-0. [DOI] [PubMed] [Google Scholar]
- 8.Duesberg P, Rasnick D. Aneuploidy, the somatic mutation that makes cancer a species of its own. Cell Motil Cytoskeleton. 2000;47:81–107. doi: 10.1002/1097-0169(200010)47:2<81::AID-CM1>3.0.CO;2-#. [DOI] [PubMed] [Google Scholar]
- 9.Cairns J. Mutation selection and the natural history of cancer. Nature. 1975;255:197–200. doi: 10.1038/255197a0. [DOI] [PubMed] [Google Scholar]
- 10.Cairns J. Somatic stem cells and the kinetics of mutagenesis and carcinogenesis. Proc Natl Acad Sci USA. 2002;99:10567–10570. doi: 10.1073/pnas.162369899. [DOI] [PMC free article] [PubMed] [Google Scholar]
- 11.Frank SA, Iwasa Y, Nowak MA. Problems of cell division and the risk of cancer. Genetics. 2003;163:1527, 1530. doi: 10.1093/genetics/163.4.1527. [DOI] [PMC free article] [PubMed] [Google Scholar]
- 12.Sole RV, Deisboeck TS. An error catastrophe in cancer? J Theor Biol. 2004;228:47–54. doi: 10.1016/j.jtbi.2003.08.018. [DOI] [PubMed] [Google Scholar]
- 13.Gatenby RA, Vincent TL. An evolutionary model of carcinogenesis. Cancer Res. 2003;63:6212–6220. [PubMed] [Google Scholar]
- 14.Michor F, Nowak MA, Frank SA, Iwasa Y. Stochastic elimination of cancer cells. Proc R Soc Lond B Biol Sci. 2003;270:2017–2024. doi: 10.1098/rspb.2003.2483. [DOI] [PMC free article] [PubMed] [Google Scholar]
- 15.Michor F, Iwasa Y, Rajagopalan H, Lengauer C, Nowak MA. Linear model of colon cancer initiation. Cell Cycle. 2004;3:358–362. [PubMed] [Google Scholar]
- 16.Spencer SL, Berryman MJ, Garcia JA, Abbott D. An ordinary differential equation model of the multistep transformation to cancer. J Theor Biol. 2004;231:515–524. doi: 10.1016/j.jtbi.2004.07.006. [DOI] [PubMed] [Google Scholar]
- 17.Michor F, Iwasa Y, Vogelsteinc B, Lengauer C, Nowak MA. Can chromosomal instability initiate tumorigenesis? Semin Cancer Biol. 2005;15:43–49. doi: 10.1016/j.semcancer.2004.09.007. [DOI] [PubMed] [Google Scholar]
- 18.Sieber O, Heinimann K, Tomlinson I. Genomic stability and tumorigenesis. Semin Cancer Biol. 2005;15:61–66. doi: 10.1016/j.semcancer.2004.09.005. [DOI] [PubMed] [Google Scholar]
- 19.Loeb LA, Loeb KR, Anderson JP. Multiple mutations and cancer. Proc Natl Acad Sci USA. 2003;100:776–781. doi: 10.1073/pnas.0334858100. [DOI] [PMC free article] [PubMed] [Google Scholar]
- 20.Beckman RA, Loeb LA. Efficiency of carcinogenesis with and without mutator phenotype. Proc Natl Acad Sci USA. 2006;103:14140–14145. doi: 10.1073/pnas.0606271103. [DOI] [PMC free article] [PubMed] [Google Scholar]
- 21.Beerenwinkel N, Antal T, Dingli D, Traulsen A, Kinzler KW, Velculescu VE, Vogelstein B, Nowak MA. Genetic progression and the waiting time to cancer. PLoS Comput Biol. 2007;3:2239–2246. doi: 10.1371/journal.pcbi.0030225. [DOI] [PMC free article] [PubMed] [Google Scholar]
- 22.Frank SA, Iwasa Y, Nowak MA. Patterns of cell division and the risk of cancer. Genetics. 2003;163:1527–1532. doi: 10.1093/genetics/163.4.1527. [DOI] [PMC free article] [PubMed] [Google Scholar]
- 23.Michor F, Iwasa Y, Lengauer C, Nowak MA. Dynamics of colorectal cancer. Semin Cancer Biol. 2005;15:43–49. doi: 10.1016/j.semcancer.2005.06.005. [DOI] [PubMed] [Google Scholar]
- 24.Tomlinson I, Sasieni P, Bodmer W. How many mutations in a cancer? Am J Pathol. 2002;160:755–758. doi: 10.1016/S0002-9440(10)64896-1. [DOI] [PMC free article] [PubMed] [Google Scholar]
- 25.Tomlinson I, Novelli MR, Bodmer W. The mutation rate and cancer. Proc Natl Acad Sci USA. 1996;93:14800–14803. doi: 10.1073/pnas.93.25.14800. [DOI] [PMC free article] [PubMed] [Google Scholar]
- 26.Reya T, Morrison SJ, Clarke MF, Weissman IL. Stem cells, cancer and cancer stem cells. Nature. 2001;414:105–111. doi: 10.1038/35102167. [DOI] [PubMed] [Google Scholar]
- 27.Pardal R, Clarke MF, Morrison S. Applying the principles of stemcell biology to cancer. Nat Rev Cancer. 2003;3:895–902. doi: 10.1038/nrc1232. [DOI] [PubMed] [Google Scholar]
- 28.Al-Hajj M, Clarke MF. Self-renewal and solid tumor stem cells. Oncogene. 2004;23:7228–7274. doi: 10.1038/sj.onc.1207947. [DOI] [PubMed] [Google Scholar]
- 29.Lapidot T, Sirard C, Vormoor J, urdoch B, Hoang T, Caceres-Cortes J, Minden M, Patterson B, Caligiuri MA, Dick JE. A cell initiating human acute myeloid leukemia after transplantation into SCID mice. Nature. 1994;17:645–648. doi: 10.1038/367645a0. [DOI] [PubMed] [Google Scholar]
- 30.Bonnet D, Dick JE. Human acute myeloid leukemia is organized as a hierarchy that originates from a primitive hematopoietic cell. Nat Med. 1997;3:730–737. doi: 10.1038/nm0797-730. [DOI] [PubMed] [Google Scholar]
- 31.Singh SK, Clarke ID, Terasaki M, Bonn VE, Hawkins C, Squire J, Dirks PB. Identification of a cancer stem cell in human brain tumors. Cancer Res. 2003;63:5821–5828. [PubMed] [Google Scholar]
- 32.Al-Hajj M, Wicha MS, Benito-Hernandez A, Morrison SJ, Clarke MF. Prospective isolation of tumorigenic breast cancer cells. Proc Natl Acad Sci USA. 2003;100:3983–3988. doi: 10.1073/pnas.0530291100. [DOI] [PMC free article] [PubMed] [Google Scholar]
- 33.Ricci-Vitiani L, Lombardi DG, Pilozzi E, Biffoni M, Todaro M, Peschle C, De Maria R. Identification and expansion of human colon-cancer initiating cells. Nature. 2007;445:111–115. doi: 10.1038/nature05384. [DOI] [PubMed] [Google Scholar]
- 34.O'Brien CA, Pollett A, Gallinger S, Dick JE. A human colon cancer cell capable of initiating tumour growth in immunodeficient mice. Nature. 2007;445:106–110. doi: 10.1038/nature05372. [DOI] [PubMed] [Google Scholar]
- 35.Kim CF, Jackson EL, Woolfenden AE, Lawrence S, Babar I, Vogel S, Crowley D, Bronson RT, Jacks T. Identification of bronchioalveolar stem cells in normal lung and lung cancer. Cell. 2005;121:823–835. doi: 10.1016/j.cell.2005.03.032. [DOI] [PubMed] [Google Scholar]
- 36.Collins AT, Berry PA, Hyde C, Stower MJ, Maitland NJ. Prospective identification of tumorigenic prostate cancer stem cells. Cancer Res. 2005;65:10946–10951. doi: 10.1158/0008-5472.CAN-05-2018. [DOI] [PubMed] [Google Scholar]
- 37.Jamieson CH, Ailles LE, Dylla SJ, Muijtjens M, Jones C, Zehnder JL, Gotlib J, Li K, Manz MG, Keating A, et al. Granulocyte-macrophage progenitors as candidate leukemic stem cells in blast-crisis CML. N Engl J Med. 2004;351:657–667. doi: 10.1056/NEJMoa040258. [DOI] [PubMed] [Google Scholar]
- 38.Dingli D, Michor F. Successful therapy must eradicate cancer stem cells. Stem Cells. 2006;24:2603–2610. doi: 10.1634/stemcells.2006-0136. [DOI] [PubMed] [Google Scholar]
- 39.Michor F, Nowak MA, Frank SA, Iwasa Y. Stochastic elimination of cancer cells. Proc R Soc Lond B Biol Sci. 2003;270:2017–2024. doi: 10.1098/rspb.2003.2483. [DOI] [PMC free article] [PubMed] [Google Scholar]
- 40.Michor F, Frank SA, May RM, Iwasa Y, Nowak MA. Somatic selection for and against cancer. J Theor Biol. 2003;225:377–382. doi: 10.1016/s0022-5193(03)00267-4. [DOI] [PubMed] [Google Scholar]
- 41.Wodarz D. Effect of stem cell turnover rates on protection against cancer and aging. J Theor Biol. 2007;245:449–458. doi: 10.1016/j.jtbi.2006.10.013. [DOI] [PubMed] [Google Scholar]
- 42.Komarova NL, Cheng P. Epithelia tissue architecture protects against cancer. Math Biosci. 2006;200:90–117. doi: 10.1016/j.mbs.2005.12.001. [DOI] [PubMed] [Google Scholar]
- 43.Johnston MD, Edwards CM, Bodmer WF, Maini PK, Chapman SJ. Mathematical modeling of cell population dynamics in the colonic crypt and in colorectal cancer. Proc Natl Acad Sci USA. 2007;104:4008–4013. doi: 10.1073/pnas.0611179104. [DOI] [PMC free article] [PubMed] [Google Scholar]
- 44.Dingli D, Traulsen A, Pacheco JM. Stochastic dynamics of hematopoietic tumor stem cells. Cell Cycle. 2007;6(4):461–466. doi: 10.4161/cc.6.4.3853. [DOI] [PubMed] [Google Scholar]
- 45.Ganguly R, Puri IK. Mathematical model for the cancer stem cell hypothesis. Cell Prolif. 2006;39:3–14. doi: 10.1111/j.1365-2184.2006.00369.x. [DOI] [PMC free article] [PubMed] [Google Scholar]
- 46.Dingli D, Traulsen A, Michor F. (A)symmetric stem cell replication and cancer. PLoS Comput Biol. 2007;3:482–487. doi: 10.1371/journal.pcbi.0030053. [DOI] [PMC free article] [PubMed] [Google Scholar]
- 47.Bankhead A, III, Magnuson NS, Heckendorn RB. Cellular automaton simulation examining progenitor hierarchy structure effects on mammary ductal carcinoma in situ. J Theor Biol. 2007;246:491–498. doi: 10.1016/j.jtbi.2007.01.011. [DOI] [PubMed] [Google Scholar]
- 48.Roeder I, Horn M, Glauche I, Hochhaus A, Mueller MC, Loeffler M. Dynamic modeling of imatinib-treated chronic myeloid leukemia: functional insights and clinical implications. Nat Med. 2006;12:1181–1184. doi: 10.1038/nm1487. [DOI] [PubMed] [Google Scholar]
- 49.Wilson A, Trumpp A. Bone-marrow haematopoietic-stem-cell niches. Nat Rev Immunol. 2006;6:93–106. doi: 10.1038/nri1779. [DOI] [PubMed] [Google Scholar]
- 50.Anderson AR, Weaver AM, Cummings PT, Quaranta V. Tumor morphology and phenotypic evolution driven by selective pressure from the microenvironment. Cell. 2006;127:905–915. doi: 10.1016/j.cell.2006.09.042. [DOI] [PubMed] [Google Scholar]
- 51.Wu MF, Kwon HY, Rattis FM, Blum J, Zhao C, Ashkenazi R, Jackson TL, Gaiano N, Oliver T, Reya T. Imaging hematopoietic precursor division in real-time. Cell Stem Cell. 2007;1:541–554. doi: 10.1016/j.stem.2007.08.009. [DOI] [PMC free article] [PubMed] [Google Scholar]
- 52.Morrison SJ, Kimble J. Asymmetric and symmetric stem-cell divisions in development and cancer. Nature. 2006;441:1068–1074. doi: 10.1038/nature04956. [DOI] [PubMed] [Google Scholar]
- 53.Takano H, Ema H, Sudo K, Nakauchi H. Asymmetric division and lineage commitment at the level of hematopoietic stem cells: inference from differentiation in daughter cell and granddaughter cell pairs. J Exp Med. 2004;199:295–302. doi: 10.1084/jem.20030929. [DOI] [PMC free article] [PubMed] [Google Scholar]
- 54.Lechler T, Fuchs E. Asymmetric cell divisions promote stratification and differentiation of mammalian skin. Nature. 2005;437:275–280. doi: 10.1038/nature03922. [DOI] [PMC free article] [PubMed] [Google Scholar]
- 55.Giebel B, Zhang T, Beckmann J, Spanholtz J, Wernet P, Ho AD, Punzel M. Primitive human hematopoietic cells give rise to differentially specified daughter cells upon their initial cell division. Blood. 2006;107:2146–2152. doi: 10.1182/blood-2005-08-3139. [DOI] [PubMed] [Google Scholar]
- 56.Clarke MF, Fuller M. Stem cells and cancer: two faces of eve. Cell. 2006;124:1113–1115. doi: 10.1016/j.cell.2006.03.011. [DOI] [PubMed] [Google Scholar]
- 57.Hanahan D, Weinberg RA. The hallmarks of cancer. Cell. 2000;100:57–70. doi: 10.1016/s0092-8674(00)81683-9. [DOI] [PubMed] [Google Scholar]
- 58.Folkman J. What is the evidence that tumors are angiogenesis dependent? J Natl Cancer Inst. 1990;82:4–6. doi: 10.1093/jnci/82.1.4. [DOI] [PubMed] [Google Scholar]
- 59.Shepherd BE, Guttorp P, Lansdorp PM, Abkowitz JL. Estimating human hematopoietic stem cell kinetics using granulocyte telomere lengths. Exp Hematol. 2004;32:1040–1050. doi: 10.1016/j.exphem.2004.07.023. [DOI] [PubMed] [Google Scholar]
- 60.Potten CS, Booth C, Hargreaves D. The small intestine as a model for evaluating adult tissue stem cell drug targets. Cell Prolif. 2003;36:115–129. doi: 10.1046/j.1365-2184.2003.00264.x. [DOI] [PMC free article] [PubMed] [Google Scholar]
- 61.Bernard S, Belair J, Mackey MC. Oscillations in cyclical neutropenia: new evidence based on mathematical modeling. J Theor Biol. 2003;223:283–298. doi: 10.1016/s0022-5193(03)00090-0. [DOI] [PubMed] [Google Scholar]
- 62.Kozusko F, Bourdeau M. A unified model of sigmoid tumour Growth based on cell proliferation and quiescence. Cell Prolif. 2007;40:824–834. doi: 10.1111/j.1365-2184.2007.00474.x. [DOI] [PubMed] [Google Scholar]
- 63.Gompertz B. On the nature of the function expressive of the law of human mortality, and on a new mode of determining the value of life contingencies. Philos Trans R Soc Lond B Biol Sci. 1899;115:513–585. doi: 10.1098/rstb.2014.0379. [DOI] [PMC free article] [PubMed] [Google Scholar]
- 64.Norton L, Simon R, Brereton HD, Bogden AE. Predicting the course of Gompertzian growth. Nature. 1976;264:542–545. doi: 10.1038/264542a0. [DOI] [PubMed] [Google Scholar]
- 65.Norton L, Simon R. The Norton-Simon hypothesis revisited. Cancer Treat Res. 1986;70:163–169. [PubMed] [Google Scholar]
- 66.Michor F, Hughes TP, Iwasa Y, Branford S, Shah NP, Sawyers CL, Nowak MA. Dynamics of chronic myeloid leukaemia. Nature. 2005;435:1267–1270. doi: 10.1038/nature03669. [DOI] [PubMed] [Google Scholar]
- 67.Kunkel TA, Bebenek K. DNA replication fidelity. Annu Rev Biochem. 2000;69:497–529. doi: 10.1146/annurev.biochem.69.1.497. [DOI] [PubMed] [Google Scholar]
- 68.Jackson AL, Loeb LA. The mutation rate and cancer. Genetics. 1998;148:1483–1490. doi: 10.1093/genetics/148.4.1483. [DOI] [PMC free article] [PubMed] [Google Scholar]
- 69.Abkowitz JL, Catlin SN, McCallie MT, Guttorp P. Evidence that the number of hematopoietic stem cells per animal is conserved in mammals. Blood. 2002;100:2665–2667. doi: 10.1182/blood-2002-03-0822. [DOI] [PubMed] [Google Scholar]
Associated Data
This section collects any data citations, data availability statements, or supplementary materials included in this article.