Abstract
Bacterial chemoreceptors undergo conformational changes in response to variations in the concentration of extracellular ligands. These changes in chemoreceptor structure initiate a series of signaling events that ultimately result in regulation of rotation of the flagellar motor. Here we have used cryo-electron tomography combined with 3D averaging to determine the in situ structure of chemoreceptor assemblies in Escherichia coli cells that have been engineered to overproduce the serine chemoreceptor Tsr. We demonstrate that chemoreceptors are organized as trimers of receptor dimers and display two distinct conformations that differ principally in arrangement of the HAMP domains within each trimer. Ligand binding and methylation alter the distribution of chemoreceptors between the two conformations, with serine binding favoring the “expanded” conformation and chemoreceptor methylation favoring the “compact” conformation. The distinct positions of chemoreceptor HAMP domains within the context of a trimeric unit are thus likely to represent important aspects of chemoreceptor structural changes relevant to chemotaxis signaling. Based on these results, we propose that the compact and expanded conformations represent the “kinase-on” and “kinase-off” states of chemoreceptor trimers, respectively.
Keywords: cryo-electron tomography, molecular architecture, signal transduction
Motile bacteria such as Escherichia coli respond to changes in their chemical environment by recognizing variations in the ligand occupancy of a series of transmembrane chemoreceptors (also known as methyl-accepting chemotaxis proteins, or MCPs). Ligand binding to chemoreceptors initiates a signaling cascade that modulates the activity of the histidine kinase CheA, which ultimately regulates the rotation of the flagellar motor through a diffusible intracellular signal (1, 2). Chemoreceptors exist as homodimers and have been shown to function as trimers of chemoreceptor dimers both in vitro (3) and in vivo (4–6).
Chemoreceptor homodimers can be divided into three functional modules, each of which plays a critical role in receptor-mediated signaling (7). The transmembrane-sensing module is composed of both the sensing domain, which resides in the periplasm and contains the ligand binding site (8), and the transmembrane portion of the chemoreceptor. It has been deduced that ligand binding to the periplasmic domain results in a piston-like sliding motion of one of the four transmembrane helices (7, 9). The highly conserved cytoplasmic region of chemoreceptors can be divided into two functional modules: the signal conversion module, which contains a HAMP (histidine kinase, adenylyl cyclases, methyl-binding proteins, and phosphatases) domain, and a kinase control module, which contains an adaptation region and a protein interaction region (7, 9). The HAMP domain is the proposed site of signal conversion between the transmembrane-sensing and kinase control modules (7). The recent solution structure of an archaeal HAMP domain demonstrates that it adopts a homodimeric four-helical parallel coiled-coil conformation (10). The adaptation and protein interaction regions are composed of a continuous four-helix antiparallel coiled coil with a hairpin at its distal end (11) and contain key methyl-accepting residues (12, 13) and interaction sites for the CheA kinase (11, 14, 15), respectively. The conformational changes resulting from binding of an attractant result in decreased kinase activity (7, 9). Chemoreceptor methylation reverses these conformational changes and results in an increase in kinase activity (7, 16, 17).
Although atomic structures for several chemoreceptor domain fragments have been determined (8, 10, 11), the molecular architectures of intact chemoreceptor homodimers, or of the functionally relevant trimer-of-dimers configuration (3–6), have remained inaccessible to direct structural approaches. Moreover, the conformational changes involved in signaling are poorly understood. Here we present the architecture of the full-length serine chemoreceptor, Tsr from E. coli. We show that Tsr forms trimers of receptor dimers that display two distinct states in which the HAMP domains are present in either compact or expanded conformations, and we demonstrate how ligand binding and methylation modulate this conformational equilibrium.
Results and Discussion
Cryo-electron Tomography of Overproduced TsrQEQE in Whole E. coli Cells.
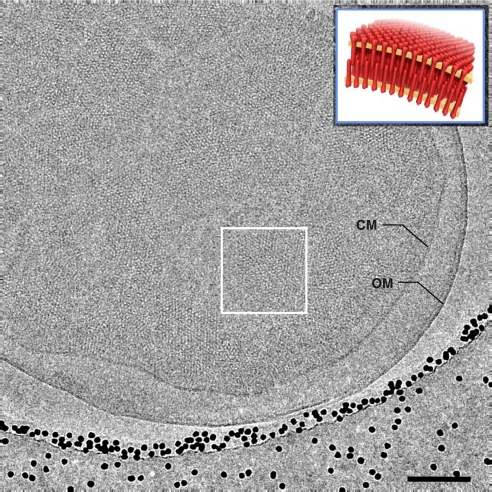
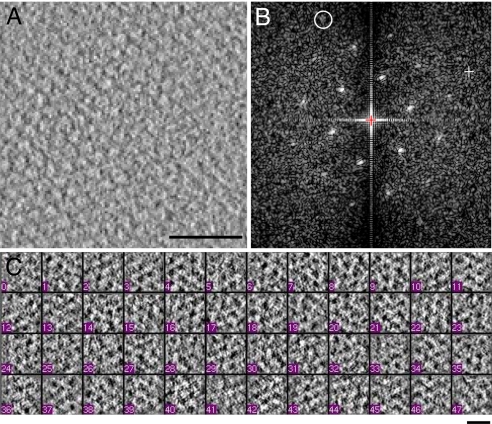
To determine the architecture of full-length chemoreceptors, we first carried out cryo-electron tomography on frozen-hydrated cells engineered to overproduce wild-type Tsr (TsrQEQE). The high levels of chemoreceptor expressed under these conditions result in the formation of small two-dimensional crystalline chemoreceptor patches (18, 19), which were evident in projection images (Fig. 1). Within these patches, chemoreceptors are organized in “zippers” (Fig. 1 Inset) that are formed by invaginations of the cytoplasmic membrane in which the cytoplasmic ends of chemoreceptors in the upper layer interact with the cytoplasmic ends of the chemoreceptors in the lower layer (Fig. 1 Inset) (18). The intrinsic order in chemoreceptor assemblies was observed in reconstructed tomograms, as illustrated in a 4-nm slice from a tomogram of a region of the cell containing a chemoreceptor assembly (Fig. 2A). The order (unit cell dimensions ≈ 75 Å) in individual patches typically extends to ≈33 Å (Fig. 2B), which represents a lower limit to the in-plane resolution of the tomogram.
Fig. 1.
Cryo-electron microscopy of Tsr chemoreceptor assemblies in whole E. coli cells. Shown is a projection image recorded from a plunge-frozen E. coli cell engineered to overproduce TsrQEQE (in the absence of serine) by using low-dose cryo-electron microscopy. The projection image shows patches of chemoreceptor assemblies in the native cytoplasmic membrane (CM) contained within a cell with an intact outer membrane (OM). The cell is close to the edge of a hole in a holey carbon grid containing vitreous ice; the black dots are 15-nm gold particles added for use as fiducial markers in tomogram reconstruction. (Inset) A schematic perspective view of “zipper”-like chemoreceptor assemblies from a region such as that enclosed by the white box. (Scale bar: 100 nm.)
Fig. 2.
Cryo-electron tomographic analysis of crystalline Tsr assemblies. (A and B) A 4-nm-thick tomographic slice from a region of a reconstructed tomogram of whole cells containing receptor arrays, and its Fourier transform, respectively. The circled diffraction spot in B is at a resolution of ≈33 Å. (C) Representative examples of tomographic slices corresponding to local receptor clusters extracted from whole cell tomograms. [Scale bars: 50 nm (A) and 10 nm (C).]
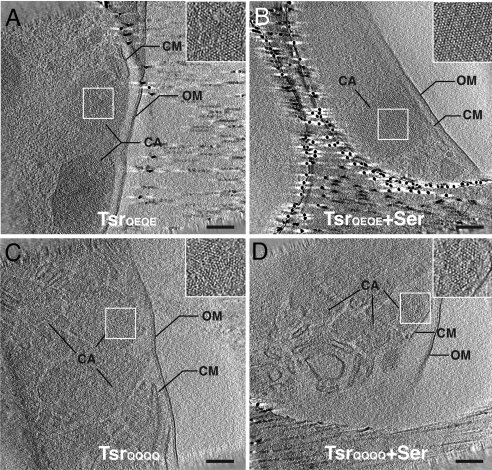
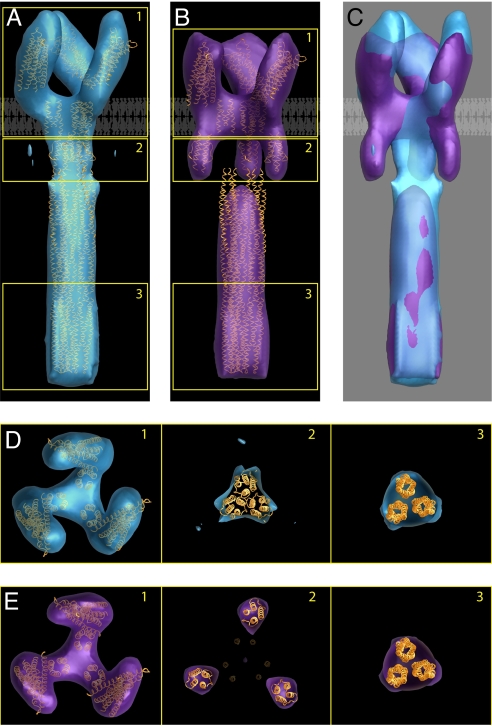
To obtain structural information for the chemoreceptors, we started with tomograms of individual patches from cells overproducing TsrQEQE and applied image-averaging methods similar to those used in electron crystallography of two-dimensional protein crystals combined with three-dimensional alignment procedures similar to those used in single-particle analysis (see Materials and Methods). Guided by the local lattice vectors of the partially ordered patches, we first extracted the subvolumes corresponding to the repeating units (Fig. 2C). These subvolumes were then subjected to several rounds of alignment, first within a single patch and subsequently over many patches derived from multiple cells. The aligned subvolumes were then subjected to 3D classification to determine the major conformations present in the chemoreceptor population. Ordered arrays were observed in cells expressing both TsrQEQE and TsrQQQQ and in the absence or presence of added serine (Fig. 3). The classification analysis resulted in the identification of two major clusters, and units within each cluster were then averaged separately to generate the corresponding conformational states (Fig. 4). The resolution of the 3D density maps for each class average is ≈33 Å as determined by estimates of the resolution at which the Fourier shell correlation coefficient between two halves of the data decreases to a value of 0.5.
Fig. 3.
Cryo-electron tomography of Tsr chemoreceptor assemblies in whole E. coli cells. Shown are tomographic slices (≈10 nm thick) generated from E. coli cells engineered to overproduce TsrQEQE in the absence (A) or presence (B) of serine (Ser), and TsrQQQQ in the in the absence (C) or presence (D) of serine. Chemoreceptor assemblies (CA) are observed as crystalline patches embedded in cytoplasmic membrane (CM). The crystalline patches are observed throughout the cells and are contained by the outer membrane (OM); an expanded view of the patches is shown in the Inset to each panel. (Scale bars: 100 nm.)
Fig. 4.
Identification of two trimeric Tsr conformations and interpretation of the density maps in terms of known structures of subdomains. Averaged density maps of TsrQEQE in both the compact (A) and expanded (B) conformations, with structural coordinates corresponding to chemoreceptor models fitted to a single trimer of receptor dimers. (C) Superposition of the two density maps highlighting overlap in the cytoplasmic domain and differences in the HAMP and periplasmic domains. A schematic view of the lipid bilayer is shown to highlight the locations of the putative transmembrane region in A–C. (D) Sections of the map from regions marked 1–3 in A correspond to the periplasmic domain, HAMP domain, and end of the cytoplasmic domain, respectively. Densities corresponding to each of these regions can be unambiguously assigned, although the map is not at a resolution where the rotational orientations of the individual domains can be determined. (E) Sections from the map shown in B displayed as described for D. The density in the cytoplasmic domain (section 3) was fit with a trimer obtained from three monomers derived from the structure of this region in the serine chemoreceptor Tsr reported by Kim et al. (11). Note that the packing of the trimer in our map is different from the organization of monomers reported in the crystals used to determine the structure (37) (PDB ID code 1QU7). Both conformations are interpreted by using the same packing arrangement in the cytoplasmic domain.
Chemoreceptors Adopt Two Distinct Conformations.
Inspection of density maps for TsrQEQE confirmed that chemoreceptors are indeed organized as trimers of receptor dimers in the cytoplasmic membrane, as anticipated from numerous biochemical, structural, and modeling studies (4, 11, 20). Each repeating unit consists of a longitudinal density ≈203 Å in length corresponding to the cytoplasmic domain of the receptor and a 77-Å overlap region where the cytoplasmic ends of apposing chemoreceptor dimers interact. Previous analysis of negatively stained membrane assemblies (19) has provided similar estimates of ≈189 Å and ≈65 Å for lengths of the cytoplasmic domain and the overlap regions, respectively. The locations of the individual chemoreceptor modules including the signaling region, the HAMP domain, and the periplasmic sensing domain were unambiguously identified based on the shape of intact, membrane-embedded receptors revealed by electron microscopy (19) and by the organization of the chemoreceptor polypeptide (7). We therefore placed the corresponding coordinates of these domains, which were previously derived by x-ray crystallography (8, 11) and NMR (10) studies, into the density maps.
Overall, the two conformations that we obtained display similar features in the C-terminal kinase control module. There are some noticeable differences in the density corresponding to the transmembrane region, but these are not readily interpretable or necessarily significant because they are the most poorly defined regions of the map for two separate reasons. First, because of the missing wedge in data collection for electron tomography, the resolution in the direction along the electron beam is poorer than it is in the plane perpendicular to the beam (21), resulting in poorer resolution of the density profile of the membrane along the length of the receptor. Second, components of the receptor in the aqueous phase are detected in cryo-electron microscopic images by virtue of contrast between the protein and the aqueous phase. However, detection of the components of the protein in the lipid bilayer relies on the much poorer contrast between the protein and the rest of the components of the lipid bilayer (mainly lipids). As a result, the map in the region within the lipid bilayer is noisier and therefore less reliable. Thus, chemoreceptor density in the transmembrane regions were approximated by using standard α-helices following the model suggested by Kim et al. (22) because our map is unreliable in this region.
The most striking difference between the two conformations is in the position of the HAMP domains relative to the rest of the chemoreceptors in the trimer unit. In the compact conformation shown in Fig. 4A (cross-sectional views shown in Fig. 4D) the density corresponding to the HAMP domains is continuous with the density arising from the cytoplasmic signaling domain. However, in the expanded conformation shown in Fig. 4B (cross-sectional views shown in Fig. 4E), the HAMP domains from each of the three Tsr dimers within the trimeric unit are displaced outward by ≈25 Å. The maps also indicate that there must be significant differences between the two conformations at the junction between the HAMP and cytoplasmic domains. However, at the present resolution of our maps, the density for the connecting regions is not clearly visible in the expanded conformation, and we have therefore not explicitly interpreted this region in terms of changes in conformation of the cytoplasmic region. The location of the HAMP domains in the expanded conformation shown in Fig. 4B implies that portions of the cytoplasmic region are likely to be splayed outward at the interface joining these two chemoreceptor modules. The positions of the HAMP domains within the expanded trimer are reminiscent of the splayed-out conformation of the upper portion of the Tsr signaling domain that was determined by using x-ray crystallography (11). The expanded HAMP conformation also demonstrates a small reduction (≈8%) in the overall trimer height when compared to the compact conformation, which may be the result of conformational changes within chemoreceptor trimers that occur during signaling. In both conformations, the density map shows a clockwise rotation when the map is sectioned from the periplasmic region to the HAMP domains (as viewed from the top, Fig. 4 D and E, sections 1 and 2), which is consistent with a tilted orientation of the periplasmic domain relative to the membrane normal. The extent of the twist is slightly larger in the compact conformation than in the expanded conformation (compare Fig. 4 A and B, section 1) and is compensated with a further counterclockwise rotation between the HAMP domain and the top of the cytoplasmic domain, restoring the register of the two conformations in the cytoplasmic domain [see supporting information (SI) Movie S1 for greater detail].
Effects of Ligand Binding and Methylation on Chemoreceptor Conformations.
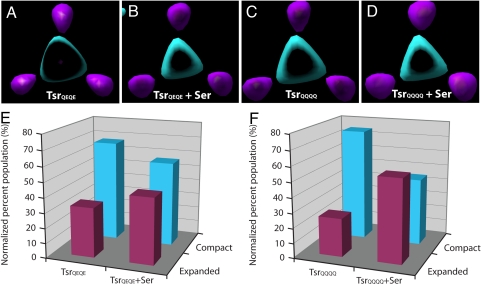
To determine the effects of ligand binding and methylation on the conformation of TsrQEQE, tomographic volumes were generated for TsrQEQE in the presence of the attractant serine and for fully methylated TsrQQQQ in both the absence and the presence of serine. Tomographic volumes for each Tsr variant demonstrated the formation of crystalline chemoreceptor patches with similar hexagonal packing arrangements (Fig. 3 Insets). These patches were subjected to the same averaging and alignment procedures as described above. For each Tsr variant analyzed, the classification resulted in the identification of two dominant clusters, and each cluster was then averaged separately to generate the corresponding conformational states. As in the case of TsrQEQE in the absence of serine, refinement of the two clusters led to the generation of density maps that displayed two distinct chemoreceptor arrangements for each Tsr variant, with primary differences in the position of the HAMP domains in either compact or expanded conformations (Fig. 5 A–D). Quantitative analysis of the relative amounts of chemoreceptors that adopt either the compact or expanded conformations for each of these conditions reveals the structural consequences of ligand binding and methylation. In the absence of added serine, the percentage of chemoreceptors with compact versus expanded HAMP domain conformations in cells expressing TsrQEQE is ≈67% and ≈33%, respectively (Fig. 5E). This distribution was altered with the addition of serine (TsrQEQE+Ser), which resulted in an increase in the proportion of chemoreceptors in the expanded conformation to ≈44% (Fig. 5E). In fully methylated TsrQQQQ and in the absence of serine, the proportion of chemoreceptors in the expanded and compact conformations is ≈25% and ≈75%, respectively. However, serine binding to TsrQQQQ results in a change in proportion of the two states similar to that seen with TsrQEQE (Fig. 5F). Thus, we demonstrate that binding of serine causes an increase in the proportion of chemoreceptors that have the HAMP domains in the expanded conformation regardless of the initial methylation state of the receptor. In the absence of added serine, an increase in chemoreceptor methylation causes an increase in the proportion of chemoreceptors that have the HAMP domains in the compact conformation.
Fig. 5.
Effects of ligand binding and chemoreceptor methylation on the distribution of Tsr conformations. Tomographic volumes were generated for TsrQEQE and the fully methylated TsrQQQQ variants of Tsr in the absence and presence of the attractant serine (Ser), and the distribution of compact or expanded conformations of the HAMP domains was compared. Shown are sectional views from superimposed density maps of each Tsr variant, TsrQEQE (A), TsrQEQE+Ser (B), TsrQQQQ (C), and TsrQQQQ+Ser (D) demonstrating the compact (cyan) and expanded (magenta) conformation of the HAMP domain (as shown in Fig. 4, section 2). (E) Addition of the ligand serine to the TsrQEQE variant causes an increase in the proportion of receptors with an expanded conformation (magenta bars) of the HAMP domain and a concomitant decrease in the proportion of receptors in the compact conformation (cyan bars). Conversely, methylation of Tsr (TsrQQQQ) causes an increase in the proportion of the receptors in the compact state (compare TsrQEQE from E with TsrQQQQ from F). (F) Ligand binding to the TsrQQQQ variant causes a conformational shift similar to that seen in E for TsrQEQE.
The Two-State Chemoreceptor Model and Conformational Signaling.
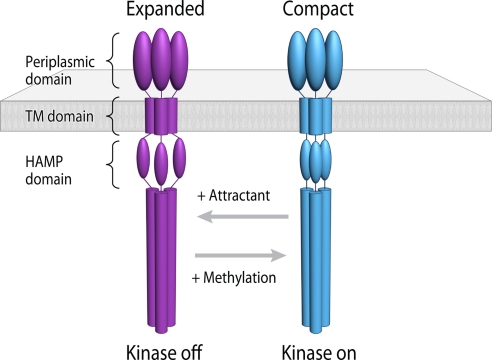
The coexistence of two distinct trimeric chemoreceptor conformations, with major differences in the position of their HAMP domains and with an overall twisted trimer-of-dimers architecture, provides an attractive solution to a longstanding question about the conformational mechanisms involved in signal transduction by chemoreceptors. Based on our results and the known effects of attractant binding and methylation on CheA kinase activity (7, 9, 16, 17, 23–26), we are able to propose a model for conformational signaling via bacterial chemoreceptors. Chemoreceptors exist in an equilibrium, in which their HAMP domains are in flux between compact and expanded conformations (Fig. 6). Binding of the attractant serine to Tsr trimers initiates a conformational change that is propagated to the HAMP domain, causing its displacement (Fig. 6). Crystallographic studies of the aspartate receptor in the ligand-free and ligand-bound forms suggests that ligand binding causes a rotation of the monomers in the periplasmic domain relative to each other in the chemoreceptor homodimer (8, 27). Independently, extensive biochemical and cross-linking analyses have led to models in which the signal of ligand binding is communicated across the membrane by small vertical displacement of the transmembrane regions of the receptor (9, 28) and/or by rotational displacements initiated at the periplasmic domain (29) and the HAMP domain (10). Because the conformational changes that result from attractant binding are known to lower CheA kinase activity (7, 9), the expanded conformation of the HAMP domain must correspond to the “kinase-off” state. Similarly, an increase in chemoreceptor methylation results in structural changes (16, 17) that shift the equilibrium in favor of the compact HAMP arrangement, corresponding to the “kinase-on” state (Fig. 6). This type of movement in the HAMP domains is also consistent with the changes observed in fluorescence anisotropy of YFP-labeled chemoreceptors in response to attractant and repellant signals interpreted to arise from movements of the trimer arms (26).
Fig. 6.
A two-state model describing conformational signaling in chemoreceptor trimers. Trimeric chemoreceptors exist in an equilibrium between two conformations and adopt either expanded or compact arrangements of the HAMP signaling domain. Binding of the attractant serine initiates movement in the transmembrane helix (9), which, in turn, shifts the conformational equilibrium of the HAMP domain in favor of the expanded conformation (magenta). Based on the known effects of serine binding to reduce the activity of the CheA kinase, we propose that this expanded conformation of the HAMP domain corresponds to the “kinase-off” state. Conversely, an increase in chemoreceptor methylation shifts the equilibrium in favor of the compact HAMP conformation (cyan), corresponding to the “kinase-on” state.
The approach we have used here is a hybrid between techniques used to determine membrane protein structure by electron crystallography and cellular architecture using cryo-electron tomography, in combination with 3D classification. This analysis has led to the identification of two distinct conformational states of the chemoreceptor Tsr in its trimeric organization and has demonstrated the propensity of HAMP domains to be present in two distinct spatial positions relative to the rest of the trimer unit. The results presented here provide the first direct structural evidence for the two-state chemoreceptor-signaling model and demonstrate that ligand binding and methylation can modulate the conformational equilibrium of chemoreceptors. However, it remains to be seen whether similar conformational states are also observed in the presence of CheA and CheW and in the context of wild-type chemoreceptor arrays (30) and whether the homotypic interactions of the chemoreceptors at the cytoplasmic end lead to differences in the extent or nature of the structural change as compared with chemoreceptor–CheA interactions. This is especially interesting because our previous analyses have shown that chemoreceptor “zippers” can coexist with chemoreceptor/CheA/CheW complexes in cells where Tsr is selectively overproduced (30), suggesting that axial receptor–receptor interactions in the “zipper” region may mimic receptor–CheA/CheW interactions in the wild-type signaling array. Furthermore, the “zipper”-like arrangement may inhibit larger-scale arrangements of the receptors that may include intertwined trimers of dimers that have been proposed to be involved in kinase down-regulation (22, 31). Application of the methodologies developed here to chemoreceptor arrays in wild-type E. coli cells and those of other Gram-negative bacteria (32) should help further elucidate the conformational changes involved in chemotaxis signaling.
Materials and Methods
Bacterial Strains, Plasmids, and Culture Conditions.
All expression studies were carried out with E. coli strain HCB721, which lacks expression of the chemotaxis-related proteins Tar, Tsr, Trg, Tap, CheA, CheW, CheR, and CheB and is an isogenic derivative of E. coli strain K12 strain RP437 (32). HCB721 cells were transformed with pHSe5.tsrQEQE or pHSe5.tsrQQQQ plasmids to overproduce Tsr as described previously (19). The cells were grown at 27°C in tryptone broth (1.0% tryptone and 0.5% NaCl) in the presence of ampicillin (100 μg/ml) to OD600 of 0.1, and Tsr expression was induced by the addition of isopropyl-β-d- thiogalactopyranoside (IPTG, 1 mM) for 3–4 h.
Cryo-electron Tomography.
A 3- to 5-μl aliquot of cells (OD600 ≈ 0.5) was withdrawn directly from a culture and immediately placed on a MultiA Quantifoil grid (Micro Tools), which had been precoated with gold beads (15 nm) to serve as fiducial markers. The grids were manually blotted and plunged into cold liquid ethane maintained at approximately −180°C. The grids were then placed in cartridges and loaded into the cryotransfer system of a Polara G2 microscope (FEI). This microscope is equipped with a field emission gun operating at 300 kV, and a 2K × 2K CCD camera mounted at the end of a GIF 2000 energy filter (Gatan). A series of low-dose projection images of whole cells spanning a tilt angle range from −70° to 70° in 1–3° intervals was recorded at liquid nitrogen temperatures in the zero-loss mode with a 30-eV slit at effective magnifications of ×44,000 and underfocus values ranging from 5 to 8 μm. The total dose used for each tilt series was typically ≈60–80 electrons per square angstrom.
Tomographic Reconstruction and Three-Dimensional Averaging.
For all Tsr variants, a series of two-dimensional tilted projection images (tilt series) were converted into three-dimensional density maps (tomograms) by using the weighted back-projection algorithm from the IMOD software package (33). Using the repeating chemoreceptor units from the TsrQEQE variant, an initial rough model was generated by using an approach for 3D averaging based on principles described by Winkler (34). Specifically, crystalline patches were selected from the tomogram, and the volume corresponding to a small repeating unit was selected to search the entire volume to generate a set of subvolumes. This search was guided by determination of the local lattice vectors of the partially ordered patches. The subvolumes were then subjected to several rounds of alignment. The aligned subvolumes were then projected along the z axis, and the resulting 2D projection images were classified by using EMAN software (35). The dominant class was used as a new reference for further alignment of a total of 750 subvolumes collected from six crystalline patches of the TsrQEQE variant, and these aligned volumes were averaged together to generate a single density map that served as a rough starting model.
With this starting model, 3,972 TsrQEQE subvolumes, 23,505 TsrQEQE plus serine (10 mM) subvolumes, 3,797 TsrQQQQ subvolumes, and 12,783 TsrQQQQ plus serine (10 mM) subvolumes were aligned by using the grid-threading Monte Carlo searching algorithm described previously (36). Analysis of the correlation coefficients among the aligned subvolumes identified two major clusters for each Tsr variant. The average of these two clusters led to two conformational states as templates with a weighting factor depending on the correlation coefficient between a subvolume and the template:
Here w(i) and Ci are the weight of subvolume i and correlation between it and the template. C̄ and δC are the average and the standard deviation of correlation coefficients of all subvolumes. a and b are two parameters, typically with values of 2 and 0, respectively, that define the dependence of the weight on correlation coefficient distribution.
Using these averaged volumes as templates, further alignment and weighted averaging were performed until no significant changes could be observed in alignments and averaged maps (final maps for TsrQEQE are shown in Fig. 3). The largest differences between the two averaged maps exist in the region corresponding to the HAMP domains, which are arranged in either compact or expanded conformations. For each Tsr variant, the distribution between the compact and expanded conformations was normalized to 100% based on the total number of subvolumes in each class to facilitate comparisons between experimental conditions. The atomic models of the chemoreceptor domains [Tsr periplasmic domain (37) (PDB ID code 1VLS), the HAMP domain from an archaeal protein (10) (PDB ID code 2ASW) and a modeled transmembrane domain (18)] were initially placed manually into the density map and subsequently refined by using the local map-fitting feature in the software package Chimera (38).
Supplementary Material
Acknowledgments.
We thank Drs. Martin Kessel and Mario J. Borgnia for insightful comments and Ethan Tyler and Alan Hoofring for expert assistance with preparation of the figures. This work was supported by funds from the intramural research program of the National Cancer Institute, National Institutes of Health.
Footnotes
The authors declare no conflict of interest.
This article is a PNAS Direct Submission.
This article contains supporting information online at www.pnas.org/cgi/content/full/0806401105/DCSupplemental.
References
- 1.Wadhams GH, Armitage JP. Making sense of it all: Bacterial chemotaxis. Nat Rev Mol Cell Biol. 2004;5:1024–1037. doi: 10.1038/nrm1524. [DOI] [PubMed] [Google Scholar]
- 2.Webre DJ, Wolanin PM, Stock JB. Modulated receptor interactions in bacterial transmembrane signaling. Trends Cell Biol. 2004;14:478–482. doi: 10.1016/j.tcb.2004.07.015. [DOI] [PubMed] [Google Scholar]
- 3.Boldog T, Grimme S, Li M, Sligar SG, Hazelbauer GL. Nanodiscs separate chemoreceptor oligomeric states and reveal their signaling properties. Proc Natl Acad Sci USA. 2006;103:11509–11514. doi: 10.1073/pnas.0604988103. [DOI] [PMC free article] [PubMed] [Google Scholar]
- 4.Studdert CA, Parkinson JS. Insights into the organization and dynamics of bacterial chemoreceptor clusters through in vivo crosslinking studies. Proc Natl Acad Sci USA. 2005;102:15623–15628. doi: 10.1073/pnas.0506040102. [DOI] [PMC free article] [PubMed] [Google Scholar]
- 5.Studdert CA, Parkinson JS. In vivo crosslinking methods for analyzing the assembly and architecture of chemoreceptor arrays. Methods Enzymol. 2007;423:414–431. doi: 10.1016/S0076-6879(07)23019-8. [DOI] [PubMed] [Google Scholar]
- 6.Ames P, Studdert CA, Reiser RH, Parkinson JS. Collaborative signaling by mixed chemoreceptor teams in Escherichia coli. Proc Natl Acad Sci USA. 2002;99:7060–7065. doi: 10.1073/pnas.092071899. [DOI] [PMC free article] [PubMed] [Google Scholar]
- 7.Hazelbauer GL, Falke JJ, Parkinson JS. Bacterial chemoreceptors: High-performance signaling in networked arrays. Trends Biochem Sci. 2008;33:9–19. doi: 10.1016/j.tibs.2007.09.014. [DOI] [PMC free article] [PubMed] [Google Scholar]
- 8.Yeh JI, et al. High-resolution structures of the ligand binding domain of the wild-type bacterial aspartate receptor. J Mol Biol. 1996;262:186–201. doi: 10.1006/jmbi.1996.0507. [DOI] [PubMed] [Google Scholar]
- 9.Falke JJ, Hazelbauer GL. Transmembrane signaling in bacterial chemoreceptors. Trends Biochem Sci. 2001;26:257–265. doi: 10.1016/s0968-0004(00)01770-9. [DOI] [PMC free article] [PubMed] [Google Scholar]
- 10.Hulko M, et al. The HAMP domain structure implies helix rotation in transmembrane signaling. Cell. 2006;126:929–940. doi: 10.1016/j.cell.2006.06.058. [DOI] [PubMed] [Google Scholar]
- 11.Kim KK, Yokota H, Kim SH. Four-helical-bundle structure of the cytoplasmic domain of a serine chemotaxis receptor. Nature. 1999;400:787–792. doi: 10.1038/23512. [DOI] [PubMed] [Google Scholar]
- 12.Kehry MR, Dahlquist FW. The methyl-accepting chemotaxis proteins of Escherichia coli. Identification of the multiple methylation sites on methyl-accepting chemotaxis protein I. J Biol Chem. 1982;257:10378–10386. [PubMed] [Google Scholar]
- 13.Krikos A, Mutoh N, Boyd A, Simon MI. Sensory transducers of E. coli are composed of discrete structural and functional domains. Cell. 1983;33:615–622. doi: 10.1016/0092-8674(83)90442-7. [DOI] [PubMed] [Google Scholar]
- 14.Bass RB, Coleman MD, Falke JJ. Signaling domain of the aspartate receptor is a helical hairpin with a localized kinase docking surface: Cysteine and disulfide scanning studies. Biochemistry. 1999;38:9317–9327. doi: 10.1021/bi9908179. [DOI] [PMC free article] [PubMed] [Google Scholar]
- 15.Bass RB, Falke JJ. Detection of a conserved alpha-helix in the kinase-docking region of the aspartate receptor by cysteine and disulfide scanning. J Biol Chem. 1998;273:25006–25014. doi: 10.1074/jbc.273.39.25006. [DOI] [PMC free article] [PubMed] [Google Scholar]
- 16.Lai WC, Beel BD, Hazelbauer GL. Adaptational modification and ligand occupancy have opposite effects on positioning of the transmembrane signalling helix of a chemoreceptor. Mol Microbiol. 2006;61:1081–1090. doi: 10.1111/j.1365-2958.2006.05296.x. [DOI] [PubMed] [Google Scholar]
- 17.Starrett DJ, Falke JJ. Adaptation mechanism of the aspartate receptor: Electrostatics of the adaptation subdomain play a key role in modulating kinase activity. Biochemistry. 2005;44:1550–1560. doi: 10.1021/bi048089z. [DOI] [PMC free article] [PubMed] [Google Scholar]
- 18.Lefman J, et al. Three-dimensional electron microscopic imaging of membrane invaginations in Escherichia coli overproducing the chemotaxis receptor Tsr. J Bacteriol. 2004;186:5052–5061. doi: 10.1128/JB.186.15.5052-5061.2004. [DOI] [PMC free article] [PubMed] [Google Scholar]
- 19.Weis RM, et al. Electron microscopic analysis of membrane assemblies formed by the bacterial chemotaxis receptor Tsr. J Bacteriol. 2003;185:3636–3643. doi: 10.1128/JB.185.12.3636-3643.2003. [DOI] [PMC free article] [PubMed] [Google Scholar]
- 20.Shimizu TS, et al. Molecular model of a lattice of signalling proteins involved in bacterial chemotaxis. Nat Cell Biol. 2000;2:792–796. doi: 10.1038/35041030. [DOI] [PubMed] [Google Scholar]
- 21.Subramaniam S, Milne JL. Three-dimensional electron microscopy at molecular resolution. Annu Rev Biophys Biomol Struct. 2004;33:141–155. doi: 10.1146/annurev.biophys.33.110502.140339. [DOI] [PubMed] [Google Scholar]
- 22.Kim SH, Wang W, Kim KK. Dynamic and clustering model of bacterial chemotaxis receptors: Structural basis for signaling and high sensitivity. Proc Natl Acad Sci USA. 2002;99:11611–11615. doi: 10.1073/pnas.132376499. [DOI] [PMC free article] [PubMed] [Google Scholar]
- 23.Coleman MD, Bass RB, Mehan RS, Falke JJ. Conserved glycine residues in the cytoplasmic domain of the aspartate receptor play essential roles in kinase coupling and on-off switching. Biochemistry. 2005;44:7687–7695. doi: 10.1021/bi0501479. [DOI] [PMC free article] [PubMed] [Google Scholar]
- 24.Irieda H, Homma M, Homma M, Kawagishi I. Control of chemotactic signal gain via modulation of a pre-formed receptor array. J Biol Chem. 2006;281:23880–23886. doi: 10.1074/jbc.M600018200. [DOI] [PubMed] [Google Scholar]
- 25.Vaknin A, Berg HC. Osmotic stress mechanically perturbs chemoreceptors in Escherichia coli. Proc Natl Acad Sci USA. 2006;103:592–596. doi: 10.1073/pnas.0510047103. [DOI] [PMC free article] [PubMed] [Google Scholar]
- 26.Vaknin A, Berg HC. Physical responses of bacterial chemoreceptors. J Mol Biol. 2007;366:1416–1423. doi: 10.1016/j.jmb.2006.12.024. [DOI] [PMC free article] [PubMed] [Google Scholar]
- 27.Chi YI, Yokota H, Kim SH. Apo structure of the ligand-binding domain of aspartate receptor from Escherichia coli and its comparison with ligand-bound or pseudoligand-bound structures. FEBS Lett. 1997;414:327–332. doi: 10.1016/s0014-5793(97)01027-2. [DOI] [PubMed] [Google Scholar]
- 28.Chervitz SA, Falke JJ. Molecular mechanism of transmembrane signaling by the aspartate receptor: A model. Proc Natl Acad Sci USA. 1996;93:2545–2550. doi: 10.1073/pnas.93.6.2545. [DOI] [PMC free article] [PubMed] [Google Scholar]
- 29.Irieda H, Homma M, Homma M, Kawagishi I. Control of chemotactic signal gain via modulation of a pre-formed receptor array. J Biol Chem. 2006;281:23880–23886. doi: 10.1074/jbc.M600018200. [DOI] [PubMed] [Google Scholar]
- 30.Zhang P, Khursigara CM, Hartnell LM, Subramaniam S. Direct visualization of Escherichia coli chemotaxis receptor arrays using cryo-electron microscopy. Proc Natl Acad Sci USA. 2007;104:3777–3781. doi: 10.1073/pnas.0610106104. [DOI] [PMC free article] [PubMed] [Google Scholar]
- 31.Bray D, Williams D. How the “melting” and “freezing” of protein molecules may be used in cell signaling. ACS Chem Biol. 2008;3:89–91. doi: 10.1021/cb800024g. [DOI] [PubMed] [Google Scholar]
- 32.Khursigara CM, et al. Chemoreceptors in Caulobacter crescentus: Trimers of receptor dimers in a partially ordered hexagonally packed array. J Bacteriol. 2008;190:6805–6810. doi: 10.1128/JB.00640-08. [DOI] [PMC free article] [PubMed] [Google Scholar]
- 33.Parkinson JS, Houts SE. Isolation and behavior of Escherichia coli deletion mutants lacking chemotaxis functions. J Bacteriol. 1982;151:106–113. doi: 10.1128/jb.151.1.106-113.1982. [DOI] [PMC free article] [PubMed] [Google Scholar]
- 34.Kremer JR, Mastronarde DN, McIntosh JR. Computer visualization of three-dimensional image data using IMOD. J Struct Biol. 1996;116:71–76. doi: 10.1006/jsbi.1996.0013. [DOI] [PubMed] [Google Scholar]
- 35.Winkler H. 3D reconstruction and processing of volumetric data in cryo-electron tomography. J Struct Biol. 2007;157:126–137. doi: 10.1016/j.jsb.2006.07.014. [DOI] [PubMed] [Google Scholar]
- 36.Ludtke SJ, Baldwin PR, Chiu W. EMAN: Semiautomated software for high-resolution single-particle reconstructions. J Struct Biol. 1999;128:82–97. doi: 10.1006/jsbi.1999.4174. [DOI] [PubMed] [Google Scholar]
- 37.Wu X, et al. A core-weighted fitting method for docking atomic structures into low-resolution maps: Application to cryo-electron microscopy. J Struct Biol. 2003;141:63–76. doi: 10.1016/s1047-8477(02)00570-1. [DOI] [PMC free article] [PubMed] [Google Scholar]
- 38.Milburn MV, et al. Three-dimensional structures of the ligand-binding domain of the bacterial aspartate receptor with and without a ligand. Science. 1991;254:1342–1347. doi: 10.1126/science.1660187. [DOI] [PubMed] [Google Scholar]
- 39.Pettersen EF, et al. UCSF Chimera—A visualization system for exploratory research and analysis. J Comput Chem. 2004;25:1605–1612. doi: 10.1002/jcc.20084. [DOI] [PubMed] [Google Scholar]
Associated Data
This section collects any data citations, data availability statements, or supplementary materials included in this article.


