

Abstract
MicroRNAs (miRNAs) are small, noncoding RNAs that suppress gene expression at the posttranscriptional level via an antisense RNA-RNA interaction. miRNAs used for array-based profiling are generally purified from either snap-frozen or fresh samples. Because tissues found in most pathology departments are available only in formalin-fixed and paraffin-embedded (FFPE) states, we sought to evaluate miRNA derived from FFPE samples for microarray analysis. In this study, miRNAs extracted from matched snap-frozen and FFPE samples were profiled using the Agilent miRNA array platform (Agilent, Santa Clara, CA). Each miRNA sample was hybridized to arrays containing probes interrogating 470 human miRNAs. Seven cases were compared in either duplicate or triplicate. Intrachip and interchip analyses demonstrated that the processes of miRNA extraction, labeling, and hybridization from both frozen and FFPE samples are highly reproducible and add little variation to the results; technical replicates showed high correlations with one another (Kendall tau, 0.722 to 0.853; Spearman rank correlation coefficient, 0.891 to 0.954). Our results showed consistent high correlations between matched frozen and FFPE samples (Kendall tau, 0.669 to 0.815; Spearman rank correlation coefficient, 0.847 to 0.948), supporting the use of FFPE-derived miRNAs for array-based, gene expression profiling.
MicroRNAs (miRNAs) are a class of evolutionarily conserved, small (∼18- to 24-nucleotide) noncoding RNAs that negatively regulate gene expression in both plants and animals.1 Since their initial discovery, more than 400 human miRNAs have been cloned and sequenced, many of which are highly conserved between species,2,3,4 further supporting the idea that miRNAs are critical gene regulators.
Currently, it is estimated that up to 30% of protein coding genes might be regulated by miRNAs at the posttranscriptional level.4,5 Recent studies have demonstrated that miRNAs regulate various cell functions, including cell proliferation, differentiation, death, stress resistance, and fat metabolism.4,5,6 Accordingly, it is reasonable to suggest that abnormal miRNAs expression is likely to contribute to human disease, including cancer. Current research supports that view.7,8,9,10
Various methods have been implemented to profile miRNA expression patterns, including quantitative RT-PCR, microarray,11 and serial analysis of gene expression.12 Regardless of the approach, the successful application of these techniques is largely limited by the availability of fresh or frozen clinical samples, which are considered to be the most reliable source of intact RNA in general. The more broadly available formalin-fixed, paraffin-embedded (FFPE) samples with their detailed clinical annotation have not been systematically investigated with respect to the quality of miRNA derived from them. It is postulated that miRNAs may be less affected than mRNAs by formalin fixation and paraffin embedding, perhaps due to their slower degradation,13 smaller size, and lack of poly A tails.1 Initial studies have shown good correlation between matched frozen and FFPE miRNA profiles using either an RNA-primed, array-based Klenow enzyme microarray platform14 or locked nucleic acid-based miRNA arrays.1
In this study, we investigated the miRNA expression profiles of matched frozen and FFPE clinical samples using the Agilent microarray platform (Agilent, Santa Clara, CA).
Materials and Methods
Sample Collection
Matched frozen and FFPE samples of lymph node hyperplasia tissues were obtained from the Department of Pathology and Molecular Medicine, Kingston General Hospital. Snap-frozen samples were embedded in Optimal Cutting Temperature freezing medium and stored at −80°C until use. FFPE samples were made following routine formalin fixation and paraffin embedding protocols and stored at room temperature until use. Sample age ranged from 1 to 2 years. Seven anonymous paired lymphoid hyperplasia tissues were available for this study.
RNA Extraction
The miRNAeasy kit (Qiagen, Mississauga, Canada) was used to extract total RNA (including miRNA) from frozen samples. Briefly, about 30 mg of frozen tissue was disrupted using a tissue homogenizer in the presence of QIAzol lysis reagent. After a chloroform extraction, the aqueous phase was added to a column, and RNA was eluted in 60 μl water. The RecoverAll total RNA Isolation kit (Ambion, Streetsville, Canada) was used to extract total RNA (including miRNA) from FFPE samples. Three 20-μm slices were deparaffined with xylene, washed twice with ethanol, and digested with protease at 50°C for 3 hours. The lysate was passed through a filter cartridge, and RNA was eluted in 60 μl water. The quality of each sample was checked using an Agilent 2100 Bioanalyzer.
miRNA Expression Profiling
miRNAs were labeled using the Agilent miRNA labeling reagent and hybridized to Agilent human miRNA arrays. Total RNA (100 ng) was dephosphorylated and ligated with pCp-Cy3. Labeled RNA was purified and hybridized to Agilent miRNA arrays with eight identical arrays per slide, with each array containing probes interrogating 470 human miRNAs. Triplicate arrays were performed for two pairs of hyperplasia samples and duplicate arrays for three pairs of hyperplasia samples. Images were scanned with the Agilent microarray scanner (Agilent), gridded, and analyzed using Agilent feature extraction software version 9.5.3. Raw data are available on the National Center for Biotechnology Information Gene Expression Omnibus website (http://www.ncbi.nlm.nih.gov/geo/; last accessed July 29, 2008) using accession number GSE-12458.
Statistical Analysis
Following Agilent recommendations, no interarray normalization was applied, because the similarity between matched frozen and FFPE sample arrays was unknown. Kendall tau and Spearman rank correlation coefficients were calculated between technical replicates using either same tissue sample or same RNA pool on same or different slides to assess variations introduced by miRNA extraction, labeling, and hybridization and slide heterogeneity. miRNA signals from matched frozen and FFPE samples were line plotted together for visual comparison. Unsupervised clustering was performed on raw data using the web-based EBI profiler (http://www.ebi.ac.uk/microarray-srv/EP/cgi-bin/ep_ui.pl).
Results
RNA Quantity and Quality
Both frozen and matched FFPE samples yielded enough total RNA (5∼30 μg) for profiling. The quality check showed that the frozen samples retained a miRNA peak (18- to 24-nucleotides), whereas the same peak in FFPE sample was obscured by the degraded mRNAs, transfer RNA (tRNA), and ribosomal RNA (rRNA) (Figure 1, A and B, respectively), consistent with previous observations.15,16
Figure 1.
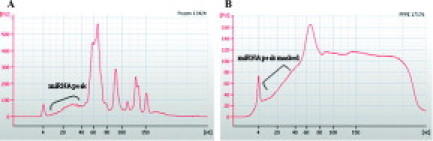
Effects of formalin fixation and paraffin embedding on miRNA. A: Frozen sample-derived total RNA electrophorogram on Agilent small RNA chip. B: FFPE-derived total RNA electrophorogram on Agilent small RNA chip.
Variation Due to Labeling and Hybridization
To identify variations that might be introduced at the labeling and hybridization steps, we analyzed the correlation of four pairs of duplicate arrays hybridized on the same slide. Results showed that duplicate arrays using a common RNA source were highly correlated (Figure 2) (Kendall tau, 0.804 to 0.853; Spearman rank correlation coefficient, 0.924 to 0.954). P values for these and all other correlations were less than 0.01.
Figure 2.
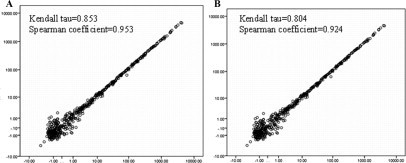
Scatter plots of replica frozen sample arrays (A) and replica FFPE sample arrays (B). x and y axes are on log scale.
Variation Due to RNA Extraction
To examine variations due to the RNA extraction protocol, we compared arrays on the same slide hybridized with miRNAs isolated in separate extractions from the same tissue. Results showed duplicate arrays using separate preparations of RNA from the same tissue source were highly correlated (Kendall tau, 0.722 to 0.847; Spearman rank correlation coefficient, 0.921 to 0.949) (Figure 3).
Figure 3.
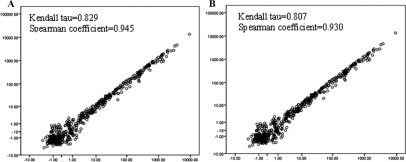
Comparison of miRNAs extracted from the same sample. x and y axes are on a log scale. A: Scatter plot of replica frozen sample arrays from separately extracted miRNA. B: Scatter plot of replica FFPE sample arrays from separately extracted miRNA.
Slide Variation
To assess slide to slide variation, we compared arrays on different slides using miRNAs extracted separately from the same sample. The results showed a slightly lower correlation (Kendall tau, 0.727 to 0.757; Spearman rank correlation coefficient, 0.891 to 0.912) (Figure 4).
Figure 4.
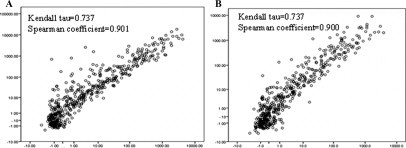
Comparisons of slide to slide variability. x and y axes are on a log scale. A: Scatter plot of replica frozen sample arrays from separately extracted miRNA on arrays on different slides. B: Scatter plot of replica FFPE sample arrays from separately extracted miRNA on arrays on different slides.
Correlation of miRNA Expression Profiles Between Matched Frozen and FFPE Samples
Because triplicate arrays were performed for two pairs of samples and duplicate arrays for the remaining three pairs, we had 32 comparisons between matched frozen and FFPE samples. Good correlations were found in all 32 comparisons (Table 1) (Kendall tau, 0.669 to 0.815; Spearman rank correlation coefficient, 0.847 to 0.948). Results from the independent correlation analysis methods matched each other well. Scatter plots for matched sample pairs with the best and worst correlations are shown in Figure 5, A and B, respectively. The correlations for each pair of samples is summarized in Table 2 (frozen versus frozen/FFPE versus FFPE/frozen versus FFPE). Unsupervised clustering showed that the matched samples generally clustered together (Figure 6).
Table 1.
Kendall tau and Spearman Rank Correlation Coefficients of 32 Comparisons between Frozen-Matched FFPE Sample Arrays
| Mean | Minimum | Maximum | SD | |
|---|---|---|---|---|
| Kendall tau | 0.744 | 0.669 | 0.815 | 0.033 |
| Spearman coefficient | 0.905 | 0.847 | 0.948 | 0.024 |
Figure 5.
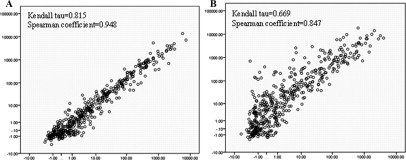
Scatter plots of frozen sample array versus matched FFPE sample array. y axis stands for frozen sample intensity on log scale. x axis stands for FFPE sample intensity on log scale. A: Scatter plot of our best correlation sample pair. B: Scatter plot of our worst correlation sample pair.
Table 2.
Summary of Correlation Analyses
| Sample 06-2817 |
Sample 05-11903 |
Sample 06-17176 |
|||||||
|---|---|---|---|---|---|---|---|---|---|
| Fr versus Fr | FF versus FF | Fr versus FF | Fr versus Fr | FF versus FF | Fr versus FF | Fr versus Fr | FF versus FF | Fr versus FF | |
| Spearman rank coefficient | |||||||||
| 0.948 | 0.890 | 0.909 | 0.935 | 0.942 | |||||
| 0.874 | 0.921 | 0.931 | |||||||
| 0.933 | 0.954 | 0.917 | |||||||
| 0.897 | |||||||||
| 0.908 | |||||||||
| 0.905 | |||||||||
| 0.875 | |||||||||
| 0.871 | |||||||||
| 0.862 | |||||||||
| Mean | N/A | N/A | 0.948 | N/A | N/A | 0.890 | 0.905 | 0.937 | 0.901 |
| SD | N/A | N/A | N/A | N/A | N/A | N/A | 0.030 | 0.017 | 0.027 |
| Kendall tau | |||||||||
| 0.815 | 0.716 | 0.739 | 0.788 | 0.798 | |||||
| 0.693 | 0.771 | 0.778 | |||||||
| 0.808 | 0.849 | 0.759 | |||||||
| 0.726 | |||||||||
| 0.747 | |||||||||
| 0.743 | |||||||||
| 0.704 | |||||||||
| 0.702 | |||||||||
| 0.689 | |||||||||
| Mean | N/A | N/A | 0.815 | N/A | N/A | 0.716 | 0.747 | 0.803 | 0.738 |
| SD | N/A | N/A | N/A | N/A | N/A | N/A | 0.058 | 0.041 | 0.037 |
| Sample 07-2248 |
Sample 05-11826 |
Sample 05-19322 |
Sample 05-2623 |
||||||||
|---|---|---|---|---|---|---|---|---|---|---|---|
| Fr versus Fr | FF versus FF | Fr versus FF | Fr versus Fr | FF versus FF | Fr versus FF | Fr versus Fr | FF versus FF | Fr versus FF | Fr versus Fr | FF versus FF | Fr versus FF |
| 0.912 | 0.891 | 0.929 | 0.947 | 0.949 | 0.897 | 0.921 | 0.936 | 0.930 | 0.945 | 0.930 | 0.921 |
| 0.901 | 0.900 | 0.847 | 0.895 | 0.917 | 0.908 | ||||||
| 0.953 | 0.924 | 0.856 | 0.906 | 0.915 | 0.913 | ||||||
| 0.917 | 0.913 | 0.913 | 0.924 | ||||||||
| 0.909 | |||||||||||
| 0.911 | |||||||||||
| 0.909 | |||||||||||
| 0.883 | |||||||||||
| 0.905 | |||||||||||
| 0.922 | 0.905 | 0.896 | 0.947 | 0.949 | 0.903 | 0.921 | 0.936 | 0.919 | 0.945 | 0.930 | 0.917 |
| 0.027 | 0.017 | 0.028 | N/A | N/A | 0.008 | N/A | N/A | 0.008 | N/A | N/A | 0.007 |
| 0.757 | 0.727 | 0.782 | 0.834 | 0.842 | 0.724 | 0.772 | 0.817 | 0.783 | 0.829 | 0.807 | 0.761 |
| 0.737 | 0.737 | 0.669 | 0.721 | 0.761 | 0.742 | ||||||
| 0.853 | 0.804 | 0.683 | 0.737 | 0.761 | 0.750 | ||||||
| 0.760 | 0.746 | 0.758 | 0.769 | ||||||||
| 0.755 | |||||||||||
| 0.760 | |||||||||||
| 0.747 | |||||||||||
| 0.723 | |||||||||||
| 0.752 | |||||||||||
| 0.782 | 0.756 | 0.737 | 0.834 | 0.842 | 0.732 | 0.772 | 0.817 | 0.766 | 0.829 | 0.807 | 0.756 |
| 0.062 | 0.042 | 0.038 | N/A | N/A | 0.012 | N/A | N/A | 0.012 | N/A | N/A | 0.012 |
Fr, Frozen sample; FF, FFPE sample. SD was calculated when applicable.
Figure 6.
Unsupervised clustering of 14 frozen sample arrays and 14 FFPE sample arrays.
Similarity of Individual miRNA Between Matched Frozen and FFPE Samples
A line plot was used to visually inspect the difference between individual miRNA expression levels in matched samples (Figure 7). Results suggested that miRNAs isolated from FFPE samples retain most of the characteristic expression pattern of the frozen counterpart. In cases where the FFPE-derived miRNA deviated from the frozen sample profile, no consistent pattern was found between samples.
Figure 7.
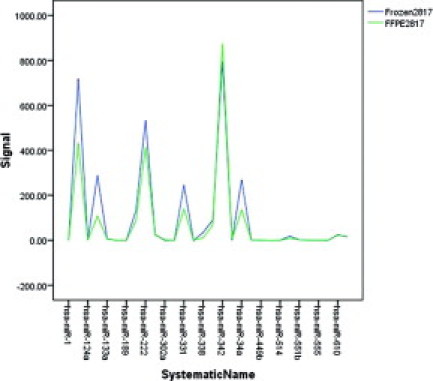
Line plot of 30 randomly chosen miRNAs comparing relative signal intensities from matched frozen sample and FFPE samples. Similar results were obtained with all 470 miRNAs profiled on the arrays (data not shown).
Discussion
miRNAs are critical gene regulators involved in various physiological and pathophysiological processes.17,18,19,20,21,22,23,24 Considering the large number of genes regulated by only several hundred miRNAs, it is very likely that gene silencing by miRNAs occurs in a combinatorial manner. As a result, parallel quantification of miRNAs by microarray is important in assessing the regulatory role of miRNA species. However, current miRNA expression profiling studies are largely limited by the availability of fresh or frozen samples, which are seen as the gold standard for purification of highly representative miRNAs. Although, it has been shown that detecting miRNA in FFPE sample is technically feasible,25,26 one unanswered question is whether FFPE sample can reliably reflect information retained in frozen samples. One of the difficulties is that the ability to perform adequate quality control for miRNAs is currently limited, especially for FFPE-derived material. Capillary electrophorograms of frozen sample-derived RNA show a clear miRNA species peak compared with those of FFPE-derived RNAs, which show a hump toward low molecular weight that is likely a mixture of miRNA and degraded larger RNA molecules (rRNA, tRNA, and mRNA). Without additional tools to assess quality of miRNAs in total, assessing the similarity of a profile to a putative “gold standard” profile remains the method of choice.
In this study, miRNA profiles of matched frozen and FFPE samples were compared on the Agilent miRNA array platform, which has several advantages. First, the 3′ end labeling method used for this platform is tolerant to nucleotide damage in substrate miRNAs as long as the 3′ end of target molecule remains intact.27 Second, highly specific probe sequences effectively distinguish targeted miRNAs from unintended mRNAs, making miRNA enrichment unnecessary27 and resulting in more accurate miRNA hybridization patterns. Third, this platform has been shown to precisely measure input miRNA from 0.2 amol to 2 fmol,27 a range covering both high and low expression miRNAs. Finally, only 100 ng of total RNA is required to generate miRNA expression profiles, compared with microgram total RNA input required on other platform. The robustness of this platform is further shown by high reproducibility of extraction, labeling, and hybridization processes in our data. The slightly lower correlation observed in Figure 4 reflects the total variation due to the combined effect of all of these processes in addition to slide to slide variation. Therefore it seems safe to assume that slide to slide variation alone does not greatly skew the final profile.
In our hands, matched frozen and FFPE samples yielded similar signal levels, and consistent high correlations were observed between them, which agrees with previous suggestions that FFPE sample-derived miRNAs may retain information quite well.1,13,27 Both Kendall tau and Spearman rank correlation coefficient results between matched frozen and FFPE samples were significantly higher than would be expected by chances, which was simulated by reshuffling two data sets from matched samples independently and randomly and recalculating the Kendall tau and Spearman rank correlation coefficient (data not shown). In addition, unsupervised clustering of the data showed that matched samples tended to cluster together, suggesting that the similarity between matched sample profiles was not likely to be due to artifacts introduced during extraction but had an underlying biological basis. Additionally, separate RNA extractions from the same samples clustered together, again suggesting the biological basis for the profiles observed.
In summary, this study provides evidence that FFPE-derived miRNAs are acceptable for profiling using a microarray platform and that miRNAs isolated from archived FFPE samples appear to match information retained in frozen sample quite well. These results are more promising than those routinely observed for archival sample profiling using comparative genomic hybridization or global mRNA expression arrays.1,28 It is postulated that miRNA species are less affected by autolysis, cross linking, and fragmentation during FFPE preparation.1,29 Additional studies to explore how miRNAs are affected during formalin fixation and paraffin embedding would provide even more opportunity to optimize miRNA extraction protocols from archived samples.
Acknowledgements
We thank Lee Boudreau for preparing sections for RNA extraction and Hong Guo for excellent technical assistance on the array work.
Footnotes
Supported by the Queens Laboratory for Molecular Pathology.
References
- 1.Xi Y, Nakajima G, Gavin E, Morris CG, Kudo K, Hayashi K, Ju J. Systematic analysis of microRNA expression of RNA extracted from fresh frozen and formalin-fixed paraffin-embedded samples. RNA. 2007;13:1668–1674. doi: 10.1261/rna.642907. [DOI] [PMC free article] [PubMed] [Google Scholar]
- 2.Lee RC, Feinbaum RL, Ambros V. The C. elegans heterochronic gene lin-4 encodes small RNAs with antisense complementarity to lin-14. Cell. 1993;75:843–854. doi: 10.1016/0092-8674(93)90529-y. [DOI] [PubMed] [Google Scholar]
- 3.Jay C, Nemunaitis J, Chen P, Fulgham P, Tong AW. miRNA profiling for diagnosis and prognosis of human cancer. DNA Cell Biol. 2007;26:293–300. doi: 10.1089/dna.2006.0554. [DOI] [PubMed] [Google Scholar]
- 4.Hsu PW, Huang HD, Hsu SD, Lin LZ, Tsou AP, Tseng CP, Stadler PF, Washietl S, Hofacker IL. miRNAMap: genomic maps of microRNA genes and their target genes in mammalian genomes. Nucleic Acids Res. 2006;34:D135–D139. doi: 10.1093/nar/gkj135. [DOI] [PMC free article] [PubMed] [Google Scholar]
- 5.Yu Z, Jian Z, Shen SH, Purisima E, Wang E. Global analysis of microRNA target gene expression reveals that miRNA targets are lower expressed in mature mouse and Drosophila tissues than in the embryos. Nucleic Acids Res. 2007;35:152–164. doi: 10.1093/nar/gkl1032. [DOI] [PMC free article] [PubMed] [Google Scholar]
- 6.Ambros V. MicroRNA pathways in flies and worms: growth, death, fat, stress, and timing. Cell. 2003;113:673–676. doi: 10.1016/s0092-8674(03)00428-8. [DOI] [PubMed] [Google Scholar]
- 7.Chen JF, Murchison EP, Tang R, Callis TE, Tatsuguchi M, Deng Z, Rojas M, Hammond SM, Schneider MD, Selzman CH, Meissner G, Patterson C, Hannon GJ, Wang DZ. Targeted deletion of Dicer in the heart leads to dilated cardiomyopathy and heart failure. Proc Natl Acad Sci USA. 2008;105:2111–2116. doi: 10.1073/pnas.0710228105. [DOI] [PMC free article] [PubMed] [Google Scholar]
- 8.Yang H, Kong W, He L, Zhao JJ, O'Donnell JD, Wang J, Wenham RM, Coppola D, Kruk PA, Nicosia SV, Cheng JQ. MicroRNA expression profiling in human ovarian cancer: miR-214 induces cell survival and cisplatin resistance by targeting PTEN. Cancer Res. 2008;68:425–433. doi: 10.1158/0008-5472.CAN-07-2488. [DOI] [PubMed] [Google Scholar]
- 9.Mitomo S, Maesawa C, Ogasawara S, Iwaya T, Shibazaki M, Yashima-Abo A, Kotani K, Oikawa H, Sakurai E, Izutsu N, Kato K, Komatsu H, Ikeda K, Wakabayashi G, Masuda T. Downregulation of miR-138 is associated with overexpression of human telomerase reverse transcriptase protein in human anaplastic thyroid carcinoma cell lines. Cancer Sci. 2008;99:280–286. doi: 10.1111/j.1349-7006.2007.00666.x. [DOI] [PMC free article] [PubMed] [Google Scholar]
- 10.Caldas C, Brenton JD. Sizing up miRNAs as cancer genes. Nat Med. 2005;11:712–714. doi: 10.1038/nm0705-712. [DOI] [PubMed] [Google Scholar]
- 11.Castoldi M, Schmidt S, Benes V, Noerholm M, Kulozik AE, Hentze MW, Muckenthaler MU. A sensitive array for microRNA expression profiling (miChip) based on locked nucleic acids (LNA) RNA. 2006;12:913–920. doi: 10.1261/rna.2332406. [DOI] [PMC free article] [PubMed] [Google Scholar]
- 12.Cummins JM, He Y, Leary RJ, Pagliarini R, Diaz LA, Jr, Sjoblom T, Barad O, Bentwich Z, Szafranska AE, Labourier E, Raymond CK, Roberts BS, Juhl H, Kinzler KW, Vogelstein B, Velculescu VE. The colorectal microRNAome. Proc Natl Acad Sci USA. 2006;103:3687–3692. doi: 10.1073/pnas.0511155103. [DOI] [PMC free article] [PubMed] [Google Scholar]
- 13.Nelson PT, Baldwin DA, Scearce LM, Oberholtzer JC, Tobias JW, Mourelatos Z. Microarray-based, high-throughput gene expression profiling of microRNAs. Nat Methods. 2004;1:155–161. doi: 10.1038/nmeth717. [DOI] [PubMed] [Google Scholar]
- 14.Nelson PT, Baldwin DA, Kloosterman WP, Kauppinen S, Plasterk RH, Mourelatos Z. RAKE and LNA-ISH reveal microRNA expression and localization in archival human brain. RNA. 2006;12:187–191. doi: 10.1261/rna.2258506. [DOI] [PMC free article] [PubMed] [Google Scholar]
- 15.Masuda N, Ohnishi T, Kawamoto S, Monden M, Okubo K. Analysis of chemical modification of RNA from formalin-fixed samples and optimization of molecular biology applications for such samples. Nucleic Acids Res. 1999;27:4436–4443. doi: 10.1093/nar/27.22.4436. [DOI] [PMC free article] [PubMed] [Google Scholar]
- 16.Hamatani K, Eguchi H, Takahashi K, Koyama K, Mukai M, Ito R, Taga M, Yasui W, Nakachi K. Improved RT-PCR amplification for molecular analyses with long-term preserved formalin-fixed, paraffin-embedded tissue specimens. J Histochem Cytochem. 2006;54:773–780. doi: 10.1369/jhc.5A6859.2006. [DOI] [PubMed] [Google Scholar]
- 17.Wang WX, Rajeev BW, Stromberg AJ, Ren N, Tang G, Huang Q, Rigoutsos I, Nelson PT. The expression of microRNA miR-107 decreases early in Alzheimer's disease and may accelerate disease progression through regulation of beta-site amyloid precursor protein-cleaving enzyme 1. J Neurosci. 2008;28:1213–1223. doi: 10.1523/JNEUROSCI.5065-07.2008. [DOI] [PMC free article] [PubMed] [Google Scholar]
- 18.Calame K. MicroRNA-155 function in B Cells. Immunity. 2007;27:825–827. doi: 10.1016/j.immuni.2007.11.010. [DOI] [PubMed] [Google Scholar]
- 19.Lee DY, Deng Z, Wang CH, Yang BB. MicroRNA-378 promotes cell survival, tumor growth, and angiogenesis by targeting SuFu and Fus-1 expression. Proc Natl Acad Sci USA. 2007;104:20350–20355. doi: 10.1073/pnas.0706901104. [DOI] [PMC free article] [PubMed] [Google Scholar]
- 20.Latronico MV, Catalucci D, Condorelli G. Emerging role of microRNAs in cardiovascular biology. Circ Res. 2007;101:1225–1236. doi: 10.1161/CIRCRESAHA.107.163147. [DOI] [PubMed] [Google Scholar]
- 21.Yang M, Mattes J. Discovery, biology and therapeutic potential of RNA interference, microRNA and antagomirs. Pharmacol Ther. 2008;117:94–104. doi: 10.1016/j.pharmthera.2007.08.004. [DOI] [PubMed] [Google Scholar]
- 22.Shell S, Park SM, Radjabi AR, Schickel R, Kistner EO, Jewell DA, Feig C, Lengyel E, Peter ME. Let-7 expression defines two differentiation stages of cancer. Proc Natl Acad Sci USA. 2007;104:11400–11405. doi: 10.1073/pnas.0704372104. [DOI] [PMC free article] [PubMed] [Google Scholar]
- 23.Nicoloso MS, Calin GA. MicroRNA involvement in brain tumors: from bench to bedside. Brain Pathol. 2008;18:122–129. doi: 10.1111/j.1750-3639.2007.00119.x. [DOI] [PMC free article] [PubMed] [Google Scholar]
- 24.Lowery AJ, Miller N, McNeill RE, Kerin MJ. MicroRNAs as prognostic indicators and therapeutic targets: potential effect on breast cancer management. Clin Cancer Res. 2008;14:360–365. doi: 10.1158/1078-0432.CCR-07-0992. [DOI] [PubMed] [Google Scholar]
- 25.Nuovo GJ. In situ detection of precursor and mature microRNAs in paraffin embedded, formalin fixed tissues and cell preparations. Methods. 2008;44:39–46. doi: 10.1016/j.ymeth.2007.10.008. [DOI] [PubMed] [Google Scholar]
- 26.Nakajima G, Hayashi K, Xi Y, Kudo K, Uchida K, Takasaki K, Yamamoto M, Ju J. Non-coding MicroRNAs hsa-let-7g and hsa-miR-181b are associated with chemoresponse to S-1 in colon cancer. Cancer Genomics Proteomics. 2006;3:317–324. [PMC free article] [PubMed] [Google Scholar]
- 27.Wang H, Ach RA, Curry B. Direct and sensitive miRNA profiling from low-input total RNA. RNA. 2007;13:151–159. doi: 10.1261/rna.234507. [DOI] [PMC free article] [PubMed] [Google Scholar]
- 28.Mc Sherry EA, Mc Goldrick A, Kay EW, Hopkins AM, Gallagher WM, Dervan PA. Formalin-fixed paraffin-embedded clinical tissues show spurious copy number changes in array-CGH profiles. Clin Genet. 2007;72:441–447. doi: 10.1111/j.1399-0004.2007.00882.x. [DOI] [PubMed] [Google Scholar]
- 29.von Ahlfen S, Missel A, Bendrat K, Schlumpberger M. Determinants of RNA quality from FFPE samples. PLoS ONE. 2007;2:e1261. doi: 10.1371/journal.pone.0001261. [DOI] [PMC free article] [PubMed] [Google Scholar]