Abstract
The chemical structures of six lipid A species (A, B, C, D-1, D-2, and E) purified from Rhizobium etli CE3 were investigated by one- and two-dimensional NMR spectroscopy. The R. etli lipid A subtypes each contain an unusual acyloxyacyl residue at position 2′ as part of a conserved distal glucosamine moiety but differ in their proximal units. All R. etli lipid A species lack phosphate groups. However, they are derivatized with an α-linked galacturonic acid group at position 4′, as shown by nuclear Overhauser effect spectroscopy. Component B, which had been not been reported in previous studies, features a β, 1′-6 linked disaccharide of glucosamine acylated at positions 2, 3, 2′, and 3′ in a pattern that is typical of lipid A found in other Gram-negative bacteria. D-1 contains an acylated aminogluconate unit in place of the proximal glucosamine residue of B. C and E lack ester-linked β-hydroxyacyl chains at position 3, as judged by their H-3 chemical shifts, and may be synthesized from B and D-1, respectively, by the R. etli 3-O-deacylase. D-2 is an isomer of D-1 that forms nonenzymatically by acyl chain migration. A may be an elimination product derived from D-1 during hydrolysis at 100 °C (pH 4.5), a step needed to release lipid A from lipopolysaccharide. Based on these findings, we propose a biosynthetic scheme for R. etli lipid A in which B is generated first by a variation of the E. coli pathway. The aminogluconate unit of D-1 could then be made from B by enzymatic oxidation of the proximal glucosamine. As predicted by our hypothesis, enzyme(s) can be demonstrated in extracts of R. etli that convert 14C-labeled B to D-1.
Gram-negative bacteria, such as Rhizobium etli and Rhizobium leguminosarum, belong to a family of select microbes that fix nitrogen during symbiosis within the roots of leguminous plants (1, 2). Lipopolysaccharides (LPS),1 which coat the outer membranes of the Rhizobiaceae, may play important role(s) in this process (3, 4). Mutants of R. leguminosarum and R. etli that lack O-antigen cannot generate functional nodules (5–8), and LPS undergoes subtle structural modifications during symbiosis, possibly reflecting adaptations to the root microenvironment (9, 10).
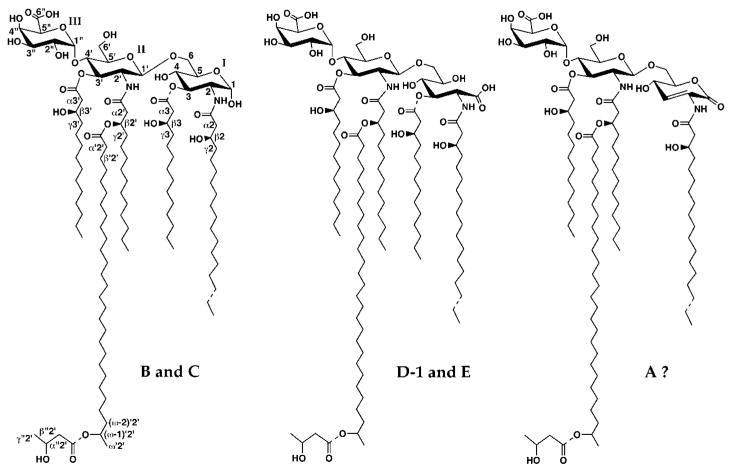
Whether or not the lipid A portion of LPS also plays an important role in symbiosis is unknown. Well characterized R. etli or R. leguminosarum mutants with altered lipid A structures have not been described. The important studies of Carlson and co-workers (11, 12) have demonstrated that the chemistry of lipid A in R. etli and R. leguminosarum is remarkably different from that of most other lipid A molecules, suggesting the possibility of unique biological function(s). Interesting features of R. etli lipid A include the absence of phosphate moieties, the presence of a galacturonic acid residue at position 4′, substitution of the proximal glucosamine residue by a 2-aminogluconate unit, and the presence of an unusual C28 acyl chain (11, 12).
A single R. etli lipid A structure lacking an acyloxyacyl unit was previously proposed (11, 12). We have now developed new chromatographic methods, described in the accompanying article (13), that resolve R. etli CE3 lipid A into six related components, designated A, B, C, D-1, D-2 and E (see Fig. 1). The lipid A species of R. leguminosarum 3855 (14, 15) are very similar to those of R. etli CE3, as judged by thin layer chromatography.2 Chemical analyses and mass spectrometry (13, 16) show that all six lipid A species of R. etli contain glucosamine but that aminogluconate is present only in components D-1, D-2, and E (see Fig. 1) (13). The masses of the distal units of all six components are identical, suggesting a conserved structure (see Fig. 1) (13). The MALDI/TOF mass spectrometry studies furthermore show that components C and E are 3-O-deacylated versions of B and D-1, respectively (Fig. 1) (13), and may be formed by the 3-O-deacylase present in R. etli membranes (17).
Fig. 1. Proposed structures of species B, C, D-1, E, and A isolated from R. etli CE3.
Species B and C contain a glucosamine disaccharide unit typical of lipid A molecules found in most other Gram-negative bacteria, including E. coli. D-1 and E feature an aminogluconate unit in place of the proximal glucosamine. All lipid A species of R. etli contain a galacturonic acid substituent at position 4′ and an unusual C28 chain that is further substituted at C27, the position labeled as (ω-1)′2′. Dashed bonds show microheterogeneity with respect to acyl chain lengths or the presence of the β-hydroxybutyrate substituent. The uniform numbering scheme used to label the key sugar and lipid positions for the NMR analysis (Table I) is indicated in the structure of species B. Roman numerals indicate spin systems. Component A appears to be a chemical degradation product of D-1, and it may contain an aminoglucono-lactone residue (A. Ribeiro, C. Raetz, and N. Que, manuscript in preparation). D-2 (not shown) is an isomer of D-1 resulting from nonenzymatic acyl chain migration of the ester-linked chain at position 3 to position 5 of the aminogluconate moiety.
We now present the first high resolution NMR structural studies of intact lipid A species purified from R. etli CE3. The R. etli lipid A molecules all yield strong 1H NMR signals diagnostic of an acyloxyacyl moiety, consistent with the mass spectrometry discussed in the accompanying article (13, 16). Homo-and heteronuclear one- and two-dimensional NMR studies reveal that the six lipids feature a conserved distal glucosamine unit with a β anomeric glycosidic linkage to the proximal unit. The proximal sugar residues of B and C display an anomeric proton signal, whereas those of D-1, D-2, and E do not, consistent with the proposal that B and C contain a conventional glucosamine disaccharide backbone, as seen in lipid A of most other Gram-negative bacteria. The NMR spectra validate the previously proposed α-linked galacturonic acid moiety attached to the 4′ position of the distal glucosamine in all components (11, 12). Our NMR studies also demonstrate that position 3 of the proximal unit in components C and E is not acylated. Based on our discovery and structural characterization of B, we propose an enzymatic pathway for the origin of the aminogluconate moiety, and we present evidence for novel enzyme(s) in crude extracts of R. etli that rapidly convert 14C-labeled B into D-1.
EXPERIMENTAL PROCEDURES
Materials
Glass backed 0.25-mm Silica Gel 60 thin layer chromatography plates were from Merck. Deuterated solvents (CD3OD, CDCl3 with 0.1% tetramethylsilane, and D2O) and 5-mm NMR tubes were purchased from Aldrich. Chloroform, ammonium acetate, and sodium acetate were obtained from EM Science, whereas pyridine, methanol, and formic acid were from Mallinckrodt. [U-14C]acetate was purchased from Amersham Pharmacia Biotech.
Bacterial Strains
R. leguminosarum 3855 (14) was grown at 30 °C in TY broth supplemented with 10 mM CaCl2. R. etli CE3 (5, 11) was likewise grown on TY broth supplemented with 10 mM CaCl2 but with the further addition of 20 μg/ml nalidixic acid and 200 μg/ml streptomycin sulfate.
Isolation and Purification of R. etli Lipid A Components
The individual lipid A species were purified as described in the preceding paper. To make [14C]acetate-labeled component B, a 5-ml culture of CE3 was grown to A500 = 1 in the presence of 50 μCi of [U-14C]acetate (50 mCi/mmol). The purification of 14C-labeled B was achieved by a combination of DEAE-cellulose column chromatography (18) and preparative thin layer chromatography, as described for nonradioactive B in the accompanying article (13). Approximately 0.05% of the [U-14C]acetate added to the culture was incorporated into B.
NMR Spectroscopy
NMR spectra were recorded on Varian Unity 500 or 600 NMR spectrometers, each equipped with a Sun Sparc 2 data system. Proton-detected spectra were obtained with a 5-mm Varian inverse probe in the Unity 500 and a 5-mm triple probe in the Unity 600. Proton and carbon chemical shifts in CDCl3/CD3OD/D2O (2:3:1 v/v/v) are reported relative to internal tetramethylsilane at 0.00 ppm with the residual signal of CD3OD serving as the secondary reference at 49.5 ppm for carbon spectra. 1H spectra at 500 MHz were obtained with a spectral width of 5 kHz, a 67° pulse flip angle (6 μs), a 4.8-s acquisition time, and a 2-s relaxation delay (RD) and digitized using 48,000 points to obtain a digital resolution of 0.208 Hz/pt.
1H spectra at 600 MHz were obtained with a 5.4 kHz spectral width, a 67° pulse field angle (4.5 μs), a 4.3-s acquisition time, and a 1-s RD. The spectra were digitized using 48,000 points to obtain a digital resolution of 0.225 Hz/pt.
The two-dimensional sequences from Varian (COSY, TOCSY, and NOESY) were modified to include a long, low power transmitter pulse for solvent signal elimination at a frequency different from nonselective high power pulses at the quadrature detection frequency.
The following two-dimensional NMR experiments were performed at 600 MHz. COSY (19, 20) were recorded in the absolute value mode with a 5.4 kHz spectral width, 2,000 points, a 1-s RD, and 160 scans/increment. In these experiments 512 time increments were collected and zero-filled to 2,000 points with sine-bell weighting in both dimensions before Fourier transformation, followed by symmetrization of the two-dimensional matrix. TOCSY (21) and NOESY (22) were recorded in the hypercomplex phase-sensitive mode using two sets of 200 time-incremented spectra, 160 scans/increment, a 1-s RD, and a mixing time of 100 ms in TOCSY and 500 ms in NOESY. The final two-dimensional matrices were 2,000 × 2,000 with Gaussian weighting in both dimensions and were not symmetrized.
Proton-detected single bond 1H,13C two-dimensional chemical shift correlation spectra were recorded using the HMQC method (23, 24) with 13C decoupling during acquisition. Two sets of 256 time increments were obtained in the hypercomplex phase-sensitive mode with 2,000 points in t2. Four hundred scans were recorded per time increment, and the RD was 1.2 s. The two-dimensional data were processed using Gaussian functions and zero-filled to a final size of 2,000 × 2,000.
Conversion of 14C-Labeled B to 14C-Labeled D-1 in Crude Cell Extracts
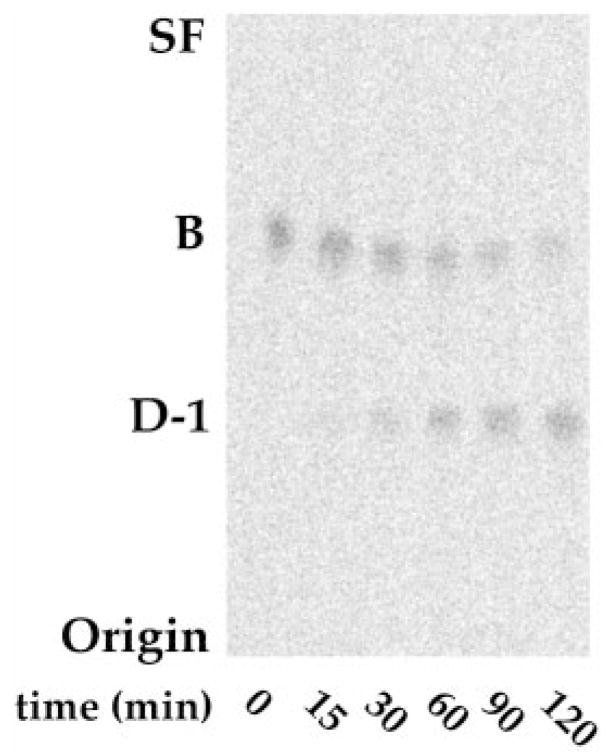
The reaction mixture (10 μl) consisted of 5 μM 14C-labeled B (~700 cpm/tube), 0.5–1 mg/ml CE3 membranes, 1 mM MgCl2, and 50 mM MES buffer, pH 6.5. Reactions were stopped after incubation at 30 °C at the indicated times by spotting 4-μl samples onto a silica gel thin layer plate, which was developed in the solvent chloroform/methanol/water/pyridine (40:25:4:2 v/v/v/v). After drying the plate, conversion of B to D-1 was detected and quantified using a Molecular Dynamics Storm PhosphorImager, equipped with ImageQuant software.
RESULTS
High Resolution 1H NMR Spectra of Purified R. etli Lipid A Species
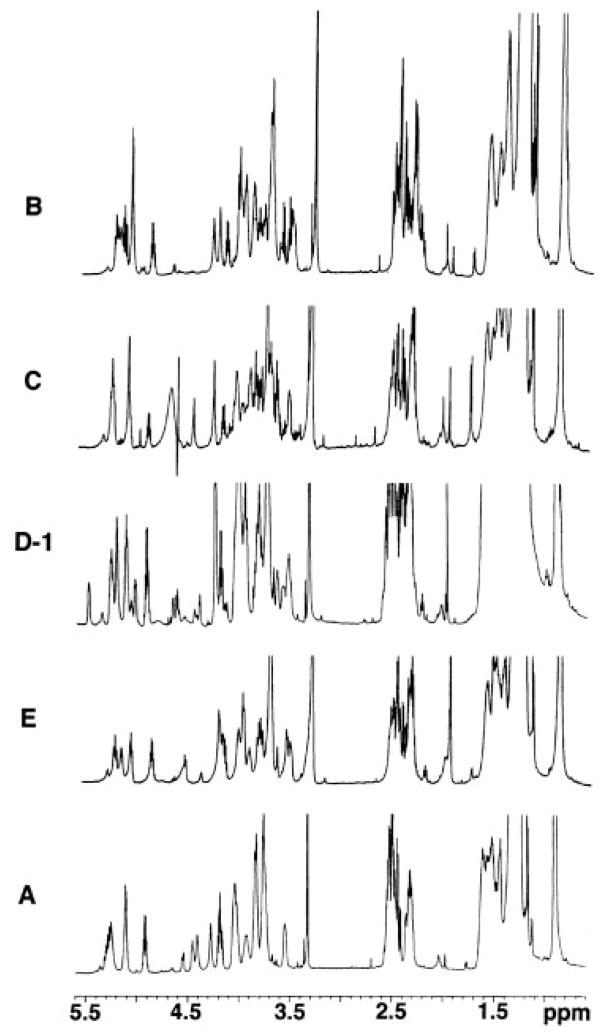
The intact lipid A components of R. etli CE3 have not been available previously for study by high resolution 1H NMR spectroscopy. The 600 MHz 1H NMR spectra of components B, C, D-1, E, and A dissolved in CDCl3/CD3OD/D2O (2:3:1 v/v/v) (25) reveal remarkably sharp and well resolved sugar and acyl resonances, which can be divided into four general regions (Fig. 2). The downfield signals between 4.5–5.3 ppm correspond to anomeric and acylated oxymethine protons. The resonances between 3.5 and 4.5 ppm arise from unsubstituted oxymethine protons, predominantly those of sugars. The complex multiplets between 2.2 and 2.6 ppm originate mainly from the α-methylenes of the β-hydroxyacyl chains, whereas the broader signals around 1.4–1.6 ppm are characteristic of their γ-methylenes. The 0.9–1.3 ppm upfield resonances are attributed to terminal methyl groups and bulk methylenes, respectively. Solvent resonances between 4.5–4.8 ppm (arising from HOD and CD3OH) may obscure the anomeric H-1′ signal (as with component C in Fig. 2) but can be removed with appropriate presaturation pulses (B, D-1, E, and A in Fig. 2) (25).
Fig. 2. High resolution 1H NMR spectra at 600 MHz of species B, C, D-1, E, and A purified from R. etli.
The NMR spectra were recorded at 25 °C in the solvent, CDCl3/CD3OD/D2O (2:3:1 v/v/v). Sample sizes were typically 1–4 mg in 0.6 ml.
Presence of an Unusual Acyloxyacyl Residue in B and Other R. etli Lipid A Components
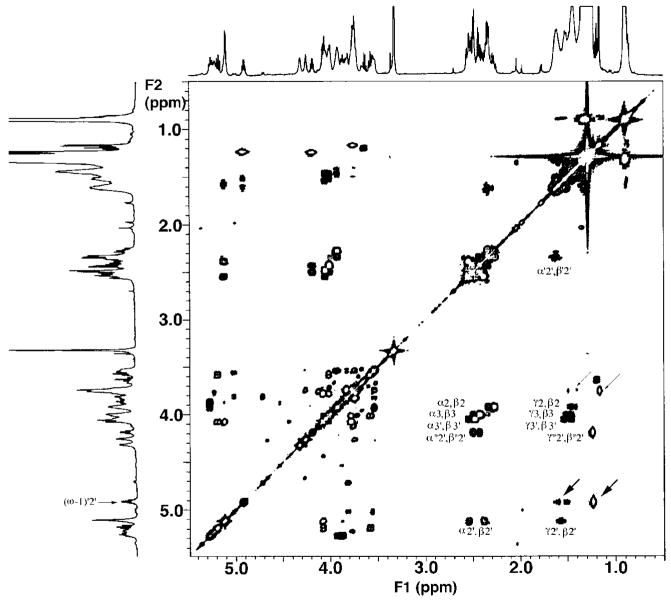
1H NMR assignments for B, C, D-1, and E (Table I) were derived from two-dimensional COSY experiments using the anomeric protons as entry points to elucidate the networks of coupled spin systems. The COSY results (Fig. 3) furthermore provide unequivocal evidence for the presence of an unusual acyloxyacyl moiety in B and in all other R. etli lipid A components (supplementary figures). The β-oxymethine protons of the β-hydroxyacyl chains in lipid A molecules resonate around 3.7–4.2 ppm (like those of sugars), provided the β-OH moiety is unsubstituted, but are detected near 5.2 ppm if the β-OH is further acylated (26–29). The number and substitution of the β-hydroxyacyl chains present in a lipid A molecule can be estimated from the number of cross-peak pairs between the α-methylene (2.2–2.6 ppm) and the β-oxymethine protons, as well as the γ-methylene (1.4–1.6 ppm) and the β-oxymethine protons. The COSY of B (Fig. 3) displays five α/β and γ/β cross-peak pairs.3 The cross-peaks near 2.4 ppm/4.0 ppm (designated α2/β2, α3/β3, and α3′/β3′ in Fig. 3) and near 1.5 ppm/4.0 ppm (designated γ2/β2, γ3/β3, and γ3′/β3′ in Fig. 3) correspond to what is expected for α- and γ-methylene protons, respectively, adjacent to β-oxymethines of unsubstituted β-hydroxyacyl chains. However, the cross-peak pairs designated α2′/β2′ and γ2′/β2′ in Fig. 3 are considerably farther downfield than the others, indicating that this particular β-oxymethine group is acylated. This pattern of cross-peaks at (2.38, 2.54)/5.12 and (1.6)/5.12 ppm is in fact diagnostic for the presence of an acyloxyacyl unit in component B of R. etli lipid A. The COSY spectra for the other five purified components of R. etli lipid A (A, C, D-1, D-2, and E) reveal identical α2′/β2′ and γ2′/β2′ cross-peaks, as observed in B (Fig. 3), indicating that each lipid A component features one acyloxyacyl residue (see supplementary figures). Similar down-field α/β and γ/β cross-peaks are also seen in the COSY of E. coli lipid A, in which two acyloxyacyl groups are known to be present (25).
Table I. Selected 1H NMR chemical shifts of CE3 lipid A components.
The chemical shifts are taken from COSY experiments. Chemical shifts for B are from Fig. 3, whereas others are from Supplementary Figs. 2–5. Slightly different chemical shifts are seen for certain residues in other experiments (TOCSY, NOESY, and HMQC), most likely arising from small changes in pH or solvent ratios. The numbering is shown in Fig. 1.
| Spin system/residue | Proton | B | C | D-1 | D-2 | E |
|---|---|---|---|---|---|---|
| I (GlcN or aminogluconate) | H-1 (H-1β) | 5.12 (4.75) | 5.12 (n.d.) | |||
| H-2 | 4.08 | 3.87 | 4.42 | 4.50 | 4.42 | |
| H-3 | 5.18 | 3.68 | 5.03 | 4.05 | 4.21 | |
| H-4 | 3.58 | 3.34 | 4.00 | 3.81 | 3.58 | |
| H-5 | 4.02 | 3.94 | 3.57 | 5.05 | 3.74 | |
| H-6a | 3.79 | 3.55 | 3.87 | 3.78 | 3.85 | |
| H-6b | 4.08 | 3.75 | 4.07 | 4.16 | 4.01 | |
| II (GlcN) | H-1′ | 4.53 | 4.55 | 4.55 | 4.61 | 4.58 |
| H-2′ | 3.87 | 3.88 | 3.81 | 3.82 | 3.87 | |
| H-3′ | 5.28 | 5.28 | 5.26 | 5.27 | 5.28 | |
| H-4′ | 3.92 | 3.98 | 3.94 | 3.92 | 3.95 | |
| H-5′ | 3.54 | 3.54 | 3.53 | 3.54 | 3.54 | |
| H-6a′ | 3.74 | 3.75 | 3.76 | 3.72 | 3.74 | |
| H-6b′ | 3.83 | 3.83 | 3.82 | 3.83 | 3.83 | |
| III (GalUA) | H-1″ | 5.23 | 5.25 | 5.21 | 5.21 | 5.22 |
| H-2″ | 3.77 | 3.78 | 3.76 | 3.76 | 3.75 | |
| H-3″ | 3.75 | 3.76 | 3.75 | 3.75 | 3.74 | |
| H-4″ | 4.26 | 4.28 | 4.23 | 4.25 | 4.24 | |
| H-5″ | 4.32 | 4.30 | 4.25 | 4.31 | 4.25 | |
| β-OH fatty acyl | H-α(2,3,2′,3′) | 2.20–2.55 | 2.20–2.55 | 2.30–2.55 | 2.30–2.55 | 2.30–2.55 |
| H-β2′ | 5.12 | 5.12 | 5.12 | 5.12 | 5.12 | |
| H-β(2,3,3′) | 3.90–4.15 | 3.90–4.15 | 3.95–4.10 | 3.90–4.10 | 3.95–4.10 | |
| H-γ(2,3,2′,3′) | 1.40–1.60 | 1.45–1.60 | 1.45–1.60 | 1.45–1.60 | 1.45–1.60 | |
| Bulk-CH2– | 1.20–1.60 | 1.20–1.60 | 1.20–1.60 | 1.20–1.60 | 1.20–1.60 | |
| terminal CH3– | 0.90 | 0.90 | 0.90 | 0.90 | 0.90 | |
| 27-OH-C28 | H-α′2′ | 2.40 | 2.40 | 2.40 | 2.40 | 2.40 |
| H-β′2′ | 1.60 | 1.64 | 1.60 | 1.60 | 1.60 | |
| H-(ω-2)′2′ | 1.55 | 1.55 | 1.55 | 1.55 | 1.55 | |
| H-(ω-1)′2′ | 4.92 | 4.92 | 4.92 | 4.92 | 4.92 | |
| H-ω′2′ | 1.25 | 1.25 | 1.25 | 1.25 | 1.25 | |
| β-OH-C4 | H-α″2′ | 2.45 | 2.45 | 2.44 | 2.45 | 2.45 |
| H-β″2′ | 4.19 | 4.20 | 4.19 | 4.19 | 4.17 | |
| H-γ″2′ | 1.25 | 1.25 | 1.25 | 1.25 | 1.25 |
Fig. 3. A 600 MHz two-dimensional 1H-1H COSY analysis of species B highlighting the key acyl chain connectivities.
The presence of an unusual acyloxyacyl chain is directly indicated by the cross-peaks to the downfield β-oxyme-thine designated α2′/β2′ and γ2′/β2′, compared with the remaining α/β and γ/β cross-peaks. The cross-peak pairs designated α″2″/β″2″ and γ″2″/β″2″ arise from the couplings within the β-hydroxybu-tyrate residue. The cross-peaks designated with thick and thin arrows indicate the coupling from the C27 oxymethine to the C26 methylene and C28 methyl groups of the C28 fatty acyl chain in the presence or absence of the β-hydroxybu-tyrate substituent, respectively.
Evidence for a β-Hydroxybutyrate Moiety Esterified to the 27-OH Group in Component B
The remaining cross-peak pairs designated α″2′/β″2′ and γ″2′/β″2′ (Fig. 3) are attributed to the coupling between the α-methylene protons and the β-oxymethine proton, and the γ-methylene protons and the β-oxymethine proton of the β-hydroxybutyrate residue, respectively (Fig. 1). The β-hydroxybutyrate residue is attached to the 27-OH group of the C28 acyl chain (11–13). The γ″2′/β″2′ cross-peak is seen to resonate significantly upfield relative to the other γ/β cross-peaks (Fig. 3). This pattern is consistent with that expected for a β-hydroxybutyrate residue, because its γ-carbon atom is a terminal methyl group rather than a methylene unit.
The well resolved multiplet labeled (ω-1)′2′ at 4.92 ppm in Fig. 3 is assigned to the oxymethine proton on C27 of the C28 fatty acyl chain (Fig. 1). The downfield position of this proton indicates the C27-OH group must be acylated, presumably with the β-hydroxybutyrate moiety. There are no cross-peaks detected between the (ω-1)′2′ proton signal and the 2.5 ppm region, indicating that the (ω-1)′2′ proton is not coupled to an α-methylene group. Instead, the (ω-1)′2′ proton shows cross-peaks near 1.5/1.6 and 1.25 ppm (Fig. 3, thick arrows). These are interpreted as evidence for the coupling of the (ω-1)′2′ proton to the geminal protons on C26 and to the terminal methyl protons on C28, respectively. A minor lipid A species, presumably lacking the β-hydroxybutyrate substituent at the 27-OH position, is revealed by the weaker cross-peaks at 3.7/(1.4, 1.3) and 3.7/1.2 ppm (Fig. 3, thin arrows). A species lacking the β-hydroxybutyrate group is likewise seen by mass spectrometry (13).
The features of the 1H NMR spectrum of B attributed to the β-hydroxybutyrate substituent and the (ω-1)′2′ proton of the C28 chain are also detected in species A, C, D-1, D-2, and E (supplementary figures). Likewise, the strong cross-peak near 2.4/1.6 ppm, assigned to the α and the β methylene protons of the C28 chain (designated α′/β′2′ in Fig. 3), is seen in the NMR spectra of the other R. etli lipid A components. The conclusion that the acyloxyacyl residue involving the unusual C28 chain with its β-hydroxybutyrate appendage is located at the 2′ (rather than the 3′) position (Fig. 1) rests primarily on the mass spectrometry presented in the accompanying article (13).
Sugar Spin Coupling and Assignments in Component B
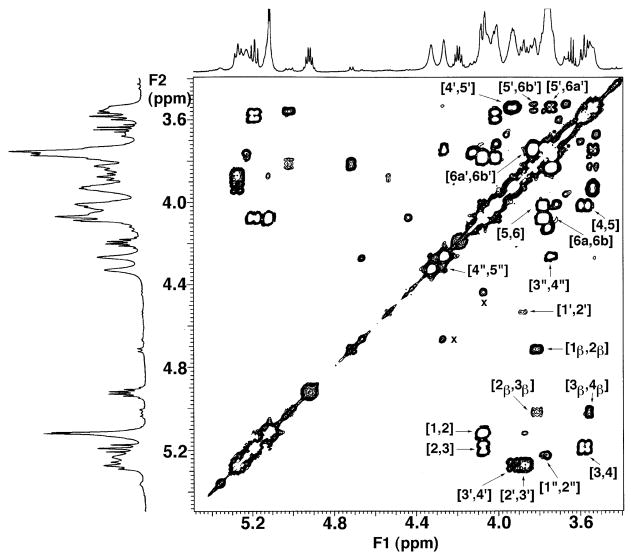
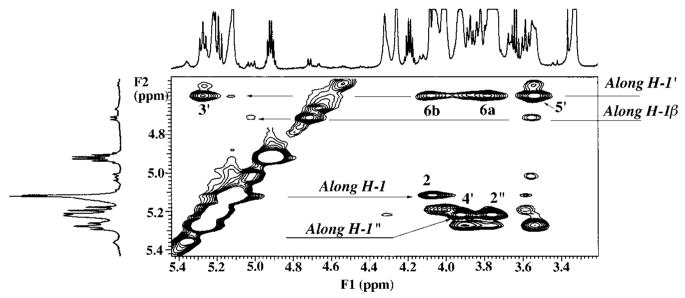
Spin coupling connectivities and detailed assignments for the sugar protons are shown in the expanded COSY of component B from 3.5 to 5.5 ppm (Fig. 4). Two glucosamine units and one galacturonic acid residue are observed in the NMR spectra of B, consistent with mass spectrometry and chemical analyses (13). Unlike lipid A of E. coli, the proximal glucosamine unit of B is not phosphorylated. The major anomeric H-1 (J = 3.4 Hz) of B resonates upfield at 5.12 ppm compared with the H-1 of E. coli lipid A at 5.54 ppm (25). Because the proximal glucosamine is not phosphorylated, both α and β anomeric forms are detected by NMR spectroscopy. Indeed, the COSY of B (Fig. 4) reveals four anomeric protons, resonating, respectively, at 5.12 ppm (the major α anomeric form of H-1, designated 1), 4.75 ppm (J = 8.3 Hz; the minor β anomeric form of H-1, designated 1β), 4.53 ppm (J = 8.1 Hz; H-1′), and 5.23 ppm (unresolved J, estimate < 3 Hz; H-1″). The intensity of the H-1′ signal at 4.53 ppm is much reduced because of the presaturation pulses (25) used to eliminate the solvent lines, but it is nevertheless visible, and its identification is unambiguous from its chemical shift and connectivity pattern.
Fig. 4. Partial 600 MHz two-dimensional 1H-1H COSY analysis of species B showing sugar ring connectivities.
The labeled cross-peaks indicate the assignments for the two glucosamine and the single galacturonic acid residue. The proximal glucosamine is not phosphoryl-ated, and both α and β anomeric forms are detected. Integration gave estimates of 82% α and 18% β anomeric forms.
The chemical shifts and vicinal coupling constants of the anomeric protons give insights into the configurations and conformations of the sugar groups (28, 30). The glucosamine H-1 of B resonates at a relatively low field position (5.12 ppm) and has a small coupling constant (J = 3.4 Hz), providing evidence that H-1 is equatorial and the proximal glucosamine unit of B is mostly in the α-anomeric form. Likewise, the relatively low field position (5.23 ppm) and small coupling constant of H-1″ (<3 Hz) provide evidence that H-1″ is equatorial and that the galacturonic acid moiety of B has the α-anomeric configuration. In contrast, H-1′ of the distal glucosamine unit resonates further upfield (~4.53 ppm) with an observed coupling constant of 8.1 Hz, consistent with an axial H-1′ and the β-anomeric configuration. NOESY analysis of B (see below) provides further evidence that H-1′ is indeed axially disposed, as the distal glucosamine of B is found to be attached via a β, 1′-6 linkage to the proximal glucosamine. H-1″ is equatorially disposed with a distinct NOE to the axial H-4′, as the galacturonic acid residue is attached via an α, 1″-4′ linkage to the distal glucosamine.
H-3 and H-3′ (5.18 and 5.28 ppm, respectively) of the proximal and distal glucosamine residues of component B are shifted downfield considerably relative to the other sugar oxymethines (Fig. 4). This indicates that the glucosamine 3 and 3′ positions of B are esterified with acyl chains (Fig. 1), as in lipid A of most other bacteria (25, 26, 31–33). The protons of the galacturonic acid residue show chemical shifts (Fig. 4 and Table I) and small coupling constants, consistent with the stereochemistry of unsubstituted galacturonic acid. Similar to the case for H-1, H-4′ of component B (3.92 ppm) resonates further upfield than H-4′ of E. coli lipid A (4.17 ppm) (25) because of the absence of a phosphate moiety at position 4′ in B.
TOCSY Analysis of Component B
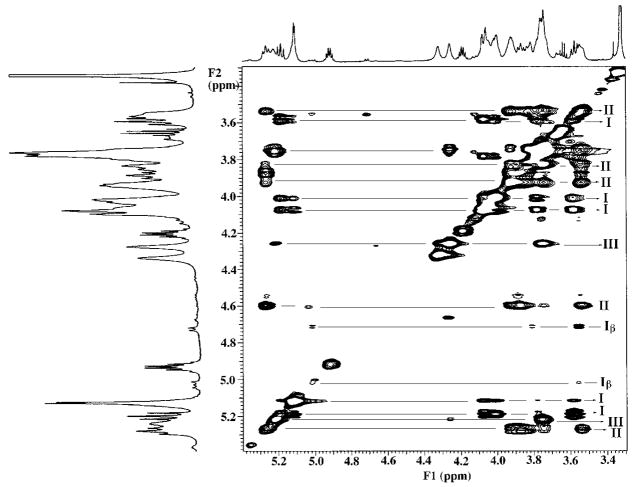
The two-dimensional TOCSY data confirm the presence of three major sugar spin coupling systems in B (designated I, II, and III in Figs. 1 and 5), and an additional minor system (designated Iβ in Fig. 5). These observations strongly validate the assignments derived from the COSY experiment (Fig. 4 and Table I). Spin systems I and Iβ, respectively, correspond to the α- and β-anomeric forms of the proximal glucosamine residue, whereas II represents the distal β, 1′-6 linked glucosamine. Spin system III arises from the galacturonic acid moiety attached to the 4′ position on the distal glucosamine.
Fig. 5. Partial 600 MHz two-dimensional 1H-1H TOCSY of species B showing sugar ring connectivities.
Spin systems I and Iβ correspond to the major α-anomeric and minor β-anomeric forms of the proximal glucosamine unit. Spin system II represents the distal β, 1–6 linked distal glucosamine. Spin system III arises from the galacturonic acid moiety attached to the 4′ position on the distal glucosamine unit.
Evaluation of the Carbon Structure of Component B by HMQC Spectroscopy
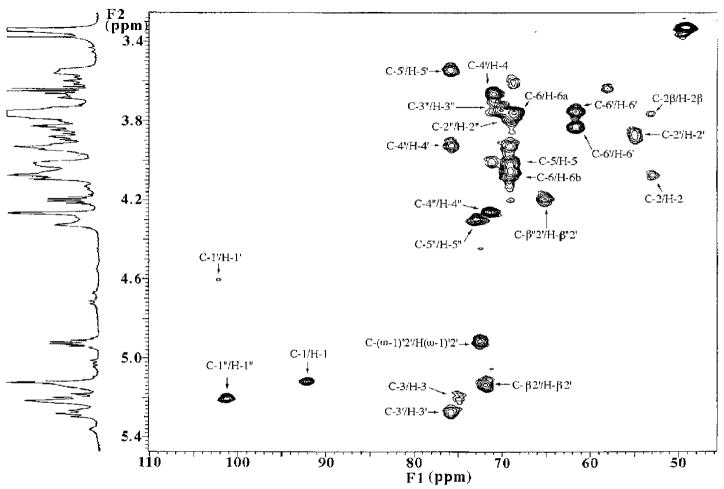
Selection of multiple quantum coherence by two-dimensional HMQC spectroscopy eliminates large deuterated carbon solvent signals and gives a two-dimensional map connecting protons to their directly bonded carbons. The key features revealed in the HMQC two-dimensional map for B (Fig. 6 and Table II) are the number and chemical shifts of the anomeric carbons and of the C-2 atoms of the glucosamine units. Three cross-peaks are clearly observed in the anomeric region (90–112 ppm). The resonance at 92 ppm correlates to the predominant anomeric form of H-1 at 5.12 ppm (Fig. 4) and must correspond to the C-1 of the proximal glucosamine unit. The chemical shift of 92 ppm supports the α-anomeric assignment (28). The cross-peaks at 102 and 101 ppm, respectively, connect to the 4.6 ppm H-1′ and to the 5.2 ppm H-1″ (both slightly shifted from the values in Table I because of gradual solvent evaporation). They are therefore identified as C-1′ of the distal glucosamine and C-1″ of the galacturonic acid residue. The observed chemical shifts near 102 and 101 ppm for C-1′ and C-1″ are consistent with the β configuration for the distal glucosamine and the α form for the galacturonic acid moieties, respectively (28).
Fig. 6. Partial two-dimensional HMQC spectrum of species B, showing direct bond 1H-13C correlations within the sugar ring region.
The assigned cross-peaks are labeled. Three anomeric cross-peaks are observed. The intensity of the C-1′/H-1′ cross-peak is reduced because of the presaturation sequence to suppress the solvent resonances.
Table II. Selected 13C NMR chemical shifts of CE3 lipid A components.
The chemical shifts in ppm are taken from HMQC experiments (Fig. 6 for B and Fig. 8 for D-1). Only the predominant forms are reported. For D-1, this is the species with the 3-O-acylated aminogluconate residue. For D-2 it is the 5-O-acylated species. The numbering system is shown in Fig. 1.
| Spin system/residue | Carbon | B | C | D-1 | D-2 | E |
|---|---|---|---|---|---|---|
| I (GlcN or aminogluconate) C-1 | 92.0 | 92.0 | ||||
| C-2 | 53.0 | 55.0 | 57.0 | 57.5 | 58.0 | |
| C-3 | 75.0 | 71.4 | 73.5 | 73.0 | 70.7 | |
| C-4 | 68.8 | 72.5 | 70.5 | 72.0 | 72.0 | |
| C-5 | 71.5 | 75.2 | 70.5 | 70.0 | 71.5 | |
| C-6 | 68.6 | 70.3 | 69.8 | 69.0 | 71.8 | |
| II (GlcN) | C-1′ | 102.4 | 102.0 | 102.0 | 102.0 | 102.0 |
| C-2′ | 55.0 | 55.0 | 55.5 | 55.0 | 55.1 | |
| C-3′ | 75.8 | 75.9 | 76.0 | 76.0 | 76.1 | |
| C-4′ | 75.7 | 75.2 | 76.0 | 75.5 | 75.8 | |
| C-5′ | 75.8 | 75.9 | 75.8 | 75.5 | 75.6 | |
| C-6′ | 61.6 | 61.7 | 62.0 | 62.0 | 61.5 | |
| III (GalUA) | C-1″ | 101.3 | 101.8 | 101.0 | 101.0 | 101.4 |
| C-2″ | 70.5 | 69.0 | 70.0 | 71.0 | 69.0 | |
| C-3″ | 71.0 | 69.0 | 69.0 | 71.0 | 69.0 | |
| C-4″ | 71.4 | 71.0 | 71.0 | 71.0 | 71.5 | |
| C-5″ | 73.0 | 72.0 | 72.5 | 72.0 | 73.4 | |
| β-OH fatty acyl | C-β2′ | 72.3 | 72.0 | 72.0 | 71.8 | 72.0 |
| 27-OH-C28 | C-(ω-1)′2′ | 72.4 | 72.4 | 72.8 | 72.4 | 72.7 |
| β-OH-C4 | C-β″2′ | 65.3 | 65.0 | 65.0 | 65.8 | 65.2 |
The nitrogen-substituted carbons of amino sugars usually resonate near 52–54 ppm (25, 28). Two prominent cross-peaks near 53 ppm (C-2) and 55 ppm (C-2′) are seen in the HMQC spectrum of B (Fig. 6), which correlate to the chemical shifts of H-2 at 4.08 ppm and H-2′ at 3.87 ppm, respectively (Fig. 4). H-2 and H-2′ are part of spin systems I and II, respectively, in the TOCSY analysis (Fig. 5). Spin systems I and II are therefore confirmed to arise from amino sugars (i.e. glucosamine units), based on the chemical shifts of C-2 and C-2′.
NOESY Analysis of Component B
A two-dimensional NOESY expansion for B in the sugar region is shown in Fig. 7. H-1′ near 4.6 ppm (part of spin system II of the TOCSY in Fig. 5) displays strong, well resolved intraresidue NOEs to H-3′ and H-5′. The multiple intramolecular 1,3-diaxial NOE enhancements seen within the distal sugar are diagnostic of a β-linked glucopyranose (25). In addition, H-1′ shows strong NOE signals to H-6a and the resolved H-6b of the proximal sugar, providing unequivocal evidence for the β, 1′-6 linkage. Additional evidence is seen in the downfield location of C-6 near 68.6 ppm (Table II and Fig. 6) (25, 34, 35) relative to the C-6′ signal at 61.6 ppm (Fig. 6 and Table II), which is consistent with the view that 6′-OH is not glycosylated.
Fig. 7. Partial 600 MHz 1H-1H two-dimensional NOESY analysis of species B.
With the diagonal phased negatively, the two-dimensional NOE cross-peaks phased negatively. Diagnostic NOEs are detected from H-1″ (5.23 ppm) to H-2″ (3.77 ppm) within the galacturonic acid moiety and to H-4′ (3.92 ppm) in the distal glucosamine unit (interglycosidic). In addition, cross-peaks are seen between H-1′ (4.53 ppm) and H-3′ (axial), and H-5′ (axial) within the distal glucosamine sugar, and to H-6a and H-6b in the proximal glucosamine unit (interglycosidic). A NOE from H-1 to H-2 is also detected within the proximal glucosamine. The mixing time was 500 ms.
H-1 of the proximal glucosamine and H-1″ of the galacturonic acid moiety display strong NOE signals to their respective H-2 and H-2″. A single intramolecular (axial-equatorial) anomeric H-1 to H-2 NOE of this kind is diagnostic for α-linked gluco-and galactopyranoses. H-1″ shows one additional strong NOE signal (Fig. 7) that can be attributed to H-4′, providing evidence for an α, 1″-4′ glycosylation of the distal glucosamine by the α-galacturonic acid residue. In addition, the C-4′ signal at 75.7 ppm is significantly downfield of the C-4 resonance at 68.8 ppm, consistent with the proposed glycosylation of the 4′-OH group (Fig. 6 and Table II).
Overall, the NOESY data provide strong NMR evidence for the locations and configurations of the glycosidic linkages in R. etli component B to be α-GalUA(1 → 4)-β-GlcN(1 → 6)-α/β-GlcN. Our findings confirm the GalUA attachment site deduced previously by methylation analysis of the unresolved R. etli lipid A mixture (11).
Absence of a Proximal Glucosamine Unit in Species D-1, D-2, and E
The HMQC spectra of D-1 (Fig. 8), D-2 (not shown), and E (not shown) reveal only two anomeric carbon/proton cross-peaks. These are C-1′/H-1′ (102/4.55 ppm) from the distal β-glucosamine unit and C-1″/H-1″ (101/5.21 ppm) from the α-galacturonic acid residue. In fact, scrutiny of the cross-peaks assigned to the galacturonic acid moiety, the distal glucosamine unit, and the C28 chain with its appended β-hydroxybutyrate group reveals them to be essentially the same in both D species and B. The strong C-1/H-1 cross-peak (92/5.12 ppm) arising from the proximal glucosamine unit of B (Fig. 6) is not observed in D-1, D-2, and E, which contain a proximal aminogluconate unit (Fig. 8 for D-1). The presence of a carbonyl group at C-1 in the proximal unit of the two D species and E is supported by the +4 to 5 ppm downfield 13C shift of the C-2/H-2 cross-peak from 53/4.08 ppm in B (Fig. 6) to 57–58/4.42 ppm in the D species and E (Fig. 8 and Tables I and II). As in component B, the C-6 signals of D-1, D-2, and E (69–71.8 ppm) are downfield relative to their respective C-6′ resonances (61–62 ppm) (Fig. 8 and Table II) indicative of glycosylation of the 6-OH group. The HMQC data thus provide the initial evidence for the presence of a β, 1′-6 linkage between the distal glucosamine and the aminogluconate unit of the D-1, D-2, and E species.
Fig. 8. Partial two-dimensional HMQC spectrum of species D-1, showing direct bond 1H-13C correlations within the sugar ring region.
The assigned cross-peaks are labeled. Comparison with Fig. 6 reveals that the C-1′/H-1′, C-1″/H-1″, and C-2′/H-2′ cross-peaks in D-1 resonate at almost identical shifts as those in B. However, the C-2/H-2 cross-peak at 53.0/4.08 ppm in B is shifted to 57.0/4.42 ppm in D-1, and the C-1/H-1 cross-peak is not seen in D-1, consistent with the presence of a proximal aminogluconate unit in D-1.
As discussed in the accompanying article (13), D-1 and D-2 display identical positive and negative ion MALDI/TOF mass spectra, suggesting that they are isomers. NMR spectroscopy directly shows that D-1 and D-2 differ in an unusual positional isomerization specifically localized in the proximal aminogluconate residue (Supplementary Figs. 3 and 4). However, the COSY cross-peaks arising from the distal glucosamine and the galacturonic acid moiety in D-1 and D-2 are quite similar and closely match their corresponding signals in B.
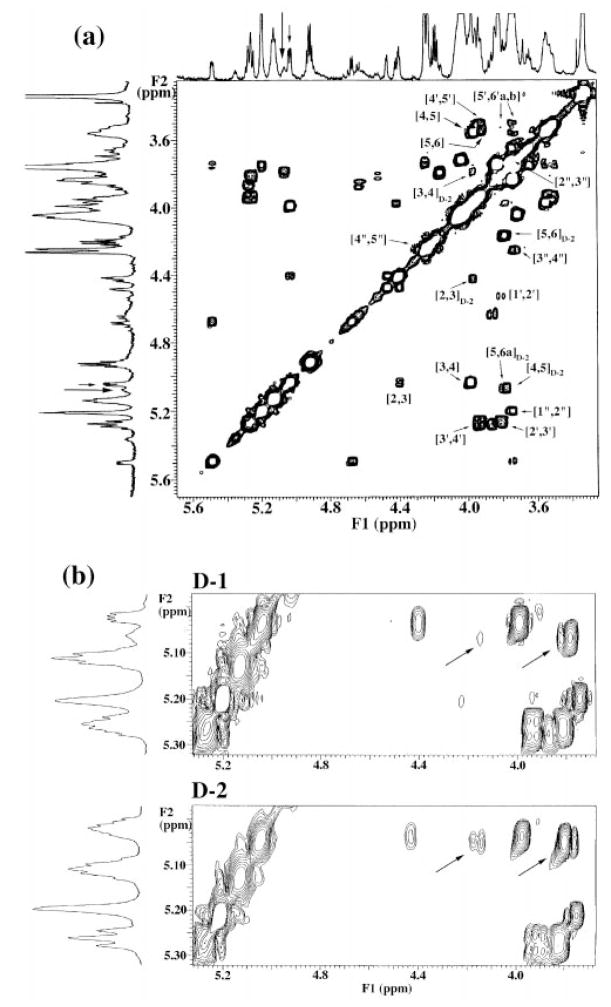
The COSY analysis for the proximal aminogluconate unit is found to be considerably more complicated. Expansion of the COSY (Fig. 9a) of a freshly isolated preparation of D-1 reveals a distinct double-doublet (H-3 at 5.03 ppm; short arrow in Fig. 9a) with resolved J couplings = 3.7 and 7.4 Hz and strong COSY cross-peaks to H-2 (4.42 ppm) and H-4 (4.00 ppm). This indicates that the major isomer D-1 can be assigned as a 3-O-acylated aminogluconate unit. An adjacent, nearly resolved, less intense multiplet (5.05 ppm; long arrow in Fig. 9a) reveals a different connectivity pattern (Fig. 9a, D-2 subscript), with less intense COSY cross-peaks to nonequivalent H-6 resonances (3.78 and 4.16 ppm) and to H-4 (3.81 ppm) (Fig. 9b, upper spectrum, diagonal arrows). This finding indicates that a small amount of the D-2 isomer can be detected in fresh D-1 preparations and that D-2 can be assigned as a 5-O-acylated aminogluconate unit. Integration gave relative ratios of 70:30 for the 5.03 ppm double-doublet and 5.06 ppm multiplet, and their sum approaches that of the singly resolved H-1″ (5.20 ppm) and the β-oxymethine proton (5.12 ppm) (Fig. 9b).
Fig. 9. Partial 600 MHz two-dimensional 1H-1H COSY analyses of freshly isolated D-1 and D-2 samples, showing sugar ring connectivities.
a, the COSY cross-peaks arising from the galacturonic acid and the distal glucosamine unit in D-1 are similar to those observed for B (Fig. 6) and for D-2 (full spectrum not shown). However, even in a fresh sample of D-1, the proximal aminogluconate unit is revealed by NMR spectroscopy to be a mixture of a major 3-O-acylated form (authentic D-1) and a minor 5-O-acylated aminogluconate species (likely to be D-2, as labeled), which arises by a slow intramolecular trans-esterification. b, expansion of the acylated aminogluconate resonances of fresh D-1 and D-2 samples. The expanded D-1 spectrum reveals a prominent double-doublet at 5.03 ppm (H-3), which correlates to H-2 and H-4 in the COSY, providing evidence that this represents a 3-O-acylated species. A less prominent multiplet at 5.07 ppm (assigned to H-5 of the contaminating D-2 in the D-1 sample) correlates to H-6a, H-6b, and H-4 of the D-2 form in the COSY (indicated by the diagonal arrows). Integration of the D-1 spectrum yields estimates of 70% 3-O-acylated (D-1) and 30% 5-O-acylated (D-2) species in the fresh D-1 sample. Expansion of the acylated aminogluconate resonances in a fresh D-2 sample reveals a prominent multiplet at 5.04 ppm, which overlaps and obscures a less intense double-doublet (because of contaminating D-1). COSY reveals the prominent multiplet to correlate to H-6a, H-6b, and H-4 (indicated by the diagonal arrows) in D-2, thus indicating that the 5-O-acylated species is dominant in this sample. However, the COSY analysis also reveals “weaker” cross-peaks to H-2 and H-4, suggesting that the minor species present as an impurity in D-2 is in fact the 3-O-acylated isomer (contaminating D-1).
Upon standing, the D-1 sample equilibrated to a 55% D-1 and 45% D-2 mixture (not shown). The proximal aminogluconate thus behaves as a mixture of major and minor isomers that presumably arise by a slow intramolecular trans-esterification reaction between C-3 and C-5, which occurs during the time required for sample isolation and NMR analysis. Hence, we conclude that the predominant form of the proximal sugar in D-1 is 3-O-acylated, which is likely to be the physiologically relevant species.
Further Studies of the Nonenzymatic Interconversion of D-1 and D-2
The relationship between D-1 and D-2 as equilibrating species was further documented by the following experiments: 1) A freshly prepared solution of D-2 exhibited the reciprocal NMR behavior of D-1, revealing a dominant broad multiplet at 5.06 ppm, which overlaps and obscures a small double-doublet at 5.04 ppm (Fig. 9b). COSY analysis (Fig. 9b, lower spectrum) of this fresh D-2 solution now reveals less intense cross-peaks to the double-doublet and more dominant cross-peaks to the broad multiplet. This finding gives evidence that D-2 consists predominantly of the 5-O-acylated aminogluconate unit, with a minor contribution from the 3-O-acylated D-1. 2) When fresh D-1, dispersed in 50 mM aqueous MES, pH 6.5, and 0.1% Triton X-100, is incubated overnight at room temperature, TLC analysis in the system CHCl3/pyridine/formic acid/methanol/H2O (60/35/10/5/2 v/v/v/v/v) reveals the gradual formation of D-2 (Fig. 10). Conversely, fresh D-1 gradually forms from D-2 incubated under similar conditions at room temperature (Fig. 10). The same slow interconversions occur in the ternary solvent used for the NMR experiments.
Fig. 10. TLC analysis of the nonenzymatic interconversion of D-1 and D-2 after overnight incubation.
Following incubation overnight in 50 mM aqueous MES, pH 6.5, and 0.1% Triton X-100, D-2 gradually appears in freshly isolated sample of D-1 (lane 1), whereas D-1 is generated in a sample of D-2 (lane 2). The 3-O-deacylated species E remains unchanged under these conditions (lane 3). The interconversion of D-1 and D-2 presumably occurs by a slow intramolecular acyl chain migration.
Component E
Results from MALDI/TOF spectrometry showed that component E is related to D-1/D-2 but is missing one fatty acyl chain from the proximal sugar (13). The mass spectrometry methods were not able to establish whether the 2-or 3-position is deacylated in E. The two-dimensional COSY of E (Supplementary Fig. 5), however, shows that the downfield H-3 peak observed in B and D-1 is absent in E. Instead, H-2 of the aminogluconate residue of E displays a distinct COSY connectivity with an upfield resonance at 4.21 ppm, which is assigned as the H-3 of E. Thus, E is the 3-O-deacylated derivative of D-1. Likewise, C is not acylated at the 3-position (H-3 at 3.68 ppm in Supplementary Fig. 2) but is otherwise the same as B by NMR analysis.
A striking difference between the COSY analysis of E and D-1/D-2 is that the proximal aminogluconate of E displays a very simple spectrum (Supplementary Fig. 5). This result strengthens the interpretation of the complexities in the spectra of D-1 and D-2 as arising from fatty acyl migration within the proximal aminogluconate unit. Once the 3-position is deacylated in E, acyl chain migration on the aminogluconate moiety is no longer possible.
Origin and Properties of Component A
MALDI/TOF mass spectrometry does not readily reveal the relationship of A to the other species. The [M − H]− signal of A cannot be explained by a simple deacylation of either B or D-1. However, upon subjecting D-1 to hydrolysis at pH 4.5, under the same conditions needed to release the lipid A components from R. etli LPS (100 °C), a more rapidly migrating species similar to A is formed (data not shown). No band corresponding to A is observed when B or D-2 are hydrolyzed at pH 4.5. Thus, A appears to originate from D-1 as a consequence of the conditions used to cleave the 3-deoxy-D-manno-octulosonic acid-lipid A linkage. The COSY analysis of A is shown in Supplementary Fig. 1. Evidence for the proposed structure of A (Fig. 1) will be presented elsewhere.
Conversion of B to D-1 by R. etli or R. leguminosarum Membranes
When 14C-labeled, purified component B is incubated with R. etli or R. leguminosarum membranes, TLC analysis at various time points demonstrates robust conversion of B to a more polar species that migrates with purified 14C-labeled D-1 (Fig. 11). This observation lends credence to our proposal (Fig. 12) that the aminogluconate residue in D-1 is generated by the oxidation of the proximal glucosamine of B and supports the view that components B and D-1 are both physiologically important species.
Fig. 11. Rapid enzymatic conversion of B to D-1 by R. etli membranes.
Upon incubation with R. etli or R. leguminosarum membranes, 14C- labeled B is converted to a more polar 14C- labeled species that migrates with purified standard of D-1.
Fig. 12. A hypothetical pathway for the biosynthesis of the aminoglu-conate moiety of R. elti lipid A species D-1.
Following the formation of component B, by the indicated pathway, a novel oxidation of the proximal glucosamine residue is proposed. If the reaction proceeds through a lactone intermediate (not shown), an additional lactonase would be needed to generate D-1. All the enzymes needed to generate component B have been detected (36, 37, 44), with the exception of the reactions that incorporate the galacturonic acid and the β-hydroxybutyrate residues.
DISCUSSION
The lipid A species of R. etli and R. leguminosarum are strikingly different from those of other Gram-negative bacteria (Fig. 1). We are studying the biosynthesis of R. etli lipid A to identify novel lipid A-modifying enzymes and the genes encoding them. So far, we have discovered a 4′- and a 1-phosphatase (36, 37), a C28 acyltransferase (38), and a 3-O-deacylase (17), all of which appear to be unique to the R. etli system when compared with E. coli. However, the enzyme(s) that incorporate the 4′-galacturonic acid residue and the proximal aminogluconate unit of R. etli lipid A (Fig. 1) are not yet known, in part because of uncertainties surrounding the structure of R. etli lipid A. Consequently, we decided to reinvestigate R. etli lipid A, using new conditions for lipid A purification (13) and improved procedures for high resolution NMR spectroscopy (25).
In this and the accompanying paper (13), we have presented a more complete structural picture of R. etli lipid A than previously proposed (Fig. 1). Our analyses of intact lipid A molecules isolated from whole cells by hydrolysis at pH 4.5 have revealed that lipid A of R. etli consists of a mixture of at least six structurally related but distinct components rather than a single species. Four of these (B, C, D-1, and E) appear to be physiologically relevant, whereas A and D-2 are probably formed during hydrolysis and purification.
In the current study, the substitution patterns and glycosidic linkages of the lipid A species of R. etli were directly analyzed by NMR methods without the need for cumbersome chemical modifications and/or fragmentation. Our NMR procedures enable the study of lipid A molecules in their intact state and provide independent validation of conclusions derived from destructive methods. Indeed, our NMR data in conjunction with the mass spectrometry presented in the accompanying article (13) are in complete accord and provide a coherent proposal for the revised R. etli lipid A structures shown in Fig. 1. The two-dimensional NMR methods that we have employed have also allowed identification of the sites of deacylation in components C and E. The 3-O-deacylase that has recently been discovered in R. leguminosarum and R. etli membranes (17) nicely accounts for these species as derivatives of B and D-1, respectively.
Most significantly, several specific cross-peaks are observed in the COSY analysis of all six lipid A components (Fig. 3 and supplementary figures) that are diagnostic of the presence of an unusual acyloxyacyl moiety in each of these molecules (Fig. 1). In previous work, the absence of an acyloxyacyl residue was explicitly proposed based on the failure of R. etli lipid A to release an acyloxyacyl unit following Kraska methylation (11). However, no direct physical studies of purified, intact R. etli lipid A molecules were reported prior to the present investigation.
Establishing the presence or absence of an acyloxyacyl moiety in a lipid A molecule is critical, because this functionality is often necessary for effective stimulation of the innate immune system of animals (39, 40). Whether or not certain types of lipid A can also induce innate immune responses in plants is unknown. Recent evidence supports the idea that plants may have evolved systems of innate immunity, perhaps analogous to the Toll-like receptor system for lipid A in animals (41, 42). Interestingly, tobacco leaves develop disease resistance in response to certain types of infused lipopolysaccharides (43). We favor the view that the unusual structure of lipid A in R. etli somehow facilitates symbiosis by masking the potential immuno-stimulatory activity that might be associated with a more conventional (phosphate-containing) lipid A structure. Perhaps, the plant does not reject the R. etli endosymbiont because R. etli lipid A is not recognized by the innate immune system of the plant. In this scenario, the plant could still respond to infections by Gram-negative pathogens that possess a conventional phosphate-containing lipid A moiety, while retaining the nitrogen-fixing endosymbiont.
The analytical methods that we have developed and the microheterogeneity that we have documented allow us to formulate for the first time a specific hypothesis regarding the enzymatic origin of the aminogluconate unit in D-1 and E (Fig. 12), a biochemical entity that has not been described in other systems. Our ability to test this hypothesis relies entirely upon our preparation of a pure sample of 14C-laleled B (Fig. 11). This approach would not have been possible without the identification and availability of a nonradioactive standard of B, characterized by definitive structural criteria, as described above. Our initial in vitro experiment clearly reveals that R. etli and R. leguminosarum membranes contain enzyme(s) capable of metabolizing 14C-labeled B to a product that migrates like D-1, as judged by TLC (Fig. 11). This membrane-bound activity is highly efficient (Fig. 11) and is likely to be the first example of an oxidation of a lipid A-like molecule. Further characterization of this interesting new system is underway.
The genes encoding the unique lipid A-modifying enzymes of R. etli have not yet been identified, but if available, they could be exploited in various important ways. For instance, they could be used in the production of hybrid lipid A structures in recombinant bacterial strains, possibly giving insights into the functions of lipid A in outer membrane assembly and providing new systems for the development of vaccines and adjuvants. It will also be of great interest to determine how novel hybrid lipid A structures prepared with specific R. etli enzymes affect the innate immune responses of animals or plants, in comparison with those that that are normally elicited by E. coli or Salmonella lipid A. Lastly, defined mutations in the biosynthesis of R. etli lipid A should permit meaningful structure/function studies of lipid A during the establishment of symbiosis and nitrogen fixation in leguminous plants.
Supplementary Material
Footnotes
This work was supported by National Institutes of Health Grant R37-GM-51796 (to C. R. H. R.). The Duke University NMR Center is supported in part by National Institutes of Health Grant P30-CA-14236. NMR instrumentation was also funded by grants from the National Science Foundation, the National Institutes of Health, the North Carolina Biotechnology Center, and Duke University.
The on-line version of this article (available at http://www.jbc.org) contains additional figures.
The abbreviations used are: LPS, lipopolysaccharide; MALDI/TOF, matrix-assisted laser desorption ionization/time of flight; GalUA, galacturonic acid; COSY, correlation spectroscopy; TOCSY, total correlation spectroscopy; NOE, nuclear Overhauser effect; NOESY, NOE spectroscopy; HMQC, heteronuclear multiple-quantum coherence spectroscopy; RD, relaxation delay; MES, 4-morpholineethanesulfonic acid.
N. L. S. Que and C. R. H. Raetz, unpublished results.
The atom-labeling scheme is defined in Fig. 1. The pairs arise because of the nonequivalence of the magnetic environments of the geminal α-methylene protons of the β-hydroxyacyl substituents.
References
- 1.Long SR, Staskawicz BJ. Cell. 1993;73:921–935. doi: 10.1016/0092-8674(93)90271-q. [DOI] [PubMed] [Google Scholar]
- 2.Spaink HP, Kondorosi A, Hooykaas PJJ. The Rhizobiaceae: Molecular Biology of Model Plant-associated Bacteria. Kluwer; Dordrecht, The Netherlands: 1998. [Google Scholar]
- 3.Kannenberg EL, Brewin NJ. Trends Microbiol. 1994;2:277–283. doi: 10.1016/0966-842x(94)90004-3. [DOI] [PubMed] [Google Scholar]
- 4.Carlson RW, Bhat UR, Reuhs B. In: Plant Bio/Technology and Development. Gresshoff PM, editor. CRC Press; Boca Raton, FL: 1992. pp. 33–44. [Google Scholar]
- 5.Noel KD, Vandenbosch KA, Kulpaca B. J Bacteriol. 1986;168:1392–1401. doi: 10.1128/jb.168.3.1392-1401.1986. [DOI] [PMC free article] [PubMed] [Google Scholar]
- 6.Priefer UB. J Bacteriol. 1989;171:6161–6168. doi: 10.1128/jb.171.11.6161-6168.1989. [DOI] [PMC free article] [PubMed] [Google Scholar]
- 7.Kannenberg EL, Rathbun EA, Brewin NJ. Mol Microbiol. 1992;6:2477–2487. doi: 10.1111/j.1365-2958.1992.tb01424.x. [DOI] [PubMed] [Google Scholar]
- 8.Perotto S, Brewin NJ, Kannenberg EL. Mol Plant Microbe Interact. 1994;7:99–112. [Google Scholar]
- 9.Sindhu SS, Brewin NJ, Kannenberg EL. J Bacteriol. 1990;172:1804–1813. doi: 10.1128/jb.172.4.1804-1813.1990. [DOI] [PMC free article] [PubMed] [Google Scholar]
- 10.Tao H, Brewin NJ, Noel KD. J Bacteriol. 1992;174:2222–2229. doi: 10.1128/jb.174.7.2222-2229.1992. [DOI] [PMC free article] [PubMed] [Google Scholar]
- 11.Bhat UR, Forsberg LS, Carlson RW. J Biol Chem. 1994;269:14402–14410. [PubMed] [Google Scholar]
- 12.Forsberg LS, Carlson RW. J Biol Chem. 1998;273:2747–2757. doi: 10.1074/jbc.273.5.2747. [DOI] [PubMed] [Google Scholar]
- 13.Que NLS, Lin S, Cotter RJ, Raetz CRH. J Biol Chem. 2000;275:28006–28016. doi: 10.1074/jbc.M004008200. [DOI] [PMC free article] [PubMed] [Google Scholar]
- 14.Brewin NJ, Wood EA, Johnston AWB, Dibb NJ, Hombrecher G. J Gen Microbiol. 1982;128:1817–1827. [Google Scholar]
- 15.Kadrmas JL, Allaway D, Studholme RE, Sullivan JT, Ronson CW, Poole PS, Raetz CRH. J Biol Chem. 1998;273:26432–26440. doi: 10.1074/jbc.273.41.26432. [DOI] [PubMed] [Google Scholar]
- 16.Que NLS, Basu SS, White KA, Raetz CRH. FASEB J. 1998;12:1284. abstr. [Google Scholar]
- 17.Basu SS, White KA, Que NL, Raetz CR. J Biol Chem. 1999;274:11150–11158. doi: 10.1074/jbc.274.16.11150. [DOI] [PMC free article] [PubMed] [Google Scholar]
- 18.Raetz CRH, Kennedy EP. J Biol Chem. 1973;248:1098–1105. [PubMed] [Google Scholar]
- 19.Bax ARF, Morris GA. J Magn Reson. 1981;42:164–168. [Google Scholar]
- 20.Bax A, Freeman R. J Magn Reson. 1981;44:542–561. [Google Scholar]
- 21.Bax A, Davis DG. J Magn Reson. 1985;65:355–360. [Google Scholar]
- 22.Jeener J, Meier BH, Bachmann P, Ernst RR. J Chem Phys. 1979;71:4546–4552. [Google Scholar]
- 23.Summers MF, Marzili LG, Bax A. J Am Chem Soc. 1986;108:4285–4294. [Google Scholar]
- 24.Bax A, Subramanian S. J Magn Reson. 1986;67:565–569. [Google Scholar]
- 25.Ribeiro AA, Zhou Z, Raetz CRH. Magn Res Chem. 1999;37:620–630. [Google Scholar]
- 26.Takayama K, Qureshi N, Mascagni P, Nashed MA, Anderson L, Raetz CRH. J Biol Chem. 1983;258:7379–7385. [PubMed] [Google Scholar]
- 27.Takayama K, Qureshi N, Mascagni P, Anderson L, Raetz CRH. J Biol Chem. 1983;258:14245–14252. [PubMed] [Google Scholar]
- 28.Agrawal PK. Phytochemistry. 1992;31:3307–3330. doi: 10.1016/0031-9422(92)83678-r. [DOI] [PubMed] [Google Scholar]
- 29.Agrawal PK, Bush CA, Qureshi N, Takayama K. Adv Biophys Chem. 1994;4:179–236. [Google Scholar]
- 30.van Halbeek H. In: Encyclopedia of NMR. Grant DM, Harris RK, editors. Vol. 2. Wiley; Chichester: 1996. pp. 1107–1137. [Google Scholar]
- 31.Takayama K, Qureshi N, Mascagni P. J Biol Chem. 1983;258:12801–12803. [PubMed] [Google Scholar]
- 32.Strain SM, Armitage IM, Anderson L, Takayama K, Qureshi N, Raetz CRH. J Biol Chem. 1985;260:16089–16098. [PubMed] [Google Scholar]
- 33.Zähringer U, Lindner B, Rietschel ET. In: Endotoxin in Health and Disease. Brade H, Opal SM, Vogel SN, Morrison DC, editors. Marcel Dekker, Inc; New York: 1999. pp. 93–114. [Google Scholar]
- 34.Masoud H, Perry MB, Richards JC. Eur J Biochem. 1994;220:209–216. doi: 10.1111/j.1432-1033.1994.tb18616.x. [DOI] [PubMed] [Google Scholar]
- 35.Karunaratne DN, Richards JC, Hancock RE. Arch Biochem Biophys. 1992;299:368–376. doi: 10.1016/0003-9861(92)90289-9. [DOI] [PubMed] [Google Scholar]
- 36.Price NJP, Jeyaretnam B, Carlson RW, Kadrmas JL, Raetz CRH, Brozek KA. Proc Natl Acad Sci U S A. 1995;92:7352–7356. doi: 10.1073/pnas.92.16.7352. [DOI] [PMC free article] [PubMed] [Google Scholar]
- 37.Brozek KA, Kadrmas JL, Raetz CRH. J Biol Chem. 1996;271:32112–32118. [PubMed] [Google Scholar]
- 38.Brozek KA, Carlson RW, Raetz CRH. J Biol Chem. 1996;271:32126–32136. doi: 10.1074/jbc.271.50.32126. [DOI] [PubMed] [Google Scholar]
- 39.Raetz CRH. In: Escherichia coli and Salmonella: Cellular and Molecular Biology. 2. Neidhardt FC, editor. Vol. 1. American Society for Microbiology; Washington, D.C: 1996. pp. 1035–1063. [Google Scholar]
- 40.Rietschel ET, Kirikae T, Schade FU, Mamat U, Schmidt G, Loppnow H, Ulmer AJ, Zähringer U, Seydel U, Di Padova F, Schreier M, Brade H. FASEB J. 1994;8:217–225. doi: 10.1096/fasebj.8.2.8119492. [DOI] [PubMed] [Google Scholar]
- 41.Medzhitov R, Janeway CA., Jr Curr Opin Immunol. 1998;10:12–15. doi: 10.1016/s0952-7915(98)80024-1. [DOI] [PubMed] [Google Scholar]
- 42.Borregaard N, Elsbach P, Ganz T, Garred P, Svejgaard A. Immunol Today. 2000;21:68–70. doi: 10.1016/s0167-5699(99)01570-4. [DOI] [PubMed] [Google Scholar]
- 43.Graham TL, Sequeira L, Huang TS. Appl Environ Microbiol. 1977;34:424–432. doi: 10.1128/aem.34.4.424-432.1977. [DOI] [PMC free article] [PubMed] [Google Scholar]
- 44.Price NPJ, Kelly TM, Raetz CRH, Carlson RW. J Bacteriol. 1994;176:4646–4655. doi: 10.1128/jb.176.15.4646-4655.1994. [DOI] [PMC free article] [PubMed] [Google Scholar]
Associated Data
This section collects any data citations, data availability statements, or supplementary materials included in this article.


