Abstract
Cu K-, L- and S K-edge X-ray absorption spectroscopic (XAS) data have been combined with density functional theory (DFT) calculations on [{(TMPA)Cu}2S2](ClO4)2 (1), [{Cu[HB(3,5-Pri2pz)3]}2(S2)] (2) and [{(TMEDA)Cu}2(S2)2](OTf)2 (3) to obtain a quantitative description of their ground state wavefunctions. The Cu L-edge intensities give 63% and 37% Cu d-character in the ground state of 1 and 2, respectively while the S K-pre-edge intensities reflect 20% and 48% S character in their ground states. These data indicate a more than two-fold increase in the total disulfide bonding character in 2 relative to 1. The increase in the number of Cu-S bonds in 2 (µ-η2:η2 S22− bridge) compared to 1 ((µ-η1:η1 S22− bridge), dominantly determines the large increase in covalency and Cu-disulfide bond strength in 2. Cu K- and L- and S K-pre-edge energy positions directly demonstrate the CuII/(S2−)2 nature of 3. The two disulfide(•1−)’s in 3 undergo strong bonding interactions which destabilize the resultant filled antibonding π* orbitals of the (S2−)2 fragment relative to the Cu 3d levels. This leads to an inverted bonding scheme in 3 with dominantly ligand based holes in its ground state, consistent with its description as a dicopper(II)-bis-disulfide(•1−) complex.
Keywords: XAS, Cu K-edge, Cu L-edge S K-edge, Disulfide, Cu-S bonding
1. Introduction
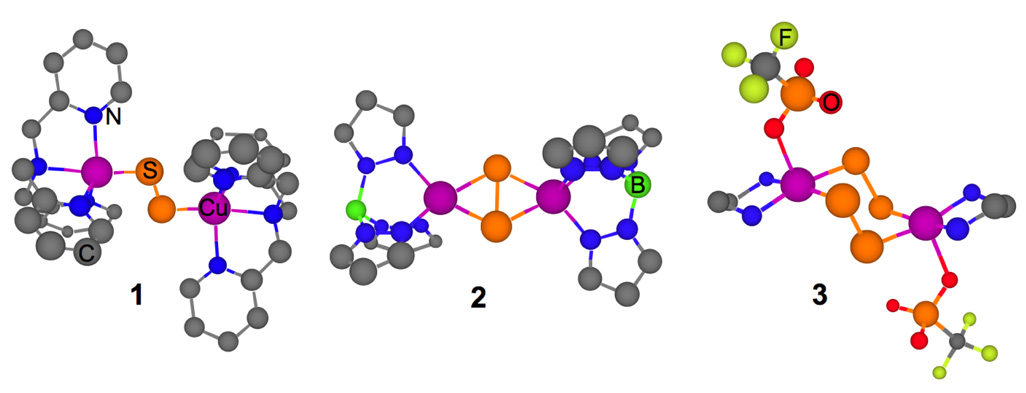
A number of interesting Cu-S containing complexes have recently been synthesized and structurally characterized. These include [{(TMPA)Cu}2S2](ClO4)2 (1),1 which has a planar Cu2S2 core in a trans µ-1,2 geometry (Scheme 1), [{Cu[HB(3,5-Pri2pz)3]}2(S2)] (2),2 which has a planar Cu2S2 diamond core in a µ η2:η2 geometry and [{(TMEDA)Cu}2(S2)2](OTf)2 (3),3 which has a novel [Cu2(S2)2)]2+ center in a chair conformation and has a µ-1,2 [Cu2(S2)2)]2+ geometry. Copper-sulfur bonding is an important issue in materials- and nano-chemistry in determining the electrical and magnetic properties of chalcogenides.4–6 Cu-sulfide bonds are also present in biology, in particular in the Cuz site in nitrous oxide reductase in which a µ4-bridging sulfide tunes the multielectron transfer for N2O reduction.7–9
Scheme 1.
Structures of 1 ([{Cu(TMPA)}2S2](ClO4)2), 2 [{Cu[HB(3,5-Pri2pz)3}]2(S2)] and 3 [{(TMEDA)Cu}2(µ-1,2-S2)2](OTf)2. The isopropyl groups in 2 and the methyl groups in 3 have been omitted for clarity.
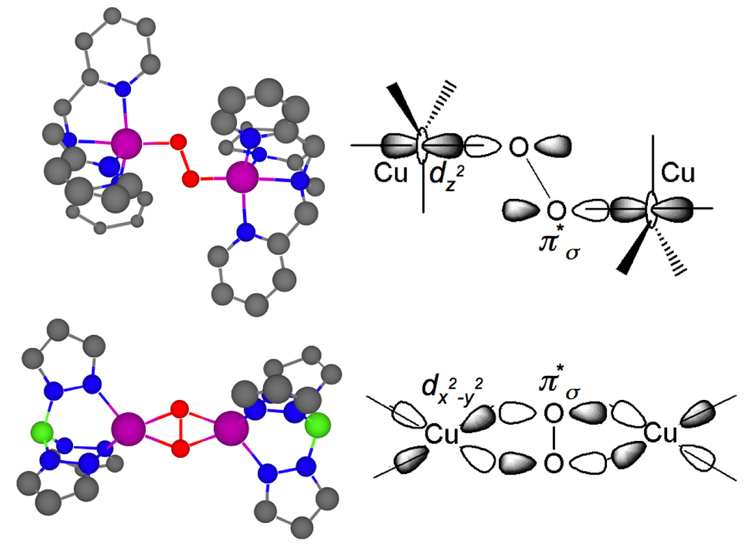
Spectroscopic studies and DFT calculations on 1 and 2 have shown that their geometric and electronic structures are similar to their well-studied peroxide analogues, [{(TMPA)Cu}2O2]2+ 10 and [{Cu[HB(3,5-Pri2pz)3]}2(O2)].11 Descriptions of the ground state wavefunctions for [{(TMPA)Cu}2O2]2+ and [{Cu[HB(3,5-Pri2pz)3]}2(O2)] are presented in Scheme 2.12,13 In both complexes, empty Cu 3d orbitals of the two [(L)Cu]+ fragments engage in a σ-bond with the filled π* antibonding orbital of the O22− fragment. This σ-bonding interaction is calculated to be much stronger in [{Cu[HB(3,5-Pri2pz)3]}2(O2)] than in [{(TMPA)Cu}2O2]2+ since [{Cu[HB(3,5-Pri2pz)3]}2(O2)] has twice the number of Cu-O bonds in its side-on bridged structure.13 While the bonding in these compounds has been explored by both theoretical and experimental methods, it has not been possible to experimentally assess the oxygen character in the ground state wavefunction. 1 and 2 offer the possibility of using S K-edge XAS to experimentally evaluate these bonding differences as this method probes the S character in the ground state wavefunction. Cu L-edge XAS data complement the ligand K-edge data as these probe the Cu 3d character in the ground state. Thus, these data can be used to provide insights relevant to understanding the core bonding in the oxygen analogs.
Scheme 2.
Schematic showing the σ-bond between Cu 3d orbital and π* antibonding orbital of the O22− fragment in [{(TMPA)Cu}2O2]2+ (top) and [{Cu[HB(3,5-Pri2pz)3]}2(O2)] (bottom).
The charge of 3 is consistent with two possible electronic structure descriptions of its {Cu2(µ-1,2-S2)2}2+ core: dicopper(III)-disulfide and dicopper(II)-disulfide(•1−). The crystal structure of 3 shows a short S-S bond distance of 1.95 Å which falls in-between S2 (1.89 Å) and H2S2 (2.05 Å) and is consistent with disulfide(•1−) assignment of 3.3 Resonance Raman data are also available for 3, which show a S-S stretching frequency of 613 cm−1, similar to the stretching frequency of S2•− (601 cm−1), which is also consistent with a disulfide(•1−) assignment.3 However, these vibrational data are complicated by the presence of two S2•− fragments, which can potentially couple.
In this study, the combination of Cu K- and L- and S K-edge XAS is used to quantitatively define the ground state wavefunction of 1 and 2. These data are coupled with DFT calculations to understand the differences in bonding between the end-on and side-on [Cu2S2]2+ complexes. These results are then extended to XAS and DFT studies on the novel [Cu2(S2)2]2+ complex, 3, to quantitatively determine the ground state electronic structure. The results support the assignment of 3 as a dicopper(II)-disulfide(•1−) complex. Cu L-edge and S K-edge XAS data have been coupled with DFT calculations to explore the factors that determine a ligand- vs metal-centered hole in 3.
2. Experimental Section
2.1 Sample Preparation
Compounds 1, 2, 3 and Na2S2 were synthesized as reported previously.1–3,14,15 1 and 2 were handled in a glove bag under inert N2 atmosphere and at dry ice temperatures and were transferred to the sample compartment under dry ice in a N2 atmosphere. 3 is extremely moisture and O2 sensitive and the Cu K-and L-edge and S K-edge XAS samples were prepared inside an O2 free glove box and transferred to the sample compartment at the beamline under a N2 atmosphere. For Cu K-edge XAS, 1 and 2 were finely ground with BN into a homogeneous mixture and pressed into a 1 mm aluminum spacer between X-ray transparent Kapton tape. The samples were immediately frozen and stored under liquid N2. During data collection the samples were maintained at a constant temperature of 10 K using an Oxford Instruments CF 1208 liquid helium cryostat. The Cu L-edge samples were similarly treated and spread thinly over double-sided adhesive conducting graphite tape on an Al sample paddle. The paddles were transferred onto a magnetic manipulator in an antechamber pre-chilled with liquid N2 and then transferred into the main chamber. They were then affixed to an Al block, which was cooled through conduction by a continuous flow of liquid He into a Cu block in an internal cavity. For the Cu L-edge measurements the temperature was monitored using a Lakeshore temperature controller and maintained at 20 K during the course of data collection. The samples were positioned at 45° to the incident beam. For S K-edge XAS, 1 and 2 were finely ground and dispersed as thinly as possible on Mylar tape to minimize the possibility of self-absorption effects. The temperature was regulated using a cryostat, which uses a liq N2 cooled N2 gas flow through a channel in the sample holder.
2.2 X-ray Absorption Spectroscopy
2.2.1 Cu K-edge
The X-ray absorption spectra of 1, 2 and 3 were measured at the Stanford Synchrotron Radiation Laboratory on the focused 16-pole 2.0 T wiggler beam line 9-3 under standard ring conditions of 3 GeV and 80–100 mA. A Si(220) double crystal monochromator was used for energy selection. A Rh-coated harmonic rejection mirror and a cylindrical Rh-coated bent focusing mirror were used for beam line 9-3 to reject components of higher harmonics. Fluorescence mode was used to measure data to k = 13.4 Å−1 employing a Canberra Ge 30-element solid array detector. Internal energy calibration was accomplished by simultaneous measurement of the absorption of a Cu-foil placed between two ionization chambers situated after the sample. The first inflection point of the foil spectrum was assigned to 8980.3 eV. Spectra presented here are the averages of 3, 5 and 2 scans for 1, 2 and 3, respectively, which were processed by fitting a second-order polynomial to the pre-edge region and subtracting this from the entire spectrum as background. A three-region spline of orders 2, 3 and 3 was used to model the smoothly decaying post-edge region. The data were normalized by subtracting the cubic spline and by assigning the edge jump to 1.0 at 9000 eV using the PySpline program.16
2.2.2 Cu L-edge
Cu L-edge X-ray absorption spectra were recorded at SSRL on the 31-pole wiggler beam line 10-1 under ring operating conditions of 50–100 mA and 3 GeV with a spherical grating monochromator with 1000 lines/mm and set at 30 µm entrance and exit slits. Sample measurements were performed using total electron yield mode, where the sample signal (I1) was collected with a Galileo 4716 channeltron electron multiplier aligned to 45° relative to the copper paddle. All samples were finely ground using an agate mortar and pestle and spread thinly across double-sided adhesive, conductive graphite tape attached to the copper paddle. The average ground powder particle size achieved was ~1–2 µm. 17 This method of sample preparation was found to minimize the effect of self-absorption even with large counterions like PF6−, ClO4− and BArF−. The signal was flux normalized (I1/I0) using the photocurrent of a gold-grid reference monitor (I0). Data for all samples were recorded in a sample chamber maintained below 10−6 Torr, isolated from the UHV beam line by a 1000 Å Al window. External energy calibration was accomplished by L-edge measurements on CuF2 before and after the sample. The L3 and L2 peak maxima were assigned to 930.5 eV and 950.5 eV, respectively. The variance in this calibration energy measured prior to and after each sample scan was used to linearly shift the experimental spectra between calibration scans. Spectra presented here are 3–5 scan averages, which were processed by fitting a second-order polynomial to the pre-edge region and subtracting it from the entire spectrum as background, resulting in a flat post-edge. The data were normalized to an edge jump of 1.0 at 1000 eV. The area under the 2p→3d peak associated with the L3 edge was quantified by fitting the data using EDG_FIT.18 The pre-edge feature was modeled with pseudo-Voigt line-shapes with a fixed 1:1 Lorentzian:Gaussian ratio. The total integrated area under the L-edges was also obtained for comparison. Two arctangents were subtracted from the baseline subtracted and normalized data, which were separated by 3/2*λL.S (20.25 eV). The total integrated area was obtained as a sum of the total area under the L3 (925–939 eV) and L2 (947–960 eV) edges.19 The percent Cu character in 1, 2 and 3 obtained by this method were within error of those obtained from EDG_FIT. The results obtained from the two methods are compared in Table S1.
2.2.3 S K-edge
S K-edge data of 1, 2, 3 and Na2S2 were measured using the SSRL 54-pole wiggler beamline 6-2 in high magnetic field mode of 10 kG with a Ni-coated harmonic rejection mirror and a fully tuned Si(111) double crystal monochromator. Details of the optimization of this beam line for low energy fluorescence measurements and the experimental setup have been described previously.20,21 The data were measured as fluorescence excitation spectra utilizing an ionization chamber as a fluorescence detector. The energy was calibrated from S K-edge spectra of Na2S2O3.5H2O, run at intervals between sample scans. Data normalization was performed as described in earlier publications.22 The area under the pre-edge peak was quantified by fitting the data using EDG_FIT.18 The pre-edge and rising edge features were modeled with pseudo-Voigt line-shapes with a fixed 1:1 Lorentzian:Gaussian ratio. The reported intensity and half-width values are based on an average over simultaneous fits that accurately modeled the data and their second derivative. Normalization procedures introduce ~3% error in the value of the integrated area under the pre-edge peak. The S K-edge spectra of 1, 2 and Na2S2 had contamination from elemental sulfur, which is the starting material in the synthesis of all three compounds. Thus, the spectrum of S8 was obtained and quantitatively subtracted from that of 1, 2 and Na2S2. This additionally increased the total error in the integrated area under the pre-edge peaks of 1 and 2 by ~8% (see Figure S3 for a comparison of the S K-edge XAS spectra of 1, 2 and S8). 3 has, in addition to the 4 sulfur bridging atoms, two S atoms from the triflate counterion. Thus, the data were renormalized to account for the edge-jump contribution from the counterion.
2.3 Electronic Structure Calculations
Gradient-corrected, (GGA) spin-unrestricted, broken symmetry, density functional calculations were carried out using the Gaussian0323 package on a 2-cpu Linux computer. Geometry optimizations were performed for each complex. The Becke8824,25 exchange and Perdew8626,27 correlation non-local functionals with Vosko-Wilk-Nusair28 local functionals as implemented in the software package (BP86) were employed. The triple-ζ 6-311G*29–31 and the double-ζ 6-31G*32–34 basis sets were used on the Cu and S atoms and the C, H, B, F, O and N atoms, respectively. Spin polarization was obtained by using the stable=opt keyword in Gaussian03. Population analyses were performed by means of Weinhold's Natural Population Analysis (NPA)35–37 including the Cu 4p orbitals in the valence set. Wave functions were visualized and orbital contour plots were generated in Molden.38 Compositions of molecular orbitals and overlap populations between molecular fragments were calculated using the PyMOlyze program.16
3. Results
3.1 Cu K-edge XAS
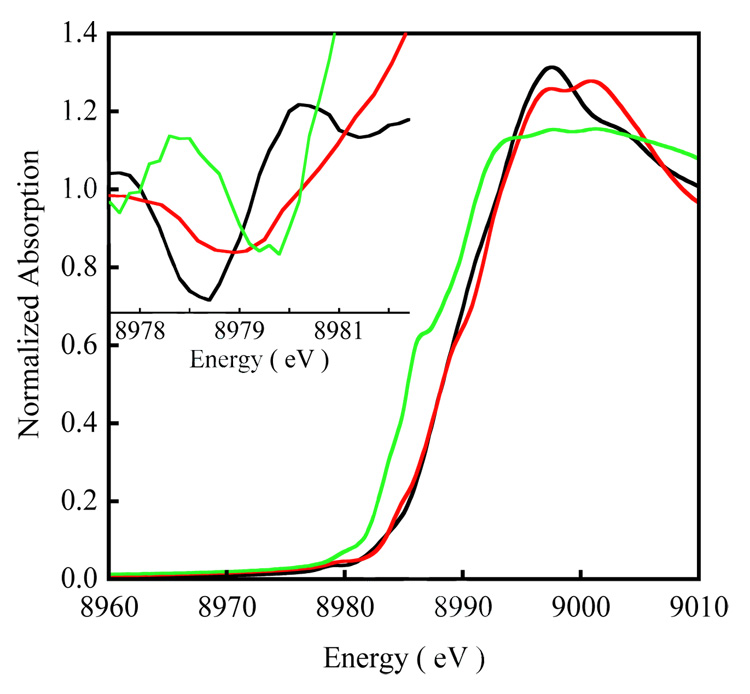
A comparison of the Cu K-edge XAS spectra of 1 and 2 is shown in Figure 1. The Inset shows the second derivative of the pre-edge region. The pre-edge feature observed at ~8979 eV is a low-intensity electronic dipole-forbidden quadrupole-allowed 1s→3d transition, which gains intensity from 4p mixing into the d-manifold due to deviation from centrosymmetry.39 This pre-edge transition occurs at 8978.5 eV for 1 and 8979.3 eV for 2 (Table 1). The pre-edge energy positions are consistent with a CuII assignment for both 1 and 2 (a typical CuII K-pre-edge occurs between ~8978.0 and 8980.0 eV).40 The featureless rising-edge of 1 and 2, and the edge energy position (~8995) eV are also consistent with a CuII assignment of both complexes.41 As has been demonstrated in earlier publications, the increase in the pre-edge energy position dominantly reflects the change in ligand-field,42,43 thus, the shift in the pre-edge position in 2 to 0.8 eV higher energy indicates an increase in ligand-field strength relative to 1 consistent with the increase in the number of strongly coordinating Cu-S bonds in 2.
Figure 1.
The normalized Cu K-edge XAS spectrum of 1 ( ), 2 (
 ) and 3 (
 ). Inset shows the expanded pre-edge region of the second derivative spectrum of the 1s→3d transition at ~8979 eV.
Table 1.
Cu K- and L-edge X-ray Absorption Edge Energy Positions (eV) and Cu Character in the .
| Cu K-edgea | Cu L-edgeb | ||||
|---|---|---|---|---|---|
| Complex | 1s→3d | 1s→4p + | 2p→3d | Cu Character in | |
| Shakedown | L3 edge | L2 edge | (per-hole)c | ||
| 1 | 8978.5 | - | 930.9 | 951.0 | 63%d |
| 2 | 8979.3 | - | 931.7 | 951.7 | 37%d |
| 3 | 8979.7 | 8985.7 | 932.0 | 952.0 | 22% |
Energy resolution ~1 eV.
Energy resolution ~0.1 eV.
Error in total intensity due to data processing and fitting is ± 5%.
Error in estimation of total intensity is 8% (see Experimental Section).
Figure 1 also shows a comparison of the Cu K-edge spectrum of 3 relative to those of the disulfide complexes 1 and 2. The pre-edge of 3 is higher in energy relative to 1 and 2 by 1.2 eV and 0.4 eV, respectively, and occurs at 8979.7 eV. This is in agreement with the assignment of 3 as a Cu(II) complex although it indicates an increase in ligand-field in 3 relative to 1 and 2. The experimental first shell bond distances and relevant bond angles for the three complexes are shown in Table S2. As stated above the increase in the number of Cu-S bonds on going from 1 to 2 leads to the increased ligand field strength. 3 also has two Cu-S bonds but its pre-edge energy increases by 0.4 eV relative to 2. This is due to the strong antibonding interaction between the two (S2)2− units of [Cu2(S2)2]2+ in 3 (vide infra) which destabilizes the Cu 3dx2−y2 orbitals and shifts the pre-edge to higher energy relative to 2.44 The rising-edge transition observed at 8985.7 eV results from a formally two-electron 1s→4pz + ligand-to-metal charge-transfer (LMCT) shakedown transition which becomes allowed due to final state relaxation effects. 40,45,46 Interestingly, this transition is only pronounced in 3.47 This low-energy feature is commonly observed in covalent complexes in D4h and C4v symmetries, in which the 1s→4pz (low-lying and non-interacting) orbital leads to a low-energy shakedown transition separated from the higher energy shakedown transitions accompanying the 1s→4px,y (in-plane and destabilized) main transition.45
3.2 Cu L-edge XAS
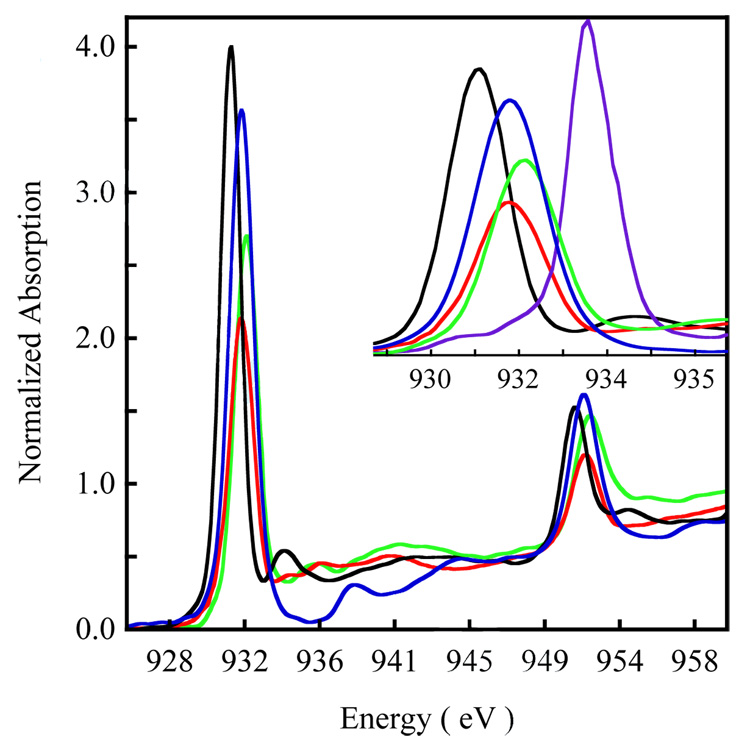
Figure 2 shows a comparison of the Cu L-edge spectra of 1 and 2. The spectrum of the well characterized D4h [CuCl4]2− complex (blue) has been included as a reference.48 The Cu (d9) L-edge spectrum reflects the dipole-allowed 2p→3d transition that splits into two peaks (L3 and L2) due to spin-orbit coupling. These peaks are separated by 3/2λL.S (λL.S=spin-orbit coupling, ~20.25 eV for Cu). For d9 Cu containing complexes, the final state associated with the 2p→3d transition is |2p3d10> (2p = 2p core hole). This results in core spin-orbit coupling but precludes excited state multiplet effects and d-d spin-orbit coupling (due to the filled d shell) resulting in a L3:L2 pre-edge intensity ratio of 2:1 due to the 4:2 degeneracy of the 2p3/2:2p1/2 states. The L2 edge (~950 eV) is broadened due to an additional Auger decay channel of the excited state, which is absent for the L3 edge (~930 eV).49 The L3 and L2 transitions occur at 930.9 eV and 951.0 eV for 1 and are shifted ~0.8 eV for 2 and occur at 931.7 and 951.7 eV (Table 1). This increase in the pre-edge transition energies is similar to that observed in the Cu K pre-edge shifts on going from 1 to 2.
Figure 2.
The normalized Cu L-edge XAS spectrum of 1 ( ), 2 (
 ) and 3 (
 ). The spectrum of D4h [Cu(Cl)4]2− (
 ) has been included as an energy and intensity reference. The inset shows the expanded L3 region. The spectrum of [CuIII(MNT)](TBA) (MNT = maleonitriledithiolate, TBA = tetra-n-butylammonium) 43 has been included for comparison of the ligand-field induced shift in the pre-edge position of a Cu(III) complex.
The ground state wave-function of any d9 Cu-S containing complex can be written as50:
| (1) |
where 1 − β2 − α2, β2 and α2 correspond to the Cu 3d, S 3p and residual (i.e. other than S 3p) ligand character, respectively. The L-edge transition is localized on the absorbing Cu center (2p→3d-component of ) and its intensity reflects the metal character in the (1 − β2 − α2). As the unoccupied metal 3d orbitals mix with filled ligand orbitals, β2 and α2 increase and the metal character decreases leading to a decrease in the L-edge transition intensity. A correlation of the total area under the L-edge of any Cu containing complex with the total area of D4h [CuCl4]2− (well studied by various spectroscopic methods with 61 ± 4% Cu character in the )22,48,51 gives a quantitative estimate of the amount of Cu character in the ground state. The total integrated area under the L3 edge of 1 and 2 are 6.22 and 3.69, respectively. Both 1 and 2 have two d9 Cu centers and an S=0 ground state (holes in henceforth referred to as ), in contrast to [CuCl4]2− which has one Cu center and has an S=1/2 ground state (one-hole in ). Thus, the areas under the L-edge transitions give the per-hole Cu character in 1 and 2, which are 63% and 37%, respectively (Table 1).52 This shows that the total Cu character has dramatically decreased on going from 1 to 2 indicating that the metal-ligand bonding in 2 is significantly more covalent than in 1. Figure 2 also compares the Cu L-edge spectrum of 3 with those of the disulfide complexes 1 and 2. The L3- and L2-edge energy positions of 3 occur at ~932.0 eV and ~952.0 eV, which is consistent with a CuII assignment for 3. The pre-edge position in 3 is shifted up in energy relative to 1 and 2 by 1.1 eV and 0.3 eV, respectively. These energy shifts are consistent with the Cu K pre-edge energy shifts observed for the three complexes and reflect increase in ligand field strength on going from 1 to 2 to 3.53,54 The total integrated area under the L3 edge of 3 is 4.33. Compound 3 contains a [Cu2(S2)2)]2+ unit which has two additional holes relative to the [Cu2S2]2+ units found in 1 and 2. Therefore, 3 is a four-hole system and these holes will be referred to as (see Analysis). The area under the pre-edge in 3 quantitates to 44% Cu character distributed over two holes, or 22% per-hole Cu 3d-character. This decrease in per-hole Cu character on going from 1 to 2 to 3, indicates an increase in covalent interaction with the Snn− ligand system across the series.
3.3 S K-edge XAS
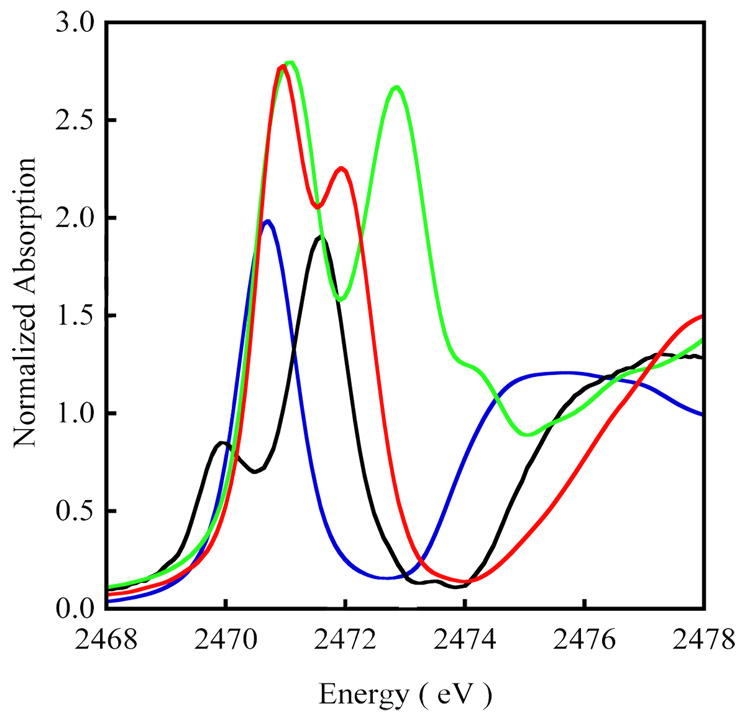
Figure 3 includes a comparison of the S K-edge XAS spectra of Na2S2 (blue)55 with 1 (black). The spectrum of Na2S2 is marked by a sharp transition at ~ 2470.7 eV which is the low-lying 1s→S-S σ* transition followed by the edge-jump at higher energy (2474.4 eV). In 1, the 1s→S-S σ* transition is shifted to higher energy and occurs at 2471.6 eV. The rising edge, which corresponds to the 1s→4p+continuum transition has shifted up to 2475.3 eV in 1, consistent with covalent bonding and charge donation from the disulfide to the Cu centers. In addition, a lower energy pre-edge transition is observed in 1 which occurs at 2469.9 eV and corresponds to the transition (see equation 1). Since the S K-edge XAS transition is localized on the absorbing S atom (S 1s→3p-component of ), as the filled S 3p orbitals mix with unoccupied Cu 3d orbitals, β2 increases leading to an increase in the S K pre-edge transition intensity. The total normalized area under the pre-edge transition of 1 is ~0.77. Since 1 is a two-hole system and contains two S atoms, the total intensity reflects the per-hole S character in the , which corresponds to 19.5% in 1. This relatively small contribution of S to the is consistent with the correspondingly large Cu contribution obtained from Cu L-edge XAS (see section 3.2).
Figure 3.
The normalized S K-edge XAS spectrum of 1 ( ), 2 (
 ) and 3 (
 ). The spectrum of the ionic disulfide, Na2S2 (
 ), has been included as reference.
Figure 3 also shows a comparison of the S K-edge spectra of 1 (blue) and 2 (red). The spectrum of 2 consists of two intense features at 2470.9 eV and 2471.9 eV corresponding to the (pre-edge) and the 1s→S-S σ* transitions, respectively. A dramatic change is observed in the pre-edge transition in 2, which is shifted to higher energy by ~1 eV and is more than twice as intense relative to 1. Since 2 is also a two-hole system and contains two S atoms, the total area of the pre-edge transition (1.88 units) reflects the per-hole S character in the and corresponds to 48% in 2. This indicates that, relative to 1, 2 has a significantly stronger covalent interaction between the disulfide and the CuII centers. This is consistent with a shift of the 1s→S-S σ* transition to higher energy in 2 (~2471.9 eV), which indicates a decrease in the electron density on the S atoms due to greater charge donation to the Cu atoms. This is also supported by the significantly decreased Cu character in the of 2 compared to that in 1 (see section 3.2).
Also included in Figure 3 is a comparison of the S K-edge XAS spectrum 3 (green) with those of the disulfide complexes 1 and 2. Similar to the disulfides, the spectrum of 3 contains two intense features corresponding to the (pre-edge) and the 1s→S-S σ* transitions. The second derivative spectrum (see Supporting Information, Figure S1) shows that there are two transitions under the pre-edge spectrum of 3 which are separated by ~0.7 eV and occur at 2470.6 eV and 2471.3 eV (Table 2). The intensity-weighted average energy of these two pre-edge transitions (2471.1 eV) is shifted ~0.2 eV to higher energy relative to the pre-edge of 2. This shift is consistent with the assignment of 3 as a CuII complex with a slightly stronger ligand-field environment, which destabilizes the valence anti-bonding orbitals and shifts the pre-edge to higher energy.56 Since 3 is a four-hole system and contains four S atoms, the total intensity under the two pre-edge transitions (3.04) directly reflects the per-hole S 3p character in the four unoccupied orbitals and corresponds to ~77% (Table 2). This large increase in total S character in 3 indicates that the holes are dominantly S based. This decreases the electron density on the S2n− moiety and is accompanied by a shift in the 1s→S-S σ* transition to 2473.0 eV, which is ~1 eV higher relative to 2.
Table 2.
S K X-ray Absorption Edge Energy Positions and Pre-edge Intensities
| Complex | S K-Pre-edgea Energy (eV) |
1s→S-S σ* (eV)b |
S Character in (per-hole)c |
|---|---|---|---|
| Na2S2 | - | 2470.7 | NA |
| 1 | 2469.9 | 2471.6 | 19.5%f |
| 2 | 2470.9 | 2471.9 | 48%f |
| 3 | 2470.6d | 2473.0 | 77% |
| 2471.3e |
Energy resolution ~0.2 eV.
Lowest energy edge transition.
Error in total intensity due to data processing and fitting is ± 5%.
The lower and higher energy pre-edge peaks, respectively. These peaks overlap strongly and the error in energy position estimation is ±0.2 eV.
Error in estimation of total intensity is 8% (see Experimental Section).
Cu K- and L-pre-edge transition energies indicate that 3 is a covalent CuII species. The S K-edge pre-edge transition energy of 3 is very similar to that in 2, which is consistent with a similar on the Cu atoms (charge on the Cu atom in a molecule). The significant increase in S character in the and the shift in the 1s→S-S σ* transition to higher energy in 3 indicate that the holes are predominantly S based which decreases the electron density on the S atoms. Thus Cu K- and L- edge and S K-edge XAS data support the previously proposed assignment of 3 as a [(CuII)2(S2 1−)2]2+ species.
4 Analysis
4.1 [Cu2S2]2+ Bonding: End-on vs Side-on
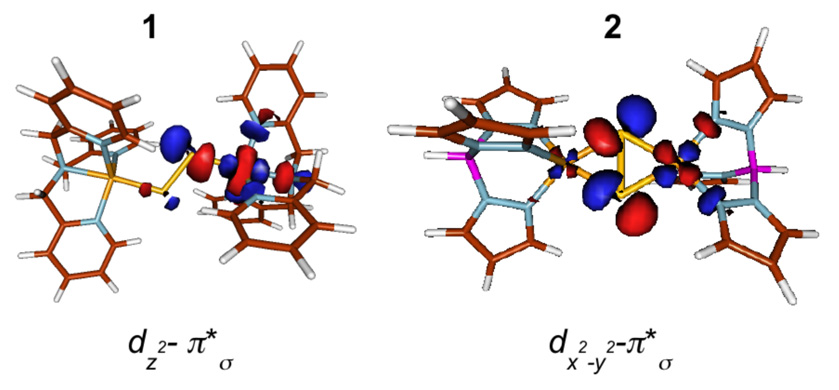
A d9 CuII complex can either have a dz2 (trigonal bipyramidal (TBP) geometry) or dx2−y2 (tetragonal geometry) ground state.13 In 1 (TBP), there are two CuII ions, which interact with the S22− ligand in an end-on fashion. The highest occupied orbitals on the disulfide are the degenerate π* orbitals, which split in energy upon interaction with the two Cu centers. The in-plane π* orbital (π*σ) interacts strongly with the Cu d orbitals while the out-of-plane π* orbitals (π*v) remain essentially non-bonding with the Cu d orbitals in both 1 and 2. Considering the symmetric (dz2A+dz2B) and antisymmetric (dz2A−dz2B) combination of the two Cu centers, only the symmetric combination can have net bonding interaction with the π*σ of the S22− which leads to the stabilization of the π*σ orbitals and to destabilization of the , which has dominantly dz2A+dz2B character. In 2 (square-pyramidal), the disulfide π*σ orbital interacts in a side-on fashion with the two Cu’s and can have net bonding interaction with the antisymmetric combination of the dx2−y2 orbitals on the Cu centers (dx2−y2A-dx2−y2B). To quantify this bonding description, density functional theory (DFT) calculations were performed on 1 and 2 and correlated with the XAS results. Selected DFT parameters are given in Table 3 and Molden generated contour plots are shown in Figure 4. The calculated Cu character in the of 1 and 2 are 65.0% and 40.4% respectively (Table 3), which are in reasonable agreement with the Cu L-edge XAS results (63% and 37% for 1 and 2, respectively). The calculated S character in the of 1 and 2 are 17.8% and 49.2%, which are also in reasonable agreement with the experimental results (19.5% and 48% for 1 and 2, respectively). This quantitative agreement of the DFT results with experiment indicates that theory provides a good description of the electronic structure of 1 and 2. Previous studies indicate that the total π*σ donor interaction from the bound S22− to the Cu almost doubles on going from 1 to 2.12 The experimental results presented here give a quantitative estimate of the increased covalency in 2 and show that the S character in the indeed more than doubles (an ~2.8 fold increase) in 2 and is associated with a dramatic decrease in the Cu character (63% to 37%). This results from the fact that there are four Cu-S bonds in the side-on (µ-η2:η2) disulfide bound complex 2, while there are only two Cu-S bonds in the end-on (µ-η1:η1) disulfide bound complex 1. DFT calculations show that the remaining non-S ligand character increases in 1 (~15%) relative to 2 (~10%), which reflects the fact that the increased donor interaction from S22− to Cu leads to a decrease in the donor interaction from the tris(pyrazolyl)hydroborate ligand.
Table 3.
Selected DFT Parameters.
| Complex | Mulliken Orbital Population |
Mulliken Charge | ||||
|---|---|---|---|---|---|---|
| Cu | S | N,C | Cu | S | N | |
| 1 | 65.0% | 17.8% | 10.7%, 4.0% | 1.31 | −0.68 | −0.67a |
| 2 | 40.4% | 49.2% | 8.9%, 1.5% | 1.13 | −0.47 | −0.45 |
| 3 | 30.0% | 59.8% | 8.54%, 0.77% | 1.02 | −0.21 | −0.94 |
| 11.0%b | 86%b | 1.61%, 0.16%b | ||||
The Mulliken charge on the N atoms differ by a small amount in the three complexes. An average value is presented here.
The composition of the orbital.
Figure 4.
DFT calculated beta-spin contour plots of 1 and 2. The plots were generated using Molden
4.2 [Cu2(S2)2)]2+ Bonding
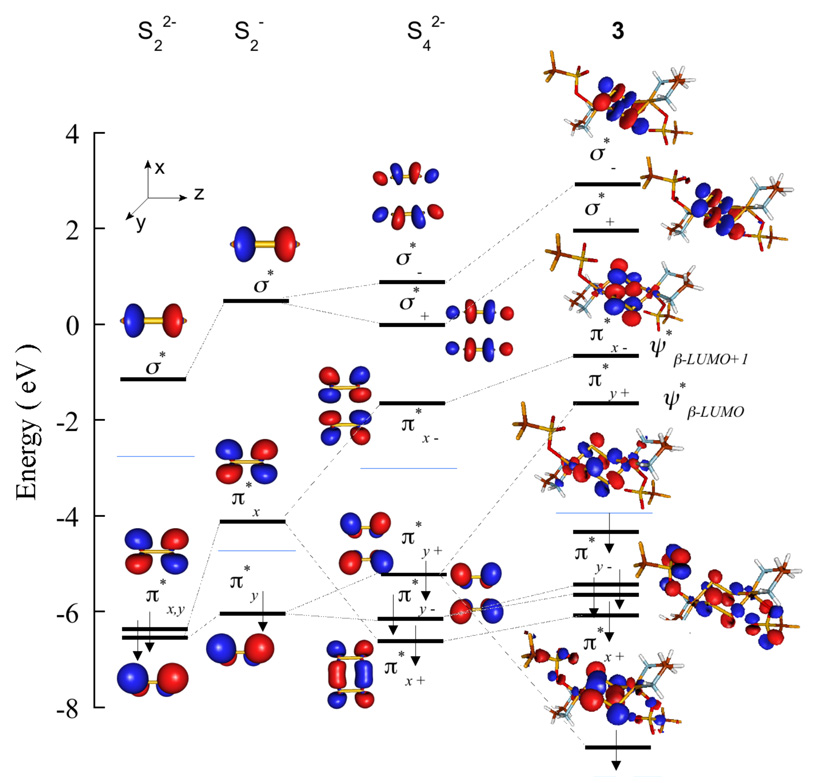
Cu K- and L- and S K-edge XAS indicate that bonding in 3 is consistent with a (LCuII)2-(S2•−)2 description of the ground state. Thus, in comparison to the disulfide in 1 and 2, the two S2n− moieties in 3 are each one-electron oxidized (disulfide(•1−)). In 3 the two S2•− units are planar and occupy the edges of a rectangle with the distance between the two S2•− fragments being 2.74 Å. Since the Van der Waals radius of S is ~1.85 Å,57 the atoms in the S2•− fragments can interact leading to symmetric and antisymmetric contributions of the in-plane and the out-of-plane S2•− 3p π* orbitals. To evaluate the nature of the FMO’s of the Snn− fragments on going from disulfide to bis-disulfide(•1−), DFT calculations were performed on the disulfide (S22−), disulfide(•1−) (S2•−) and the bis-disulfide(•1−) ([(S2)2]4−) systems (in a polarizable continuum to get accurate descriptions of the valence orbitals). Figure 5 compares the energy level diagrams for the three systems in which the S 1s orbitals have been energetically aligned. In S22− (S=0), the is a degenerate set of π antibonding orbitals (πx* and π*y: S-S is along the z-axis) the is the σ* antibonding combination of the 3pz atomic orbitals. In S2•− (S=1/2), considering beta-spin, there is one unoccupied orbital which corresponds to a hole in one of the π* orbitals. Additionally, in comparison to S22−, the FMO’s shift to higher energy relative to the S 1s level, consistent with one-electron oxidation. In [(S2)2]2− (S=0) the two sets of π* orbitals of individual S2•− fragments interact, giving rise to four non-degenerate orbitals. The in-plane π*x’s (see Figure 5 for coordinate system) interact strongly and split into π*x+ and π*x−, while the out-of-plane π*y’s interact relatively weakly and split into π*y+ and π*y−. A total of six electrons (three from each S2•− unit) occupy the π*x+, π*y+ and π*y− orbitals. The destabilized π*x− becomes the unoccupied while the π*y− is the . The are the two σ* orbitals which split into σ*+ and σ* −.
Figure 5.
DFT calculated beta-spin energy-level comparison of disulfide (S22−), disulfide(•1−) (S2•−), bis-disulfide(•1−) ([(S2)2]2−) and 3. S2•− is a one-hole system (S=1/2), while both bis-disulfide(•1−) and 3 are two-hole systems (S=0). Blue line indicates the gap between .
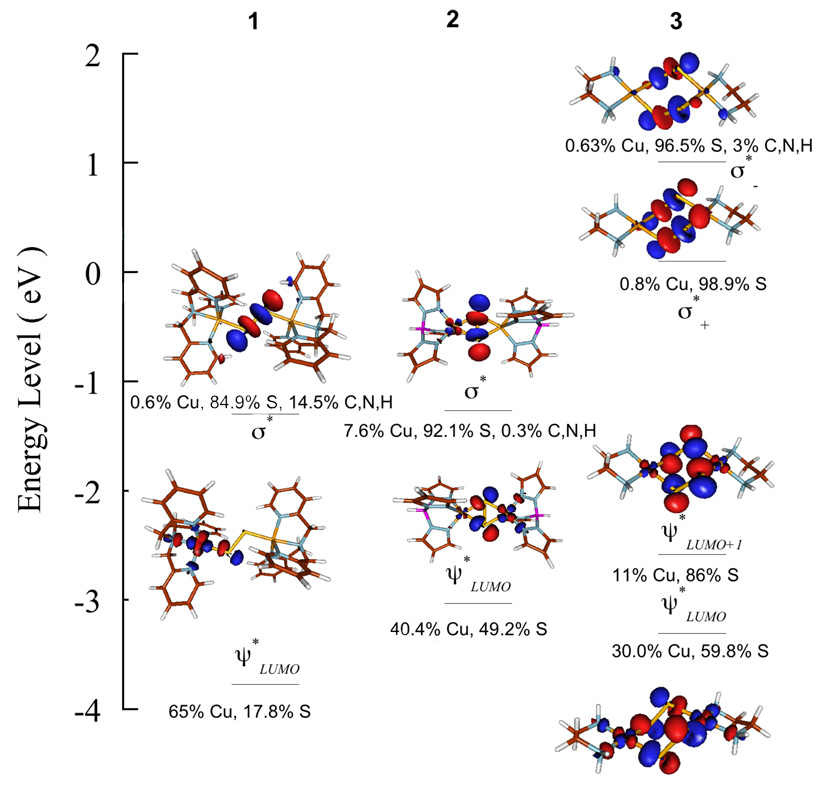
Spin unrestricted, broken-symmetry DFT calculations were performed on 3 and the energy level diagram is included in Figure 5 for comparison with the [(S2)2]2− fragment. Selected DFT parameters are presented in Table 3. In 3, the two Cu atoms, interact with the two S2•− ligands in an end-on fashion. Since the geometry of each Cu is tetragonal with a weak axial counterion interaction, the dimer symmetry leads to symmetric (dx2−y2A+dx2−y2B) and antisymmetric (dx2−y2A−dx2−y2B) combinations of the two Cu centers. DFT calculations show that the symmetric and antisymmetric combinations have net bonding interactions with the in-plane π*x− and out-of-plane π*y− orbital of the free [(S2)2]2−, respectively (Figure 5). This leads to two valence orbitals in 3, , with Cu 3d and S 3p character. The DFT calculated energy level diagram of the [Cu2(S2)2]2+ core in 3 and the [Cu2S2]2+ core interactions in 1 and 2 are shown in Figure 6 (the relevant valence orbitals with S 3p and Cu 3d character are shown) and compared to the S K-edge data presented in Figure 3 and Table 2. The S 1s orbitals have been energetically aligned for direct comparison to the S K-edge data. On going from 1 to 2 the calculated pre-edge energy position increases by 0.8 eV. In 3 the number of holes with S character increases to two, resulting in two pre-edge features . Calculations show that the are separated by 0.7 eV and their average energy position is ~0.1 eV higher than the pre-edge in 2. The calculated pre-edge energy positions are in agreement with the experimental data, which show pre-edge energy shifts of 1 eV on going from 1 to 2 and 0.1 eV on going from 2 to 3. In addition to the pre-edge energy positions, the average S-S σ* energy position increases by 0.1 eV on going from 1 to 2 and by 1.7 eV on going from 2 to 3 compared to the respective experimental shifts of 0.3 eV and 1.1 eV. These calculated S-S σ* energy positions are also in reasonable agreement with the experimental results (Table 2).
Figure 6.
DFT calculated beta-spin energy-level comparison of 1, 2 and 3. The S 1s orbitals have been energy aligned. The and S-S σ* with dominant S and Cu contributions have been shown. The relative energy difference between the and S-S σ* are in reasonable agreement with the experimental results (see Table 2 in main text). The S-S σ* is composed of dominantly S character. However, in the case of 2 ~7.6% Cu character is mixed. This is consistent with some back bonding interaction between the filled Cu d level and the S-S σ*.
In addition to the energy positions, Figure 6 also shows the composition of the valence orbitals of 1, 2 and 3. It has been shown in section 4.1 that the calculated ground state wavefunctions of 1 and 2 are in good agreement with the experimental results. In 3, the calculated has dominant S character (86%) with minor contribution from Cu 3d orbitals (11%). Thus, this [(S2)2]2− based clearly indicates that the ground state has a hole on the ligand and is consistent with a bis-disulfide(•1−) description of the molecule. DFT calculations also reveal that the is very covalent with 59.8% S character and 30.0% Cu character. The calculated combined S character in the two holes is 73% (average of 59.8% and 86%, (Table 3)), which is in reasonable agreement with the S K-edge results (77%). The two transitions from 2p to could not be observed in the Cu L-pre-edge due to the low intensity of the transition as has only 11% Cu character. However, the calculated total Cu character in the two holes is 20.5% per-hole (average of 30% and 11%, (Table 3)), which is also in agreement with the Cu L-edge results (22% per-hole). Thus, the experimental and DFT results give direct evidence that 3 is a very covalent dicopper(II)-bis-disulfide(•1−) complex. The preference of 3 for a ligand-based hole over a Cu-based hole (leading to a CuIII-disulfide complex) is considered below.
5 Discussion
5.1 Disulfide Complexes
Complexes 1 and 2 are disulfide analogues of end-on and side-on Cu2O2 complexes and have been previously shown to have very similar spectroscopic features as their peroxide analogues.12 Since the Cu2O2 complexes have important implications in the mechanism of O2 activation by tyrosinase, study of 2 relative to 1 can give an important handle on ligand-Cu interactions in the respective Cu2O2 complexes. O K-edge experiments (~540 eV) at cryogenic temperatures are exceptionally challenging due to the potential of water contamination and subsequent oxygen contamination of the sample surface in high vacuum chambers, which are required to obtain the spectra. Thus, S K-edge XAS on the Cu2S2 analogues, 1 and 2, can be used to obtain important information on the side-on vs end-on bonding from the ligand perspective. In this study a quantitative estimate of the ground state covalency has been obtained both from the metal (Cu L-edge) and ligand (S K-edge) XAS data which show that the ground state wavefunction is composed of 63% Cu and 19.5% S in 1 and 37% Cu and 48% S in 2; an increase in S character of ~2.5 fold on going from 1 to 2. This is consistent with two covalent Cu-S bonds per Cu in 2 relative to only one in 1.
Normal coordinate analyses on resonance Raman data have been published previously and show that the force constant of the S-S bond decreases from 2.41 to 1.82 mdyne/Å on going from 1 to 2.12 This indicates a significant weakening of the S-S bond. This is opposite to the behavior expected with the stronger covalent interaction in 2 relative to 1, since the resultant ground state should have less electron density on the S22− π* orbital and hence form a stronger S-S bond. On the other hand, it supports the idea that the weak S-S (and O-O in oxyHc and oxyTy) is due to back-bonding interaction from the filled Cu dx2−y2A+dx2−y2B in to the S-S σ* orbital in the side-on disulfide complex 2 which increases the electron density in the S-S σ* antibonding orbital. This results from the very covalent donor interaction of the S22−-CuII unit in 2. Note that the weakened S-S bond due to back-bonding interaction from the filled Cu dx2−y2A+dx2−y2B orbital, would tend to shift the S-S σ* orbital to lower energies. However, S K-edge XAS shows that the S 1s→σ* transition is 0.3 eV higher in 2 relative to 1. This reflects an increase in the effective nuclear charge on the S atom (leading to a shift in the S 1s orbital to deeper energy) due to the almost 2.5 fold increased S22− charge donation to Cu in 2 relative to 1. The lowering of the S-S σ* orbital energy is observed in DFT calculated energy gap between the filled Cu dx2−y2A+dx2−y2B orbital and S-S σ* orbital, which decreases in 2 (5.9 eV) relative to 1 (6.4 eV).
S K-edge XAS has been used here to probe the σ* orbital directly which has not been normally accessible by optical methods as the metal to ligand charge transfer (MLCT) band would be too high in energy. The relative energy of the σ* orbital in 1 and 2 has been quantitatively measured and indicates orbital energy shifts which are consistent with differences in S22−-Cu 3d donor-strengths.
5.2 Ligand vs Cu based Oxidation
Complex 3 was synthesized by the additional of elemental S8 to the (L)CuI precursor. The total charge of the molecule indicates that 3 contains a [Cu2(S2)2]2+ unit which could either be described as a [CuIII2(S22−)2]2+ system (Cu-based hole) or [CuII2(S2−)2]2+ system (ligand-based hole). In the initial characterization of 3, a short S-S bond distance (1.95 Å) and a 34S sensitive resonance Raman band at 613 cm−1 were observed, which together indicated a stronger S-S bond than for any known disulfide complexes.3 Based on the crystal structure and the rRaman data, 3 was assigned as having dominant dicopper(II)-bis-disulfide(•1−) character. These results are supported by the XAS data presented here which give direct evidence for a ligand-based oxidation in 3. In particular, Cu K- and L-pre-edge energy positions of 3 are consistent with its CuII assigment. The S K-pre-edge energy position is actually slightly higher than 2 indicating that Cu in 3 has a somewhat decreased positive charge inconsistent with a CuIII description. In addition, the large intensity of the S K-pre-edge peak indicates a ground state wavefunction with dominant S hole character consistent with ligand-based oxidation.
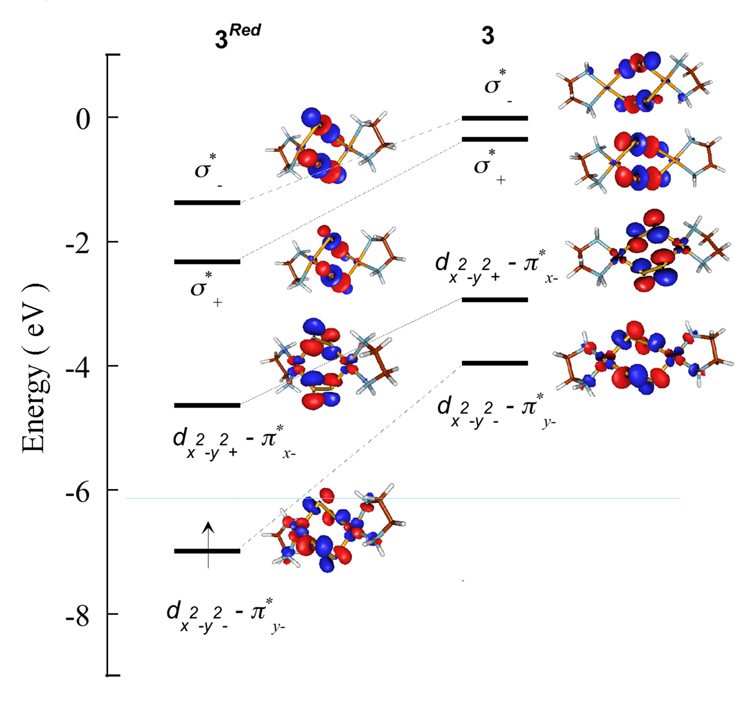
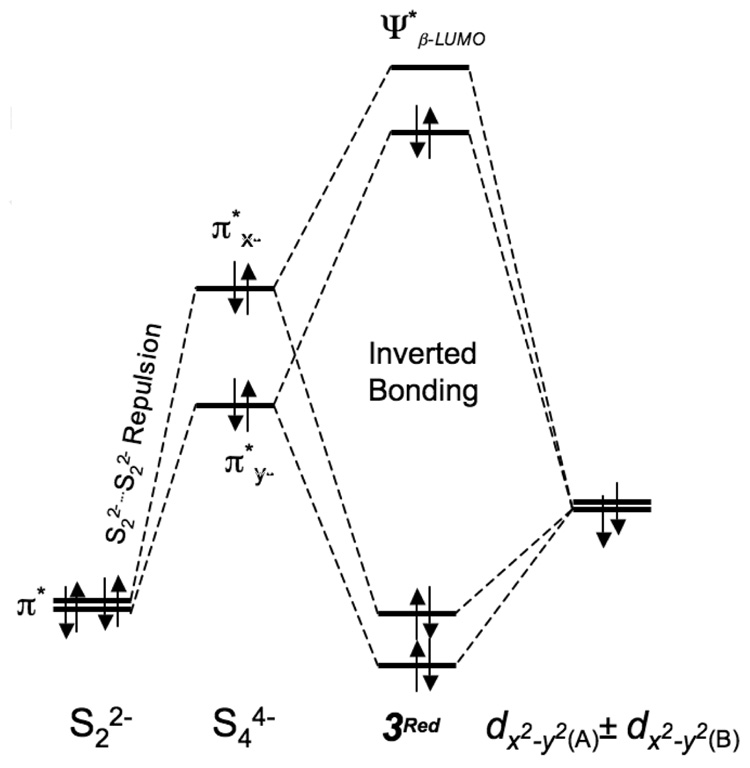
To understand the determining factor for a ligand-based hole, DFT calculations were also performed on a two-electron reduced form of 3 (3Red).58 Important geometric parameters are given in Scheme 3. Mulliken populations in the ground state wavefunction and the Mulliken charges are given in Table 4. The of 3Red is composed of 70.9% π*x− and 24.4% Cu dx2−y2A-dx2−y2B character (see Figure 7 for orbital lables). The remaining ~4.7% is distributed over the non-S ligands. The [Cu2(S2)2]0 unit in 3Red is redox-equivalent to the [Cu2S2]2+ unit in 1 and 2. A comparison of the ’s of 1 (end-on disulfide) with that of 3Red (end-on coordination to two S2n- units) shows that the covalency has increased almost four-fold in 3Red. Since the S character increases dramatically on going from 1 to 2 due to increase in the number of bound S atoms, a similar effect should contribute to the increased covalency in 3Red. However, 3Red is considerably more covalent even relative to 2 (Table 3), indicating an additional factor contributes to the net covalent sulfur bonding in 3Red. This can be evaluated by comparing the relative energies of the frontier molecular orbitals (FMO’s) of S22−, [(S2)2]4− and 3Red (see Scheme 4). In [(S2)2]4−, the two S22− units are within Van der Waals radii, which leads to bonding and antibonding interactions between the two S22− fragments and destabilizes the occupied FMO’s which interact with the (L)CuII fragment. The inter-S22− interaction raises the [(S2)2]4− fragment FMO’s to higher energy relative to the (L)CuII fragment (Scheme 4). Furthermore, the predominantly S-based ground state wave-function in 3Red (table 4) indicates that the [(S2)2]4− unit has lost a considerable amount of electron density to the (L)CuII fragment and has already gained some bis-disulfide(•1−) character. On going to 3, two electrons are lost from 3Red, one each from the , which contain a significant amount of [(S2)2]4− π*y− character. This results in a hole in the predominantly π-antibonding orbital of the bis-disulfide fragment leading to the formation of a dicopper(II)-bis-disulfide(•1−) species in 3.
Scheme 3.
DFT calculated bond distances (Å) for 3 and 3Red. The atoms are represented as colored spheres (Cu=pink, S=yellow, N=blue, C=gray).
Table 4.
Selected DFT Parameters for 3 and 3Red Optimized without the Triflate Counterions.
| Complex | Mulliken Orbital Population (%) | Mulliken Charge | |||||
|---|---|---|---|---|---|---|---|
| Cu | S | N,C | Cu | S | N | ||
| 3Red | 38.3 | 48.1 | 11.1, 2.5 | 0.90 | −0.53 | −0.90 | |
| 24.4 | 70.9 | 3.4, 1.3 | |||||
| 3 | 28.4 | 58.2 | 10.1, 3.5 | 0.96 | −0.17 | −0.96 | |
| 13.5 | 82.5 | 2.8, 1.3 | |||||
The Mulliken charge on the N and S atoms differ by a small amount in the two complexes. An average value is presented here.
Figure 7.
DFT calculated beta-spin energy-level comparison of 3Red and 3. The S 1s orbitals have been energy aligned. The relevant orbitals with dominant S and Cu contributions have been shown. Blue line indicates the gap between .
Scheme 4.
Schematic showing the destabilization of the π*y− and π*x− [(S2)2]4− orbitals due to inter S22− repulsion. This destabilization raises the ligand orbital above the Cu dx2−y2(A)±dx2−y2(B) set leading to inverted bonding scheme and dominant ligand composition in the ground state.
The inter-ligand interaction between the two S2•− units in [(S2)2]4− leads to some loss of occupied πx(Ag) (intra-ligand) bonding character due to its mixing with the unoccupied σ*_ (Ag) antibonding orbital. This leads to weakening of the intra ligand S-S bond, which is reflected in a decrease in the calculated intra-ligand S-S bond order (S2 •−=1.33, [(S2)2]2−=1.09). This results in a decrease in the calculated average S-S stretching frequency in [(S2)2]2− (561 cm−1)59 relative to S2•− (599 cm−1). This is interesting, because a comparison of the stretching frequencies of K2S2 (475 cm−1)60 with 1 and 2 (~500 cm−1)12 shows a 25 cm−1 increase in the S-S stretching frequency in 1 and 2, which reflects the decrease in electron density on S22− due to charge donation to Cu. However, a similar comparison between KS2 (598 cm−1)61 and 3 (613 cm−1) shows only a 15 cm−1 increase, indicating lesser charge donation from the bis-disulfide(•1−) to Cu in 3, which is inconsistent with the XAS data presented here. However, as shown above, the interaction between the two S2 •− units in 3 leads to weakening of the intra-ligand S-S bond. Thus, a quantitative comparison is best made between the [(S2)2]2− fragment and 3, which have calculated average stretching frequencies of ~560 cm−1 and ~601 cm−1, consistent with a greater charge donation from [(S2)2]2− to Cu in 3 compared to S22− to Cu in 1 and 2 (i.e, change in S-S stretching frequency of 40 cm−1 compared to 25 cm−1).
In summary, quantitative descriptions of the ground state wavefunctions of 1 and 2 have been obtained from a combination of Cu L- and S K-edge XAS. The results reveal that two Cu-S bonds in 2 compared to one in 1 lead to more than a two-fold increase in the covalent interaction. In addition the combination of Cu K- and L- and S K-edge spectra of 3 gives direct evidence for its dicopper(II)-bis-disulfide(•1−) nature. Spectroscopic data and calculations reveal that the two S2•− units of [(S2)2]2− undergo significant inter-ligand interactions, which destabilize the valence orbitals of the ligand fragment resulting in an inverted bonding scheme in 3. This inverted bonding leads to the ligand-based hole and an interesting electronic structure for 3.
Supplementary Material
The second derivative S K-edge XAS spectrum of 3, a grayscale figure of the L-edge spectrum shown in Figure 2, comparison of the S K-edge XAS spectrum of 1, 2 and S8, a comparison of the DFT calculated energy level diagram of relevant valence levels along with contour plots for 1, 2, 3 and 3Red the geometry-optimized Cartesian coordinates of 1, 2, 3 and 3Red and complete reference 21.
Acknowledgement
This research was supported by NIH Grants DK-31450 (E.I.S.), RR-01209 (K.O.H.), GM-47365 (W.B.T.), GM-28962 (K.D.K) and the JSPS Grants 14350471 and 17350043 (K.F.). SSRL operations are funded by the Department of Energy, Office of Basic Energy Sciences. The SSRL Structural Molecular Biology program is supported by the National Institutes of Health, National Center for Research Resources, Biomedical Technology Program and by the Department of Energy, Office of Biological and Environmental Research.
References
- 1.Helton ME, Chen P, Paul PP, Tyeklár Z, Sommer RD, Zakharov LN, Rheingold AL, Solomon EI, Karlin KD. J. Am. Chem. Soc. 2003;125:1160–1161. doi: 10.1021/ja027574j. [DOI] [PubMed] [Google Scholar]
- 2.Fujisawa K, Moro-oka Y, Kitajima N. J. Chem. Soc., Chem. Comm. 1994:623–624. [Google Scholar]
- 3.York JT, Brown EC, Tolman WB. Angew. Chem. Int. Ed. 2005;44:7745–7748. doi: 10.1002/anie.200503134. [DOI] [PubMed] [Google Scholar]
- 4.Dehnen S, Eichhofer A, Fenske D. Eur. J. Inorg. Chem. 2002:279–317. [Google Scholar]
- 5.Alivisatos AP. Science. 1996;271:933–937. [Google Scholar]
- 6.Weller H. Angew. Chem. Int. Ed. 1998;37:1658–1659. doi: 10.1002/(SICI)1521-3773(19980703)37:12<1658::AID-ANIE1658>3.0.CO;2-L. [DOI] [PubMed] [Google Scholar]
- 7.Chen P, Gorelsky SI, Ghosh S, Solomon EI. Angew. Chem. Int. Ed. 2004;43:4132–4140. doi: 10.1002/anie.200301734. [DOI] [PubMed] [Google Scholar]
- 8.Ghosh S, Gorelsky SI, George SD, Chan JM, Cabrito I, Dooley DM, Moura JJG, Moura I, Solomon EI. J. Am. Chem. Soc. 2007;129:3955–3965. doi: 10.1021/ja068059e. [DOI] [PMC free article] [PubMed] [Google Scholar]
- 9.Haltia T, Brown K, Tegoni M, Cambillau C, Saraste M, Mattila K, Djinovic-Carugo K. Biochem. J. 2003;369:77–88. doi: 10.1042/BJ20020782. [DOI] [PMC free article] [PubMed] [Google Scholar]
- 10.Tyeklár Z, Jacobson RR, Wei N, Murthy NN, Zubieta J, Karlin KD. J. Am. Chem. Soc. 1993;115:2677–2689. [Google Scholar]
- 11.Kitajima N, Fujisawa K, Fujimoto C, Moro-oka Y, Hashimoto S, Kitagawa T, Toriumi K, Tatsumi K, Nakamura A. J. Am. Chem. Soc. 1992;114:1277–1291. [Google Scholar]
- 12.Chen P, Fujisawa K, Helton ME, Karlin KD, Solomon EI. J. Am. Chem. Soc. 2003;125:6394–6408. doi: 10.1021/ja0214678. [DOI] [PubMed] [Google Scholar]
- 13.Solomon EI, Chen P, Metz M, Lee SK. Palmer, A. E. Angew. Chem. Int. Ed. 2001;40:4570–4590. doi: 10.1002/1521-3773(20011217)40:24<4570::aid-anie4570>3.0.co;2-4. [DOI] [PubMed] [Google Scholar]
- 14.Takata T, Saeki D, Makita Y, Yamada N, Kihara N. Inorg. Chem. 2003;42:3712–3714. doi: 10.1021/ic034084z. [DOI] [PubMed] [Google Scholar]
- 15.Yamada N, Furukawa M, Nishi N, Takata T. Chem. Lett. 2002:454–455. [Google Scholar]
- 16.Tenderholt A. PyMOlyze & PySpline. Stanford, CA: Stanford University; 2005. 94305. [Google Scholar]
- 17.Pickering IJ, George GN, Yu EY, Brune DC, Tuschak C, Overmann J, Beatty JT, Prince RC. Biochemistry. 2001;40:8138–8145. doi: 10.1021/bi0105532. [DOI] [PubMed] [Google Scholar]
- 18.George GN. EXAFSPAK & EDG_FIT. Stanford, CA: Stanford Synchrotron Radiation Laboratory, Stanford Linear Accelerator Center, Stanford University; 2000. p. 94309. [Google Scholar]
- 19.Wasinger EC, de Groot FMF, Hedman B, Hodgson KO, Solomon EI. J. Am. Chem. Soc. 2003;125:12894–12906. doi: 10.1021/ja034634s. [DOI] [PubMed] [Google Scholar]
- 20.Hedman B, Hodgson KO, Solomon EI. J. Am. Chem. Soc. 1990;112:1643–1645. [Google Scholar]
- 21.Gorelsky SI, Basumallick L, Vura-Weis J, Sarangi R, Hodgson KO, Hedman B, Fujisawa K, Solomon EI. Inorg. Chem. 2005;44:4947–4960. doi: 10.1021/ic050371m. [DOI] [PMC free article] [PubMed] [Google Scholar]
- 22.Shadle SE, Hedman B, Hodgson KO, Solomon EI. Inorg. Chem. 1994;33:4235–4244. [Google Scholar]
- 23.Pople JA, et al. Gaussian 03, revision C.02. 2004 [Google Scholar]
- 24.Becke AD. J. Chem. Phys. 1993;98:5648–5652. [Google Scholar]
- 25.Becke AD. Phys. Rev. A. 1988;38:3098–3100. doi: 10.1103/physreva.38.3098. [DOI] [PubMed] [Google Scholar]
- 26.Perdew JP, Burke K, Wang Y. Phys. Rev. B. 1998;57:14999. [Google Scholar]
- 27.Perdew JP. Phys. Rev. B. 1986;33:8822–8824. doi: 10.1103/physrevb.33.8822. [DOI] [PubMed] [Google Scholar]
- 28.Vosko SH, Wilk L, Nusair M. Can. J. Phys. 1980;58:1200–1211. [Google Scholar]
- 29.McGrath MP, Radom L. J. Chem. Phys. 1991;94:511–516. [Google Scholar]
- 30.Krishnan R, Binkley JS, Seeger R, Pople JA. J. Chem. Phys. 1980;72:650–654. [Google Scholar]
- 31.Curtiss LA, McGrath MP, Blaudeau JP, Davis NE, Binning RC, Radom L. J. Chem. Phys. 1995;103:6104–6113. [Google Scholar]
- 32.Rassolov VA, Pople JA, Ratner MA, Windus TL. J. Chem. Phys. 1998;109:1223–1229. [Google Scholar]
- 33.Hariharan PC, Pople JA. Theoret. Chimica Acta. 1973;28:213–222. [Google Scholar]
- 34.Francl MM, Hehre WJ, Binkley JS, Gordon MS, DeFrees DJ, Pople JA. J. Chem. Phys. 1982;77:3645–3665. [Google Scholar]
- 35.Reed AE, Curtiss LA, Weinhold F. Chem. Rev. 1988;88:899–926. [Google Scholar]
- 36.Foster JP, Weinhold F. J. Am. Chem. Soc. 1980;102:7211–7218. [Google Scholar]
- 37.Carpenter JE, Weinhold F. THEOCHEM. 1988;169:41–62. [Google Scholar]
- 38.Schaftenaar G, Noordik JH. Comput-Aided Mol. Des. 2000;14:123–134. doi: 10.1023/a:1008193805436. [DOI] [PubMed] [Google Scholar]
- 39.Shulman RG, Yafet Y, Eisenberger P, Blumberg WE. Proc. Natl. Acad. Sci. U.S.A. 1976;73:1384–1388. doi: 10.1073/pnas.73.5.1384. [DOI] [PMC free article] [PubMed] [Google Scholar]
- 40.DuBois JL, Mukherjee P, Stack TDP, Hedman B, Solomon EI, Hodgson KO. J. Am. Chem. Soc. 2000;122:5775–5787. [Google Scholar]
- 41.DeBeer S, Randall DW, Nersissian AM, Valentine JS, Hedman B, Hodgson KO, Solomon EI. J. Phys. Chem. B. 2000;104:10814–10819. [Google Scholar]
- 42.Sarangi R, Aboelella N, Fujisawa K, Tolman WB, Hedman B, Hodgson KO, Solomon EI. J. Am. Chem. Soc. 2006;128:8286–8296. doi: 10.1021/ja0615223. [DOI] [PMC free article] [PubMed] [Google Scholar]
- 43.Sarangi R, DeBeer George S, Rudd DJ, Szilagyi RK, Ribas X, Rovira C, Almeida M, Hodgson KO, Hedman B, Solomon EI. J. Am. Chem. Soc. 2007;129:2316–2326. doi: 10.1021/ja0665949. [DOI] [PMC free article] [PubMed] [Google Scholar]
- 44.The ligand field on 3 is also larger than 2 due to the following structural differences: the Cu is closer to the equatorial plane in 3 (0.17 Å) relative to 2 (0.3Å) and the S-Cu-S angle in 3 (74°) is wider than in 2 (54.5°).
- 45.Kau LS, Spira-Solomon DJ, Penner-Hahn JE, Hodgson KO, Solomon EI. J. Am. Chem. Soc. 1987;109:6433–6442. [Google Scholar]
- 46.Goddard WA, Blair RA. Phys. Rev. B. 1980;22:2767–2776. [Google Scholar]
- 47.Note that the rising edge of most Cu(I) complexes has an intense ~8984 eV feature corresponding to the 1s→4p transition. In 3, this edge transition is ~1.7 eV higher than most Cu(I) complexes and is similar in energy to that observed in other Cu(II) complexes (see reference 43 and 45).
- 48.George SJ, Lowery MD, Solomon EI, Cramer SP. J. Am. Chem. Soc. 1993;115:2968–2969. [Google Scholar]
- 49.Coster D, Kronig RDL. Physica. 1935;2:13–24. [Google Scholar]
- 50.DeBeer George S, Metz M, Szilagyi RK, Wang HX, Cramer SP, Lu Y, Tolman WB, Hedman B, Hodgson KO, Solomon EI. J. Am. Chem. Soc. 2001;123:5757–5767. doi: 10.1021/ja004109i. [DOI] [PubMed] [Google Scholar]
- 51.Solomon EI. Comments Inorg. Chem. 1984;3:227–320. [Google Scholar]
- 52.The L2 edge is convoluted with the edge jump of the L3 edge. Since increases the error in estimating the pre-edge intensity, only the L3 edge integrated areas of the unknown are compared to that of [CuCl4]2−. This is possible only in d9 complexes in which there is no redistribution of the L3 and L2 transition intensities.
- 53.An interesting comparison of the ligand-field of the Cu-S complexes 1, 2 and 3 is with inorganic CuS. The L3 edge of CuS (see reference 54) occurs at ~932.5 eV, ~0.5 eV higher than 3. This is due to the fact that CuS has four strong Cu-S bonds (relative to two Cu-N and two Cu-S ligation in 3), which destabilizes the Cu 3d manifold and shifts the Cu L pre-edge to higher energy.
- 54.Grioni M, Goedkoop JB, Schoorl R, de Groot FMF, Fuggle JC. Phys. Rev. B. 1989;39:1541–1545. doi: 10.1103/physrevb.39.1541. [DOI] [PubMed] [Google Scholar]
- 55.The S K-edge XAS spectrum of Na2S2 was collected in solid form and are subject to self-absorption which can lead to error in the transition intensities. However, this does not affect the energy positions of the spectra.
- 56.The S K-pre-edge transition energy of a Cu(III) complex is lower in energy relative to a Cu(II) complex reflecting the increase in the charge on the Cu atom in the molecule.
- 57.Pauling L. The Nature of the Chemical Bond. USA: Cornell University Press; 1945. [Google Scholar]
- 58.The geometry-optimized structure of 3 (including the triflate counterions) was used as the input structure for calculations on 3Red. However, subsequent geometry optimization steps resulted in the displacement of the triflate counterion from bonding distance with the [(LCu)2(S2)2]2+ core. Thus, the electronic structures of both 3 and 3Red were calculated using structural models without the triflate counterion.
- 59.Calculations show that there are two frequencies at 538 cm−1 and 583 cm−1 resulting from the symmetric and antisymmetric combination of the individual S-S stretches in (S2)22−. The average value indicates the S-S bond strength.
- 60.Böttcher P, Getzschmann J, Keller R. Z. Anorg. Allg. Chem. 1993;619:476–488. [Google Scholar]
- 61.Holzer W, Racine S, Cipriani J. J. Raman Spectrosc. 1978;7:22–25. [Google Scholar]
Associated Data
This section collects any data citations, data availability statements, or supplementary materials included in this article.
Supplementary Materials
The second derivative S K-edge XAS spectrum of 3, a grayscale figure of the L-edge spectrum shown in Figure 2, comparison of the S K-edge XAS spectrum of 1, 2 and S8, a comparison of the DFT calculated energy level diagram of relevant valence levels along with contour plots for 1, 2, 3 and 3Red the geometry-optimized Cartesian coordinates of 1, 2, 3 and 3Red and complete reference 21.


