Abstract
Topoisomerase II (Top2) is the primary target for active anti-cancer agents. We developed an efficient approach for identifying hypersensitive Top2 mutants and isolated a panel of mutants in yeast Top2 conferring hypersensitivity to the intercalator N-[4-(9-acridinylamino)-3-methoxyphenyl]methanesulphonanilide (mAMSA). Some mutants conferred hypersensitivity to etoposide as well as mAMSA, whereas other mutants exhibited hypersensitivity only to mAMSA. Two mutants in Top2, changing Pro473 to Leu and Gly737 to Val, conferred extraordinary hypersensitivity to mAMSA and were chosen for further characterization. The mutant proteins were purified, and their biochemical activities were assessed. Both mutants encode enzymes that are hypersensitive to inhibition by mAMSA and other intercalating agents and exhibited elevated levels of mAMSA-induced Top2:DNA covalent complexes. While Gly737 → Val Top2p generated elevated levels of Top2-mediated double strand breaks in vitro, the Pro473 → Leu mutant protein showed only a modest increase in Top2-mediated double strand breaks but much higher levels of Top2-mediated single strand breaks. In addition, the Pro473 → Leu mutant protein also generated high levels of mAMSA-stabilized covalent complexes in the absence of ATP. We tested the role of single strand cleavage in cell killing with alleles of Top2 that could generate single strand breaks, but not double strand breaks. Expression in yeast of a Pro473 → Leu mutant that could only generate single strand breaks conferred hypersensitivity to mAMSA. These results indicate that generation of single strand breaks by Top2-targeting agents can be an important component of cell killing by Top2-targeting drugs.
DNA topoisomerases are enzymes that alter DNA topology by the transient introduction of strand breaks that allow transformations such as changing the levels of DNA supercoiling and the decatenation of linked DNA molecules. Two major classes of topoisomerases are distinguished by the introduction of single stand breaks (type I topoisomerases) and double strand breaks (type II topoisomerases). Eukaryotic topoisomerase II (Top2)2 is a homodimer with each subunit capable of forming a covalent 5′-phosphotyrosyl intermediate with a DNA substrate. The generation of transient double strand breaks is biologically essential, because type II topoisomerases are required to complete the separation of newly replicated DNA molecules prior to cell division (1, 2). The generation of protein-linked DNA breaks is advantageous to prevent potential deleterious consequences of free double strand breaks (3, 4).
Biochemical and structural studies have illuminated many of the details of DNA cleavage by type II topoisomerases (reviewed in Ref. 5). Mutational analysis has identified residues that play key roles in the cleavage reaction (6, 7). These studies demonstrated that DNA cleavage by the tyrosine of each subunit requires the collaboration of other residues from the other subunit. A major DNA binding domain of one protomer that includes the active site tyrosine collaborates with residues from the other protomer that are part of a Rossman fold, leading to DNA cleavage. A recently determined x-ray crystal structure of the breakage-reunion domain of yeast Top2 bound to DNA elegantly supports this model (8). This structure shows amino acids from the Rossman fold in relatively close proximity to the active site tyrosine suggesting the assembly of catalytically active complex during the Top2 reaction cycle.
DNA topoisomerases have also proven to be effective anti-bacterial and anti-cancer drug targets (9–11). The clinically active agents block the enzyme reaction at steps where the enzyme is covalently bound to DNA. The efficacy of drugs targeting topoisomerases is due primarily to trapping the enzyme-DNA covalent intermediate, leading to DNA damage that includes DNA strand breaks, with the enzyme covalently bound to DNA. Such covalent intermediates are also capable of impeding cellular processes such as DNA replication and transcription. Because the drugs subvert the normal enzyme mechanism to generate toxicity, these drugs have been referred to as topoisomerase poisons.
Although the molecular details of the normal topoisomerase II reaction are becoming better understood, the action of drugs that trap covalent complexes has remained mysterious. Many different classes of compounds have been demonstrated to target DNA topoisomerases, including agents that likely bind directly to the enzyme, such as the epipodophyllotoxins etoposide and teniposide, and many agents that intercalate in DNA, such as anthracyclines, aminoacridines, and anthracenediones (12, 13). The chemical diversity of compounds that can target topoisomerase II has made it difficult to identify common features required for enzyme inhibition. A strategy for overcoming this obstacle is isolation of mutants that reduce drug sensitivity. This strategy has been applied both in mammalian cell systems, as well as systematically in lower eukaryotic model systems (14–16). These studies have suggested that many mutations that reduce enzyme activity can lead to drug resistance. Importantly, drug-resistant enzymes are typically (although not universally) crossresistant to all classes of topoisomerase poisons (13). Therefore, these mutations have provided limited information about the details of drug mechanisms.
In this work, we have systematically applied an alternate strategy; the isolation of drug hypersensitive Top2 alleles. We used mAMSA as a model intercalating Top2 poison, and isolated a series of mAMSA hypersensitive alleles. Two mutants conferring hypersensitivity specifically to mAMSA, and not other Top2 poisons, were selected for biochemical characterization. Both of the mutant enzymes exhibit elevated levels of mAMSA-induced DNA cleavage. The mutants localize near the catalytic center of the enzyme, but have distinct biochemical properties. The availability of an mAMSA-hypersensitive mutant near the Rossman fold has allowed us to specifically assess the role of single strand cleavage by topoisomerase II in cell killing by topoisomerase poisons.
EXPERIMENTAL PROCEDURES
Materials, Yeast Strains, and Plasmids—Etoposide was obtained from Bedford Laboratories™ (Bedford, OH) and etoposide (powder) was from Sigma-Aldrich. mAMSA (N-[4-(9-acridinylamino)-3-methoxyphenyl]methanesulfonanilide) was from Bristol-Myers Co., and CP-115,953 was a gift from Pfizer. Drug stock solutions were prepared in dimethyl sulfoxide at concentration 20 mg/ml and stored at -20 °C.
All experiments for assessing drug sensitivity were carried out in JN394at2-4 (MATα ura3-52 leu2 trp1 his7 ade1-2 ISE2 rad52::LEU2 top2-4) (17, 18). Yeast Top2p (wild-type and mutant enzymes) were purified using a top1 derivative of the protease-deficient strain JEL1t1 (trp1 leu2 ura3-52 pbr1-1122 pep4-3 his3::pGAL10GAL4 top1::LEU2). pDED1Top2, a single copy yeast plasmid was used for overexpression of TOP2 from the yeast DED1 promoter (18).
Random Mutagenesis of Plasmid DNA—Random mutagenesis of yeast topoisomerase II was done using PCR mutagenesis kit from Stratagene. To facilitate the mutagenesis of yeast TOP2 gene and transformation, we constructed plasmid pDED1TOP2 with a gap 5′-1133 bp and 3′-2965 bp by restriction enzymes SanDI and BseRI, respectively. Segment 1053–2888 bp of yeast Top2 gene on plasmid pDED1 was mutated using error prone PCR with mutazyme DNA polymerase that randomly introduces errors. PCR products were cloned in vector by homologous recombination, so they were constructed to overlap on 5′ and 3′ sides of gaped plasmid by ∼200 bp. The following oligonucleotides were used for PCR: as a forward primer: 5′-CTTTTGCGGTTTCTGATATCTCTTTTC-3′;as a reverse primer: 5′-ACCTCCCACTGTAACCTTTCGCTC-3′. A 2188-bp product size was generated by PCR.
The PCR conditions were selected to generate less than one nucleotide substitution per segment. 50 or 100 ng of target DNA was taken in reaction for producing low mutation frequencies. PCR was performed using mutazyme DNA polymerase and 30 cycles at 95 °C for 30 s, 54 °C for 30 s, and 72 °C for 2 min and 20 s. Yeast strain JN394at2-4 was transformed using the lithium acetate procedure with single-stranded carrier DNA (19) by mix of purified gapped plasmid and PCR products. Transformants were plated to synthetic complete medium lacking uracil.
Site-directed Mutagenesis of Plasmid DNA—Mutagenesis was carried out with QuikChange site-directed mutagenesis kit from Stratagene (La Jolla, CA) and as described previously (20). The plasmid pDED1TOP2 was used as the template in PCR reaction (18). The reaction mix (50 μl) contained 20 ng of template plasmid DNA, 125 ng of each primer, 10 nm dNTPs, 2.5 units of Pfu DNA polymerase, and 1× reaction buffer. PCR amplification was performed using 16 cycles at 95 °C for 30 s, 50 °C for 1 min, and 68 °C for 22 min. 10 units of DpnI endonuclease was used for elimination of parental plasmid for 2 h at 37 °C. 1 μl of the DpnI-treated PCR DNA was used for transformation of supercompetent cells XL-1 Blue from Stratagene. Plasmids were purified using GenElute Plasmid Miniprep Kit (Sigma), as described by the manufacturer's protocol. All mutations were verified by DNA sequencing.
Measurement of Drug Sensitivity in Yeast Cells—Drug sensitivity in yeast cells was carried out as described previously (18, 21). Briefly, cells were grown to midlog phase in liquid YPDA (yeast extract/peptone/dextrose/adenine) or synthetic complete dropout to 2 × 10⁶ cells/ml, and drug was added. Cells were incubated for 24 h, diluted, and plated to plates with synthetic media lacking uracil. Plates were incubated at 34 °C, and the numbers of cells giving rise to colonies were counted. Results were expressed relative to the number of viable colonies at the time of drug addition.
As a simple and reproducible metric for comparing the drug sensitivity of different Top2 alleles, we computed the minimum lethal concentration (mlc), which was determined by extrapolating cell survival versus drug concentration curves and determining the point that gives 100% survival (22).
Overexpression and Purification of Topoisomerase II from Yeast Cells—Yeast wild-type topoisomerase II and the mutant proteins were purified from protease-deficient strain JEL1t1. Yeast topoisomerase II was expressed for purification using the plasmid pGAL1TOP2 (23) and induction of Top2 by galactose as described previously (22, 24–26). Enzymes used were of >90% purity as assessed by SDS-PAGE, based on the 165-kDa band of intact yeast Top2.
Measurement of Topoisomerase II Enzymatic Activities—DNA topoisomerase II assays (decatenation and relaxation) were carried out as described previously (22). Briefly, the reaction mixture contained 10 mm Tris-HCl, pH-7.5, 50 mm NaCl, 50 mm KCl, 5.0 mm MgCl2, 2.5% glycerol, 0.5 mm ATP, 200 ng of pUC18 (for relaxation activity), or 200 ng of kinetoplast DNA (kDNA, TopoGen, Inc., Port Orange, FL) (for decatenation activity) and the indicated amount of purified TOP2 protein and drug of interest. Samples were subjected to electrophoresis in 1% agarose gel; bands were visualized by UV and quantified using the Quantity One imaging system (Bio-Rad). The rate of Top2-catalyzed ATP hydrolysis was measured using a coupled enzyme assay as described previously (27, 28).
Quantitation of DNA Cleavage—The K+/SDS assay was used to assess quantitative levels of DNA cleavage as performed previously (22, 29). Briefly, linearized plasmid pUC18 was end-labeled at its 3′-ends with the Klenow DNA polymerase using [α-32P]dATP. Unincorporated nucleotides were removed by ethanol precipitation.
The cleavage reaction was carried out in TOP2 buffer (described above) and in a total volume of 100 μl. The reaction was incubated for 30 min at 30 °C and then stopped with 1 ml of stop buffer (1.25% SDS, 5 mm EDTA, pH 8.0, 0.4 mg/ml salmon sperm DNA). Then 0.25 ml of 325 mm KCl was added, and the reaction was incubated 10 min at 65 °C. The reactions were placed on ice for 10 min and then centrifuged at 14,000 rpm for 10 min. The supernatant was removed, and the samples were resuspended in 1 ml of wash buffer (10 mm Tris-HCl, pH 8.0, 100 mm KCl, 1 mm EDTA, 1 mg/ml of salmon sperm DNA). Samples were incubated 10 min at 65 °C, then placed on ice for 10 min and centrifuged as above. The wash procedure was carried out three times. After the final wash, the samples were resuspended in 400 μl of water, and 100 μl of sample was taken for determining the counts.
To map of the sites of cleavage of TOP2, we used the DNA substrate labeled on only one end. DNA labeled according to the protocol described above was digested with BamH1 restriction enzyme and then was purified by ethanol precipitation. Cleavage reactions were performed as described above. After the reaction was stopped, the reaction mixture was treated by proteinase K for 1 h at 55 °C. Then the nucleic acids were ethanol-precipitated, and pellets were air-dried and resuspended either in agarose gel loading buffer (for neutral agarose gel) or in 2×TBE-Urea Sample Buffer (Novax) (for denatured gel). Then samples for neutral agarose gel were loaded on agarose gel, while samples for denatured gel were boiled for 5 min and run on 4% urea-acrylamide gel. The gels were dried before exposure and analyzed on a PhosphorImager (Molecular Dynamics).
Gel Cleavage Assay by Topoisomerase II—DNA cleavage using plasmid pUC18 DNA as a substrate was determined by the procedure described by Robinson and Osheroff (30, 31) with slight modifications. Cleavage assays were incubated in a total volume of 200 μl for 15 min at 30 °C and terminated with 50 μl of 10% SDS. Samples were digested with 400 μg of proteinase K at 50 °C for 2.5 h, phenol extracted, precipitated with ethanol, resuspended in TE(10mMT/Tris-HCL, pH 8.0, 1mM EDTA) buffer, and analyzed by 1% agarose gel, stained with ethidium bromide.
Topoisomerase II-mediated DNA Re-ligation—DNA re-ligation assay was carried out by a modification of the protocol of Osheroff (25, 32). Cleavage re-ligation equilibrium was established by incubating the complete reaction mixture at 30 °C for 15 min as described above for topoisomerase II-mediated DNA cleavage. Then re-ligation reaction was initiated by 0.5 m NaCl and was terminated by the addition of 1% SDS (final concentration) at different points of time (seconds). Then samples were prepared and analyzed as described above for DNA cleavage protocol. Rate of DNA re-ligation was determined by quantifying the loss of cleavage product.
RESULTS
Selection and Characterization of Mutants in Yeast Top2 Conferring Hypersensitivity to Intercalating Agents—We previously described mutations in yeast Top2 that result in hypersensitivity to different classes of Top2-targeting agents such as etoposide and mAMSA (22, 24, 33). In all cases, the drug hypersensitivity was identified fortuitously with mutants constructed for other purposes. We devised a genetic screen for TOP2 mutations conferring hypersensitivity to Top2-targeting agents and first applied it to the intercalating agent mAMSA. We chose to maximize intrinsic drug sensitivity in two ways: using repair-deficient yeast strains, and overexpression of Top2. Both strategies have been shown to increase the efficacy of topoisomerase II poisons (17, 18). Briefly, a plasmid-encoded copy of the yeast topoisomerase II gene under the control of the DED1 promoter was used for Top2 expression. Mutations were introduced in the segment of DNA coding for amino acids 351–963 (nucleotides 1053–2888 of the yeast Top2 open reading frame) by error-prone PCR. This mutagenized fragment was co-transformed with linearized pDED1Top2 lacking an internal SanDI/BseRI fragment. Because the gap repair by homologous recombination requires RAD52, the strain also included a plasmid carrying the RAD52 gene under the control of the GAL1 promoter. The co-transformation was carried out in cells grown on galactose (and cells were therefore phenotypically RAD52+). After transformation, the parental strain (JN394t2-4) contained a plasmid-based collection of mutated TOP2 genes. The initial transformants were plated at 34 °C, a temperature that is non-permissive for the top2–4 allele. Therefore, mutants unable to complement top2–4 were excluded from this collection. Individual colonies (∼4000) were picked and analyzed for sensitivity to mAMSA on plates containing 1 μg/ml mAMSA. Colonies failing to grow on this concentration of mAMSA were re-analyzed for sensitivity to mAMSA, and verified sensitive colonies were stocked for further analysis. Typically, plasmids from drug-hypersensitive clones were isolated and transformed into Escherichia coli cells. Plasmids were purified from E. coli and introduced into JN394t2-4 cells. Detailed characterization of drug sensitivity was carried out in the re-transformed cells, to verify that drug hypersensitivity was mediated by the plasmid carrying mutated TOP2. In isolates selected for further analysis, DNA sequence of the mutated plasmid was determined, and the mutation was re-introduced into the plasmid pDED1Top2 by oligonucleotide-directed mutagenesis. These re-isolated mutants were retested to verify that the identified amino acid change was sufficient to confer drug hypersensitivity. All mutant Top2 enzymes described here have phenotypic changes due to a single amino acid substitution.
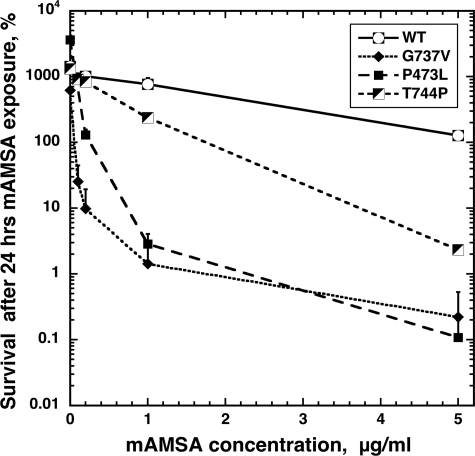
Fig. 1 illustrates the mAMSA sensitivity of two isolated mutants. The sensitivities conferred by mutations in TOP2 changing P473L or G737V were compared with either wild-type Top2 or cells carrying Top2(T744P). Top2(T744P) resulted in a mutated Top2 with hypersensitivity to both mAMSA and fluoroquinolones. At 5 μg/ml mAMSA, cells carrying wild-type TOP2 had limited sensitivity to the drug, with substantial growth inhibition after 24-h drug exposure. The hypersensitive T744P conferred greater sensitivity, with an mlc after 24-h drug exposure of 1.8 μg/ml mAMSA. Both P473L and G737V top2 alleles confer much greater mAMSA sensitivity than the T744P allele, with mlc values much less than 1 μg/ml mAMSA. This can be clearly seen because the survival after 24-h exposure to 1 μg/ml mAMSA was ∼1% for both alleles.
FIGURE 1.
G737V and P473L mutations of yeast TOP2 confer hypersensitivity to mAMSA. JN394t2-4 yeast cells carrying either pDED1TOP2 (G737V), pDED1TOP2 (P473L), pDED1TOP2 (T744P), or pDED1TOP2+ (WT) plasmid were exposed to mAMSA at 34 °C for the 24 h. Aliquots were removed, diluted, and plated to complete synthetic medium plates lacking uracil. Cell survival is expressed as the percentage of surviving cells at the time 24 h relative to the viable titer at the time drug was added (t = 0). Therefore, at the start of the experiment, the survival will be 100%, and in untreated cells the survival will be greater than 100%, reflecting cell growth over the 24-h incubation period. Error bars represent the standard deviation of three independent experiments, and in several cases, the error bars are smaller than the symbols denoting survival. The plasmid pDED1TOP2 (T744P) carries a previously described mutation that confers hypersensitivity to mAMSA (22).
The P473L and G737V alleles conferred the greatest mAMSA sensitivity of any of the mutants we recovered. We also recovered several other isolates carrying single point mutations conferring mAMSA hypersensitivity that was at least as great as the T744P allele (Table 1). The mutations localized to three different regions of the enzyme. Mutations in this second group with somewhat lower mAMSA hypersensitivity included one (A484P) in the B′-subfragment of Top2, three mutations (F711I, H735Q, and L787S) in the CAP homology domain, and one mutant (L1052I) that localized to the A′-A′ dimer interface.
TABLE 1.
Topoisomerase II mutants and mlc to drugs
| mAMSA | Etoposide | CP-115,953 | |
|---|---|---|---|
| μg/ml | |||
| Wild type | 6.0 | 9.0 | 1.1 |
| T744Pa | 1.8 | 10.5 | 0.2 |
| P473L | 0.25 | 25.0 | 0.7 |
| A484P | 2.1 | 2.0 | 0.3 |
| F711I | 3.0 | 2.1 | 0.8 |
| H735Q | 1.5 | 2.0 | 0.5 |
| G737V | 0.06 | 20.0 | >7 |
| L787S | 2.1 | 2.0 | NDb |
| L1052I | 2.3 | 2.5 | 0.5 |
Previously characterized mutation (22)
ND, not determined
Strains carrying the mAMSA-hypersensitive alleles described above were tested for sensitivity to other Top2-targeting agents. We were particularly interested in whether the mutants were hypersensitive to non-intercalating Top2-targeting agents, because non-intercalating agents may act by mechanisms that are partially distinct from intercalating agents. We used both etoposide and CP-115,953, a fluoroquinolone that is active against eukaryotic type II topoisomerases. The results summarized in Table 1 show that the two most sensitive mutants, P473L and G737V, had minor resistance to etoposide. The G737V allele was highly resistant to CP-115,953, whereas the P473L allele conferred essentially wild-type sensitivity to this agent. Importantly, these two alleles exhibited hypersensitivity that is specific for mAMSA and does not carry through to other classes of Top2-targeting poisons.
The mlc for mAMSA for strains carrying the other five alleles ranged from 1.5 to 3.0 μg/ml, ∼2- to 4-fold hypersensitivity. These alleles all conferred etoposide hypersensitivity (mlc range from 2.0 to 2.5 μg/ml, about a 4- to 5-fold decrease), and hypersensitivity to CP-115,953 of 0.8–2.2 μg/ml, with decreases of 1.5- to 4-fold. Although some minor drug-specific effects were observed, in general, all five alleles increased sensitivities to multiple classes of Top2-targeting drugs. Although it will be of interest to examine the biochemical alterations in the mutations that result in hypersensitivity to multiple classes of drugs, we decided to first concentrate on the two mutations conferring high specific sensitivity to mAMSA.
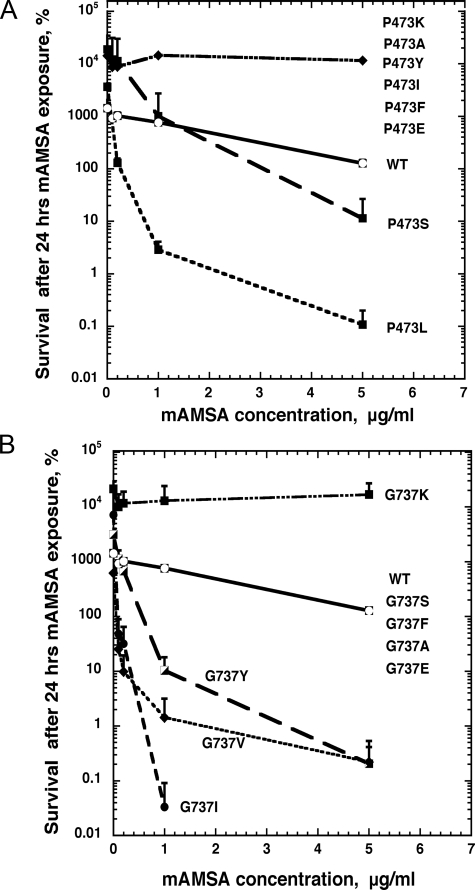
We examined other amino acid changes at positions 473 and 737 to assess what altered biochemical properties were required for drug hypersensitivity. We constructed a wide range of amino acid changes, including changes to hydrophobic amino acids (Ala, Ile, and Phe), polar, uncharged amino acids (Ser and Tyr), positively (Lys), and negatively charged amino acids (Glu). Fig. 2 shows the pattern of mAMSA sensitivity obtained for cells expressing the various substitutions. Fig. 2A shows that the effect of P473L was very specific. No other amino acid substitution tested conferred as great sensitivity to mAMSA as a change to Leu; only a change to Ser exhibited significant hypersensitivity (a 2-fold decrease in mlc), whereas most other amino acid changes resulted in mAMSA resistance. These results indicate that Leu at 473, rather than a loss of Gly, is primarily responsible for mAMSA hypersensitivity. By contrast, several changes at position 737 resulted in a Top2 gene-conferring hypersensitivity. In general, substitution of any hydrophobic amino acid (except Phe) for Gly resulted in mAMSA hypersensitivity (Fig. 2B). Notably, changing Gly to Ile resulted in a Top2 gene conferring even greater mAMSA sensitivity than the G737V allele. Overall, these results suggest that the change to a hydrophobic residue, rather than loss of the Gly, is mainly responsible for mAMSA sensitivity. We noted that few amino acid changes at position 737 result in mAMSA resistance (a change of Gly to Lys), whereas many substitutions at amino acid 473 reduced drug sensitivity. This may reflect that a very specific structural change is required around amino acid 473, suggesting that this change may be near a site of enzyme-drug interactions. Other aspects of how the amino acid changes at positions 473 and 737 may alter Top2p structure are discussed below.
FIGURE 2.
Amino acid substitutions at Pro473 and Gly737 that alter yeast TOP2 sensitivity to mAMSA. JN394t2-4 yeast cells carrying pDED1TOP2 plasmid with different Pro473 and Gly737 mutations on TOP2 protein were exposed to different concentrations of mAMSA at 34 °C for the 24 h. Cell survival is expressed as the percentage of surviving cells at the time 24 h relative to the viable titer at the time drug was added (t = 0). A, sensitivity of Pro473 mutants to mAMSA. As indicated in the figure, only the P473L mutant had high levels of mAMSA sensitivity. Some increased sensitivity of the P473S mutant was also observed, whereas all other amino acid changes resulted in mAMSA resistance. B, sensitivity of Gly737 mutants to mAMSA. The substitution mutant G737I exhibited greater mAMSA sensitivity than G737V, and G737Y. Most other changes tested did not alter mAMSA sensitivity except G737K, which was strongly mAMSA-resistant. Error bars indicate the standard deviation of three independent experiments. WT denotes pDED1TOP2 with the wild-type TOP2 sequence.
Biochemical Characterization of mAMSA-hypersensitive Proteins—We decided to confine our initial biochemical analysis to the mutants that conferred specific hypersensitivity to mAMSA. We selected Top2(P473L) and Top2(G737V) to test whether the mutant proteins were drug-hypersensitive in vitro, and if so, to examine the biochemical properties associated with mAMSA hypersensitivity. To examine the biochemical properties of the mutant proteins, we introduced the mutations into the plasmid pGALTop2 and overexpressed the proteins in yeast strain JELt1-. Proteins were purified to near homogeneity. Purified mutant proteins were first assayed for strand passage activity using both relaxation of negatively supercoiled plasmid DNA and decatenation of kDNA networks.
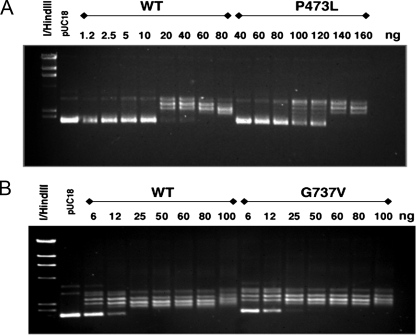
Fig. 3 shows results obtained for relaxation of negatively supercoiled DNA with Top2(P473L) or Top2(G737V) compared with wild-type Top2p. Using our standard conditions, complete relaxation of negatively supercoiled pUC18 DNA requires ∼20 ng of purified protein. Top2(P473L) is significantly less active than the wild-type protein, requiring ∼140 ng of purified protein. By contrast, Top2(G737V) shows similar relaxation activity as wild-type Top2. Similar results were seen when kDNA was used as a substrate for decatenation, i.e. Top2(P473L) was ∼7- to 10-fold less active than wild-type Top2, whereas Top2(G737V) and wild-type proteins showed similar levels of specific activity (data not shown).
FIGURE 3.
Catalytic activity of G737V and P473L TOP2 proteins. The catalytic activity of wild-type, G737V, and P473L proteins were compared using ATP-dependent relaxation of 200 ng of pUC18. The amount of added Top2p (in nanograms) is indicated above each lane. The lane labeled pUC18 is plasmid DNA treated in the absence of Top2p. All assays were carried out at least three times, and the results shown are representative of all assays that were performed. A, relaxation activity of P473L compared with wild-type Top2. Complete relaxation of pUC18 was seen at 20 ng of wild-type protein, and 140 ng of P473L protein. B, relaxation activity of G737V protein. Complete relaxation was seen for both wild-type and G737V proteins at 25 ng of added protein.
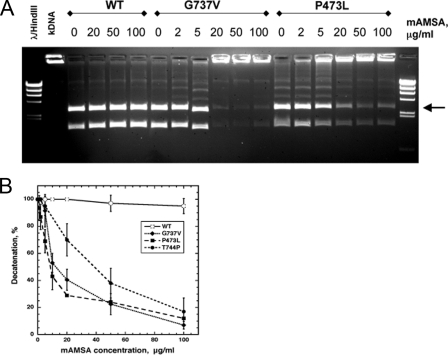
Previous experiments assessing the effects of Top2-targeting drugs on yeast Top2 have demonstrated a robust induction of drug-stabilized DNA cleavage. However, it has been more difficult to demonstrate inhibition of enzyme activity using assays such as relaxation of negatively supercoiled DNA or decatenation of kinetoplast DNA. Because both the Top2(P473L) and Top2(G737V) exhibited elevated sensitivity in vivo, we decided to examine inhibition of enzyme activity using the mutant enzymes. Because it can be more difficult to discern inhibition of relaxation of negatively supercoiled DNA with intercalating agents, we used decatenation of kinetoplast DNA to assess the inhibitory potency of mAMSA with the mutant enzymes (Fig. 4). Panel A shows a decatenation reaction carried out with a fixed enzyme concentration, and increasing concentration of mAMSA, and panel B shows a quantitation of the decatenation reaction. No inhibition of decatenation is seen with wild-type Top2 even at mAMSA concentrations of 100 μg/ml. By contrast, inhibition of decatenation is seen with both Top2(G737V) and Top2(P473L), with an IC50 of ∼10 μg/ml mAMSA for both mutants. Because we previously reported that Top2(T744P) is mAMSA-hypersensitive, but had not assessed sensitivity using a decatenation assay, we also examined inhibition by mAMSA for this enzyme (quantitation is shown in panel B, but an example of decatenation by Top2(T744P) is not shown). The IC50 for mAMSA with Top2(T744P) is ∼50 μg/ml. These results show that the mAMSA hypersensitivity can be demonstrated using a simple enzyme assay, and that both Top2(G737V) and Top2(P473L) exhibit 5-fold greater sensitivity to mAMSA than the previously described T744P allele.
FIGURE 4.
Inhibition of decatenation activity of wild-type and mutant Top2 derivatives by mAMSA. The decatenation activity of WT, P473L, and G737V Top2 were assayed by incubating 200 ng of kinetoplast DNA with 1 unit of Top2 activity in the presence of mAMSA. One unit is 20 ng of WT Top2, 20 ng of G737V Top2, or 140 ng of P473LTop2 kDNA decatenation. A, image of ethidium bromide-stained agarose gel of decatenation reaction of WT, G737V, and P473L TOP2 in the presence of increased concentrations of mAMSA. B, quantitation of a series of experiments as shown in A. The data were quantified as a percentage of 100% decatenation (no drug) and are plotted against mAMSA concentration. Because the decatenation leads to the generation of multiple bands, only the band indicated with an arrow was used for quantitation. Error bars represent the standard deviation of three independent experiments.
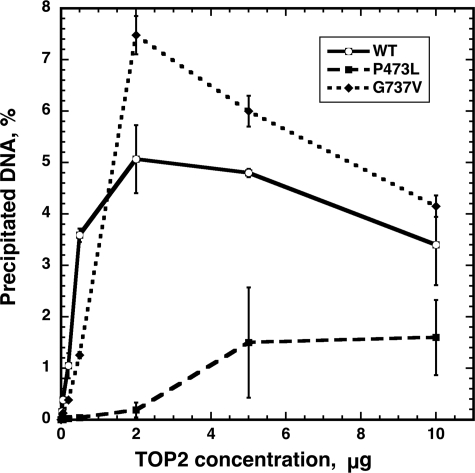
We next examined the intrinsic DNA cleavage activity of the mutant enzymes. To assess cleavage quantitatively, we used the K+/SDS precipitation assay. In this assay, linear, radioactively labeled DNA is treated with Top2p, and the reaction is terminated by the addition of a protein denaturant. This assay does not measure the rate of cleavage, but measures the quasi-steady-state level of Top2 covalently bound to DNA. Because the assay measures protein-DNA covalent complexes, it does not distinguish between single and double strand DNA cleavage. Fig. 5 shows the level of covalent complexes formed with wild-type Top2, compared with both mutant proteins. Both wild-type and Top2(G737V) proteins showed increased DNA cleavage as Top2p concentration increased, up to ∼2 μg of added protein. The level of precipitated DNA was ∼2-fold greater with Top2(G737V) compared with wild-type Top2p, a difference that is probably not significant. Again, Top2(P473L) had significantly reduced activity compared with the wild-type protein. With 2 μg of added Top2(P473L) protein, the level of Top2-DNA complexes was only slightly above background. With 5 μg of Top2(P473L) protein, covalent complexes were at least 3-fold lower than with wild-type Top2 protein. These results indicate that Top2(P473L) has a significant reduction in DNA cleavage activity, whereas the cleavage activity of Top2(G737V) protein is similar to wild-type.
FIGURE 5.
Drug-independent covalent complex formation by wild-type and mutant Top2 derivatives. The K+/SDS assay was used to assess quantitative levels of DNA cleavage in the absence of Top2 poisons. Cleavage reactions contained α-32P-end-labeled pUC18 and the indicated concentrations of Top2 protein. Reactions were terminated with SDS, and protein-DNA complexes were precipitated by the addition of KCl. After washing, the levels of radioactive DNA co-precipitating with proteins were determined by scintillation counting. The percentage of α-32P-labeled DNA recovered in the pellet is shown for different enzyme concentrations. Error bars represent the standard deviation of three independent experiments.
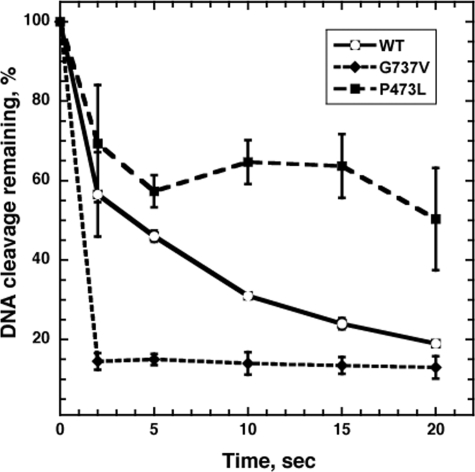
We were interested in determining whether the reduction of DNA cleavage in Top2(P473L) was also accompanied by a reduction in the ability of the enzymes to re-ligate cleaved DNA. To examine this question, we used a re-ligation assay developed by Osheroff and co-workers that depends on the ability of Top2 to re-ligate cleaved DNA at a high salt concentration that blocks further DNA cleavage. After establishment of a steady-state level of DNA cleavage, using an end-labeled linear DNA fragment as substrate, the salt concentration is adjusted to 0.5 m NaCl. DNA re-ligation is terminated by the addition of SDS, and as in the previous experiment, remaining protein-DNA complexes were precipitated by the addition of KCl and quantitated by scintillation counting. The results are shown in Fig. 6. For easy comparison, the level of DNA cleavage at the time of salt addition was set to 100%. For wild-type Top2p, enzyme-DNA covalent complexes were rapidly lost, with a 50% reduction in protein-DNA complexes in ∼3s. The Top2(G737V) protein showed an even greater rate of re-ligation, with 50% of the covalent complexes eliminated in <2s (the shortest time that can be reproducibly used for this assay). By contrast, the rate of re-ligation seen with Top2(P473L) is substantially lower than the wild-type protein. <50% of the covalent complexes were lost in the first 5 s, and the level of DNA cleavage did not reach 50% of the initial level after 20 s. Although the results suggest that there is a population of DNA molecules that are re-ligated very slowly, the assay becomes rather undependable at longer incubation times. Nonetheless, the results clearly indicate that, although the Top2(G737V) protein is fully competent at DNA re-ligation, the Top2(P473L) shows a significant re-ligation defect even in the absence of drug.
FIGURE 6.
Drug-independent DNA re-ligation mediated by wild-type TOP2 or mutant TOP2. DNA re-ligation assays were carried out as described under “Experimental Procedures.” Assays contained 3 μg of purified Top2 protein. After incubating a standard Top2 reaction mixture for 15 min, further DNA cleavage was inhibited by addition of NaCl to a final concentration of 0.5 m. Re-ligation reactions were terminated by the addition of SDS (1% final concentration) at the time points indicated (in seconds). The levels of cleavage at the time of NaCl addition were set to 100%. Data are the averages (± S.D.) of three independent experiments.
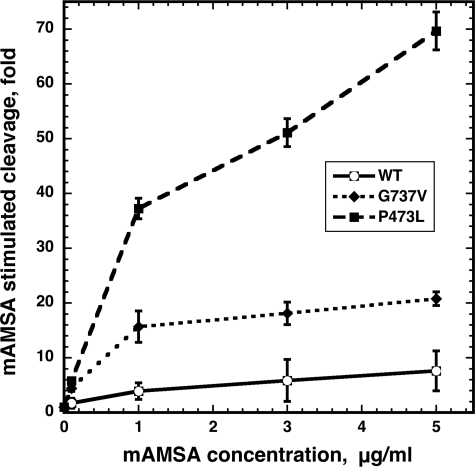
A change in intrinsic DNA cleavage has not been previously observed in the drug-hypersensitive alleles we examined (22, 24, 25, 33). A reduction in DNA cleavage is surprising, because it would be expected that drug hypersensitivity would be associated with greater levels of DNA cleavage. On the other hand, a defect in re-ligation, especially in the presence of an enzyme inhibitor, would be consistent with conferring drug hypersensitivity. The drug-induced level of DNA cleavage, rather than intrinsic (drug-independent) cleavage is the most important predictor of drug sensitivity; therefore, we next examined levels of DNA cleavage in vitro in the presence of mAMSA. Measurement of drug-stabilized cleavage was carried out using the K+/SDS assay, the same assay described above to measure drug-independent cleavage. We examined covalent complex formation in the presence of various concentrations of mAMSA and expressed drug-induced cleavage relative to cleavage in the absence of drug. Fig. 7 shows the DNA cleavage obtained at relatively low concentrations of mAMSA (from 0.1 to 5 μg/ml). Enhanced cleavage with both mutant proteins was clearly seen at this range of mAMSA concentrations. The drug concentrations required for increasing DNA cleavage by a factor of two were ∼0.02 μg/ml and 0.025 μg/ml for Top2(P473L) and Top2(G737V), respectively, versus slightly greater than 0.1 μg/ml with wild-type topoisomerase II. Because Top2(G737V) has levels of drug-independent cleavage similar to wild type, the result shown in Fig. 7 demonstrates that this protein likely generates higher levels of protein-DNA complexes in vivo, consistent with the high levels of mAMSA sensitivity seen with this mutant. Although Top2(P473L) also shows much higher levels of cleavage compared with drug-independent levels, the cleavage effected by Top2(P473L) is likely to be less than the effect of Top2(G737V), due to the overall defect in drug-independent cleavage. Using the data in Fig. 5, we estimated that drug-independent cleavage in Top2(P473L) was reduced ∼2.5- to 4.0-fold. Based on this estimate, the results shown in Fig. 7 predict that mAMSA-dependent cleavage in cells expressing Top2(P473L) will be substantially greater than in cells expressing wild-type Top2. For example, at an in vitro concentration of 1 μg/ml the overall cleavage would be ∼10-fold above drug-independent levels (37× increase in drug-stimulated cleavage/3-fold reduction in drug-independent cleavage yielding a 12-fold stimulation in the level of Top2 covalent complexes, compared with 4-fold drug stimulation for the wild-type enzyme). Because the Top2(G737V) mutant confers only slightly greater levels of drug sensitivity than Top2(P473L), but very similar levels of cytotoxicity, we suspected that levels of DNA cleavage were insufficient to explain the drug hypersensitivity of this allele.
FIGURE 7.
Covalent complex formation by wild-type and mutant Top2 proteins in the presence of mAMSA. The K+/SDS assay was used to assess quantitative levels of DNA cleavage. Cleavage reactions contained 200 ng of TOP2 protein, α-32P-end-labeled pUC18, and the indicated concentrations of mAMSA. Reactions were terminated with SDS, and proteins were precipitated with KCl. After washing, the levels of radioactive DNA co-precipitating with proteins were determined by scintillation counting. In these assays drug-induced cleavage was expressed relative to DNA cleavage in the absence of drug. Error bars represent the standard deviation of three independent experiments. WT, wild-type.
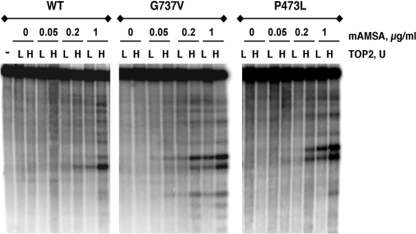
We next examined the specific double strand cleavage by carrying out cleavage assays where the cleavage products are displayed following gel electrophoresis. For these experiments, the cleavage substrate was a specifically 3′-end-labeled DNA. Following cleavage reactions and protease digestion, the cleavage products were separated by gel electrophoresis. Fig. 8 shows the pattern of double-stranded cleavage for wild-type Top2 compared with Top2(G737V) and Top2(P473L). Under the conditions used here, little drug-independent cleavage was observed. Top2(G737V) clearly shows elevated cleavage compared with the wild-type (see especially the lanes with samples from reactions containing 0.2 μg/ml mAMSA). Elevated cleavage was also observed with Top2(P473L); however, this experiment overstates the level of double-stranded DNA cleavage expected in vivo, because a fixed number of units of enzyme was used in this experiment. A comparison of low concentrations of wild-type protein with high concentrations of Top2(P473L) suggests approximately similar levels of double strand cleavage (on a per protein basis). A detailed quantitative comparison of the levels of cleavage is difficult with this type of experiment, especially, as here, when the DNA cleavage patterns differ between the proteins.
FIGURE 8.
Double strand DNA cleavage by mAMSA-hypersensitive Top2 proteins. Cleavage of linear end-labeled pUC18 DNA was carried out as in the experiment shown in Fig. 7. Samples were treated with proteinase K followed by electrophoresis using 1.5% agarose gels. After electrophoresis, gels were dried and exposed for autoradiography. mAMSA concentrations are indicated in the figure. For each drug concentration, samples with two different amounts of added Top2 protein are shown. Samples marked “L” had 10 units of Top2 added, samples marked “H” had 25 units of Top2 added. For wild-type Top2 and Top2(G737V), 1 unit is 20 ng of protein; for Top2(P473L) 1 unit is 140 ng of protein.
It is interesting to note that there are significant differences between the cleavage patterns of the wild-type and mutant proteins. It is also of interest that, by a qualitative comparison, the cleavage patterns of the two mutant proteins appear very similar and have substantial differences when compared with the wild-type protein. This result suggests that there may be important similarities in the mechanism leading to mAMSA hypersensitivity.
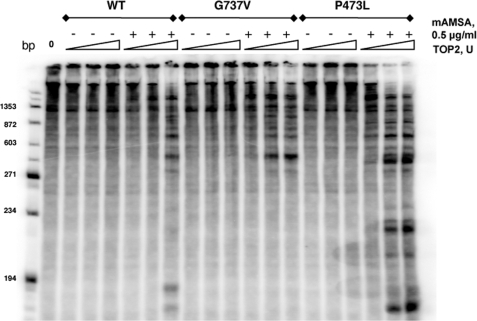
Because the K+/SDS assay detects both single- and double-stranded DNA cleavage products, whereas the levels of double-stranded cleavage with Top2(P473L) appeared insufficient to explain high levels of drug hypersensitivity, we were interested in examining patterns of single strand cleavage with the mutant proteins. Cleavage reactions were carried out as in Fig. 8, but the cleavage products were separated under denaturing conditions. The results of this analysis are shown in Fig. 9. As in Fig. 8, little drug-independent cleavage was observed under these conditions. At 0.5 μg/ml mAMSA, single strand cleavage products were seen with 50 units (1 μg) of wild-type Top2. By contrast, single strand cleavage products were also seen with Top2(G737V) at lower protein concentrations. Note that the cleavage products observed here are the sum of both single and double strand cleavage, so elevated cleavage with this mutant would be expected. A different result was seen with Top2(P473L). Here, much greater levels of single strand DNA cleavage were observed (compare the result obtained with the lowest concentration of Top2(P473L) with the highest concentration of wild-type Top2. Taken together, these results indicate that both mutant proteins show elevated DNA cleavage in vitro, with Top2(P473L) showing a greater effect on single strand than double strand cleavage.
FIGURE 9.
Single strand DNA cleavage by mAMSA-hypersensitive Top2 proteins. Cleavage of linear end-labeled pUC18 DNA was carried out as in the experiment shown in Fig. 8, with samples analyzed using denaturating polyacrylamide gels. After electrophoresis, gels were dried and exposed for autoradiography. Samples were treated with 10, 25, or 50 units of protein. Samples marker “-” lack mAMSA, and samples marked “+” contain 0.5 μg/ml mAMSA.
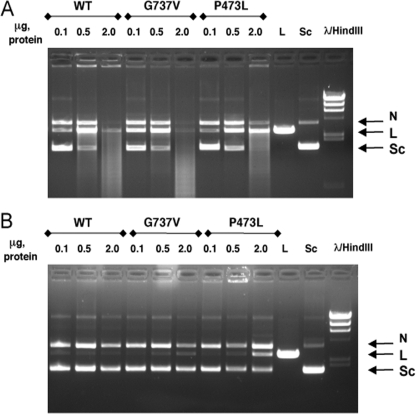
P473L Mutants Show Enhanced Drug-dependent DNA Cleavage in the Absence of ATP—We were also interested in examining whether we could identify other biochemical characteristics of DNA cleavage that differed between wild-type and the two mutant proteins. It is well established that levels of DNA cleavage are greater stimulated by ATP, even though drug-dependent cleavage can be stimulated even in the absence of ATP. We examined the levels of cleavage that occur in the absence of ATP for wild-type and the two mutant proteins. For this experiment, we used a simpler assay, where the substrate of DNA cleavage is a supercoiled plasmid, and (double-stranded) cleavage is detected by the appearance of linearized plasmid DNA (34). Fig. 10 shows the result of ATP-independent cleavage, compared with cleavage in the presence of ATP. Panel A shows DNA cleavage using this assay in the presence of ATP. A linear DNA product (indicated by the arrow) is seen when low concentrations of protein are added. At higher protein concentrations (especially 2 μg) a reduction in the linear band was observed with a smeared pattern, likely indicating multiple cleavage of the same DNA molecule. As also seen in Panel A, the loss of linear DNA in Top2(P473L) was reduced compared with both wild-type and Top2(G737V), consistent with the conclusion obtained from the experiment shown in Fig. 8. Panel B shows DNA cleavage obtained in the absence of ATP for all three proteins. Top2(G737V) shows a faint linear band that is most clearly seen with 2 μg of protein, whereas no linear band was seen with 2 μg of wild-type protein. By contrast, a linear band was clearly seen with 0.5 μg of Top2(P473L) and a much more prominent linear band was seen with 2 μg of protein. This result clearly indicates that Top2(P473L) exhibits elevated ATP-independent DNA cleavage. This result is not due to differences in ATPase levels, because all three proteins showed similar DNA-dependent and DNA-independent ATPase (differences of less than a factor of 2, data not shown). It should also be noted that ATP still stimulated DNA cleavage with Top2(P473L) (compare A and B). Although this result might suggest that ATP-independent cleavage might play a role in the drug hypersensitivity seen in vivo, we consider that very unlikely. First, intracellular ATP concentrations were sufficiently high that ATP-independent cleavage in vivo probably was not a significant component of overall Top2 DNA cleavage. Second, we also examined whether etoposide leads to elevated ATP-independent cleavage. We found that there was also greatly elevated ATP-independent cleavage in the presence of etoposide (data not shown). Because the P473L mutant strain did not show substantial etoposide hypersensitivity in vivo, it is unlikely that the ATP-independent cleavage was directly responsible for drug hypersensitivity. Instead, this effect indicates an intrinsic property of the protein that may be useful for understanding the coupling of ATP with DNA cleavage. This point is elaborated on under “Discussion.”
FIGURE 10.
P473L protein forms elevated levels of ATP-independent cleavage complexes in the presence of mAMSA. ATP-dependent (A) and ATP-independent (B) cleavage complex formation was assessed using a gel cleavage assay in the presence of 5 μg/ml mAMSA. The amount of added protein is indicated in micrograms above each lane. The lane labeled Sc contains supercoiled pUC18, and the lane labeled L contains pUC18 DNA linearized by EcoRI. WT, wild-type. The mobilities of nicked (N), linear (L), and supercoiled (Sc) are indicated to the right of each gel. Note that in this experiment, unlike those shown in Figs. 8 and 9, the same mass of each enzyme was added, as indicated.
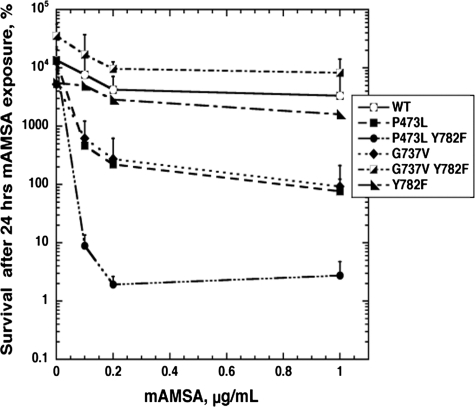
Stimulation of Single Strand DNA Cleavage by Top2-targeting Drugs Enhances Cytotoxicity—Our observation that Top2(P473L) generated high levels of drug-dependent cleavage, along with the location of the mutant protein, allowed us to carry out an experiment to specifically assess the importance of single-stranded DNA cleavage in cell killing. As described in the introduction, there is a collaboration between the two subunits to effect DNA cleavage. All of the previous drug-hypersensitive mutants we described likely collaborate in cis with the active site tyrosine during DNA cleavage. Pro473 is in a domain of Top2 that acts in trans with the tyrosine of the other protomer for cleavage. We reasoned that a P473L/Y782F double mutant could form a heterodimer with wild-type Top2, leading to a protein that could only carry out single strand cleavage. By contrast, a G737V/Y782F double mutant would behave essentially like wild-type, because G737V likely acts in cis. We constructed the relevant double mutants in pDED1Top2, as well as the Y782F single mutant. We were concerned that Y782F expressed from pDED1Top2 might act like a strong dominant negative and kill cells even in the absence of drug; however, transformants were obtained with all three constructs. (We note that the transformation efficiency with the Y782F single mutant was poor compared with both double mutants. The reason for the differential behavior of the pDED1Top2(Y782F) compared with the two double mutants is unclear.) Fig. 11 shows the result of a clonogenic survival assay carried out with the pDED1Top2 constructs. Note that the experiment shown in this figure uses a very low range of mAMSA concentration. As expected, both the pDED1Top2(G737V) and pDED1Top2(P473L) confer dominant sensitivity to mAMSA. Unlike the experiment shown in Fig. 1, the parental strain carries a wild-type TOP2 allele. Cells bearing pDED1Top2(Y782F) have about the same low sensitivity to low concentration of mAMSA as cells with wild-type Top2. Similarly, cells carrying pDED1Top2(G737V Y782F) also lack mAMSA sensitivity. However, cells carrying pDED1Top2(P473L Y782F) are quite sensitive to mAMSA. Because pDED1Top2(Y782F) does not exert an effect on mAMSA sensitivity, we feel that a homodimeric protein with an active site tyrosine mutant does not affect drug sensitivity. Because the Top2 heterodimer consisting of P473L/Y782F in one subunit and fully wild-type in the other subunit can only generate single strand cleavage, this result indicates that single strand cleavage is sufficient to lead to cytotoxicity.
FIGURE 11.
mAMSA sensitivity conferred by single strand DNA cleavage. JN394 (rad52- and TOP2+) yeast cells carried pDED1Top2 with genotypes as indicated on the figure. WT, pDED1Top2 with no mutations; the others were pDED1Top2 with the indicated amino acid changes. As in the experiment shown in Fig. 1, aliquots were removed after 24-h drug exposure, and samples were then diluted and plated to complete synthetic medium plates lacking uracil. Cell survival is expressed as the percentage of surviving cells at the time 24 h relative to the viable titer at the time drug was added (t = 0). Error bars represent the standard deviation of three independent experiments. Note that the mAMSA concentrations shown here are much less than shown in Fig. 1.
DISCUSSION
Drug-hypersensitive mutants of topoisomerase II have been very useful reagents for understanding aspects of drug action on the enzyme (22, 33, 35, 36). Hypersensitive alleles have also been invaluable for studying the genetic control of sensitivity to Top2 drugs in model organisms (37–39). Because previous hypersensitive alleles had been identified by constructing mutants to test other hypotheses relating to Top2 function, we were interested in the range of mutants that could be identified with an unbiased screen. In this report, we identified mutants conferring much greater levels of drug hypersensitivity, and importantly, alleles specific for intercalating Top2 poisons.
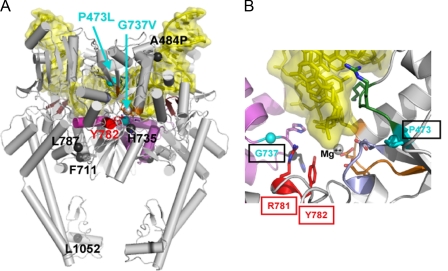
Interpretation of the drug-hypersensitive mutants has been enriched by several of the structures of the yeast Top2 breakage reunion domain, especially the recent structure of this domain bound to a nicked DNA (8). The localization of the mutants described here on Top2:DNA structure is shown in Fig. 12. Panel A shows the localization of all the mutants described here. With the exception of L1052I, all of the mutations are in amino acids relatively close to the bound DNA. Of the mutations that we have not characterized in biochemical detail in this work, L1052I is certainly the most intriguing, because it is unclear how affecting the C-terminal dimerization domain could affect drug sensitivity. The two-gate model for Top2 catalysis requires dissociation of the C-terminal dimerization domain and the structure determined by Berger and colleagues illustrated in panel A shows the C-terminal gate as partially open. The dynamics of the opening of the C-terminal gate, and the kinetics of passage of a DNA helix through the opened C-terminal gate remain poorly understood. Biochemical analysis of Top2(L1052I) will likely be useful in understanding this process. This domain may also represent a target for new classes of Top2 inhibitors.
FIGURE 12.
Localization of amino acids changed in mAMSA-hypersensitive mutants. Structures shown are representations of the structure solved by Dong and Berger of the breakage-reunion domain of yeast Top2 bound to a nicked double-stranded DNA. A shows the entire breakage reunion domain from a side view. Only one of two subunits has the relevant amino acids marked. The two mutants hypersensitive to mAMSA alone (P473L and G737V) are marked in cyan; other changed residues are marked in black. The active site tyrosine (Tyr782) is indicated in red. B is a closer view of the catalytic core, including the active site tyrosine, Arg781 (critical for catalysis), Pro473, and Gly737. Other relevant structural features include the amino acid sequence PLRGK (amino acids 473–477 of yeast Top2, shown in green) EGDSA (amino acids 449–453 of yeast Top2, shown in periwinkle), and the a4 helix (shown in lavender). This helix carries several amino acids changed in other mutants conferring hypersensitivity, including Ser740 and Thr744). DNA in both illustrations is shown in yellow. It should be emphasized that the DNA shown in the illustrations are protein DNA co-crystals as solved by Dong and Berger. Mg++ indicates an electron density that is likely a Mg2+ ion.
Fig. 12B shows the position of Pro473 and Gly737. Both mutants are clearly close to the catalytic center. The insertion of a Leu residue clearly should affect the conformation of the PLRGK domain. Because it is close to Arg475, this conserved domain has been previously implicated in mAMSA sensitivity (40, 41). Gly737 is also in close proximity to the active site tyrosine, and changing the Gly residue to a large hydrophobic amino acid will alter the geometry of residues acting in collaboration with the catalytic tyrosine. Based on results from Freudenreich and Kreuzer (42, 43), it is likely that mAMSA localizes directly at the site of DNA cleavage. If drug stably binds at this site, then active site tyrosine is likely to be substantially displaced, preventing re-ligation. The mutations may serve to displace the tyrosine further from the DNA or from the Rossman fold amino acids, inhibiting re-ligation further. From this point of view, the drug-hypersensitive mutants synergize with the presence of drug to inhibit DNA re-ligation. Because the Top2 protein may stabilize interactions between drug and DNA, it is possible that the effect of the mutations may be to add new protein-DNA interactions. We are especially intrigued by this possibility, because it may offer the possibility to rationally design new and more potent Top2-targeting agents. At present however, we have no direct evidence concerning protein-drug interactions for the hypersensitive mutants.
Although Top2(P473L) and Top2(G737V) have different biochemical effects, we think they likely effect mAMSA sensitivity in the same way. As one test of this, we constructed P473L/G737V double mutants in pDED1Top2 to determine whether they conferred additive mAMSA sensitivity. The double mutant shows very poor growth and high levels of mAMSA resistance.3 Therefore, we think that the two mutations when combined severely cripple the Top2 protein activity, and together they change the catalytic center that greatly reduces its ability to cleave DNA.
An interesting aspect of Top2(P473L) is the high level of ATP-independent cleavage seen in the presence of Top2-targeting drugs. Although this effect has been previously seen to a lesser extent (44), the magnitude of the effect is striking. Because Top2(P473L) is defective in DNA ligation, some of the ATP-independent effect may be due to very long lived complexes. Because the conformational changes leading to ATP-dependent DNA cleavage remain poorly understood, mutants such as P473L may be particularly useful in understanding this process. Given the proximity of Pro473 to DNA and the active site tyrosine, Pro473 may be part of the final effector in a cascade initiated by DNA binding.
It has been appreciated for some time that cells treated with Top2-targeting drugs accumulate both single and double strand breaks, and the relative abundance of single versus double strand breaks is a drug-specific property. Top2 is clearly competent for carrying out both single and double strand DNA cleavage (45). Pommier and colleagues (46) showed that mAMSA induces primarily DNA single strand breaks in mammalian cells. Although most single strand breaks disappear rapidly following drug removal, some proportion may also be lost by conversion to double strand breaks. More importantly, covalent complexes with only a single strand break are likely to interfere with cellular processes as efficiently as complexes with double strand breaks, although this hypothesis requires further examination. Our results suggest that single strand breaks induced by Top2-targeting drugs may be an additional property that may be examined as part of the evaluation of novel Top2-targeting agents.
In conclusion, we have described the isolation of a collection of mAMSA-hypersensitive alleles of yeast Top2. These alleles include two that are specific for mAMSA hypersensitivity, with both mutated amino acids occurring near the active site tyrosine when Top2 is bound to DNA and moving toward a cleavage competent state. Top2 proteins bearing drug-hypersensitive mutants have unique properties that will help illuminate the details of both the Top2 enzymatic cycle, and the mechanisms of drug action.
Acknowledgments
We thank Dr. Karim Bahmed for assistance with some of the drug sensitivity measurements. We also thank Dr. James Berger, University of California Berkeley, for providing Fig. 12 in a draft version.
This work was supported, in whole or in part, by National Institutes of Health Grants CA21765, CA52814, and CA82313 from NCI. This work was also supported by American Lebanese Syrian Associated Charities. The costs of publication of this article were defrayed in part by the payment of page charges. This article must therefore be hereby marked “advertisement” in accordance with 18 U.S.C. Section 1734 solely to indicate this fact.
Footnotes
The abbreviations used are: Top2, topoisomerase II; mAMSA, N-[4-(9-acridinylamino)-3-methoxyphenyl]methanesulfonanilide; WT, wild-type; mlc, minimum lethal concentration; kDNA, kinetoplast DNA.
A. T. Rogojina and J. L. Nitiss, unpublished results.
References
- 1.Nitiss, J. L. (1998) Biochim. Biophys. Acta 1400 63-81 [DOI] [PubMed] [Google Scholar]
- 2.Wang, J. C. (2002) Nat. Rev. Mol. Cell. Biol. 3 430-440 [DOI] [PubMed] [Google Scholar]
- 3.Kingma, P. S., and Osheroff, N. (1998) Biochim. Biophys. Acta 1400 223-232 [DOI] [PubMed] [Google Scholar]
- 4.Nitiss, J. L. (1998) in DNA Damage and repair, Vol. 2; DNA Repair in Higher Eukaryotes (Nickoloff, J. A., and Hoekstra, M. F., eds) pp. 517-537, Humana Press, Totowa, NJ
- 5.Wang, J. C. (1998) Q. Rev. Biophys. 31 107-144 [DOI] [PubMed] [Google Scholar]
- 6.Liu, Q., and Wang, J. C. (1998) J. Biol. Chem. 273 20252-20260 [DOI] [PubMed] [Google Scholar]
- 7.Liu, Q., and Wang, J. C. (1999) Proc. Natl. Acad. Sci. U. S. A. 96 881-886 [DOI] [PMC free article] [PubMed] [Google Scholar]
- 8.Dong, K. C., and Berger, J. M. (2007) Nature 450 1201-1205 [DOI] [PubMed] [Google Scholar]
- 9.Anderson, V. E., and Osheroff, N. (2001) Curr. Pharm. Des. 7 337-353 [DOI] [PubMed] [Google Scholar]
- 10.Li, T. K., and Liu, L. F. (2001) Annu. Rev. Pharmacol. Toxicol. 41 53-77 [DOI] [PubMed] [Google Scholar]
- 11.Nitiss, J. L. (2002) Curr. Opin. Investig. Drugs 3 1512-1516 [PubMed] [Google Scholar]
- 12.Nitiss, J. L., and Beck, W. T. (1996) Eur. J. Cancer 32A 958-966 [DOI] [PubMed] [Google Scholar]
- 13.Walker, J. V., and Nitiss, J. L. (2002) Cancer Invest. 20 570-589 [DOI] [PubMed] [Google Scholar]
- 14.Zwelling, L. A., Hinds, M., Chan, D., Mayes, J., Sie, K. L., Parker, E., Silberman, L., Radcliffe, A., Beran, M., and Blick, M. (1989) J. Biol. Chem. 264 16411-16420 [PubMed] [Google Scholar]
- 15.Bugg, B. Y., Danks, M. K., Beck, W. T., and Suttle, D. P. (1991) Proc. Natl. Acad. Sci. U. S. A. 88 7654-7658 [DOI] [PMC free article] [PubMed] [Google Scholar]
- 16.Nitiss, J. L. (1994) Cancer Chemother. Pharmacol. 34 (suppl.), S6-S13 [DOI] [PubMed] [Google Scholar]
- 17.Nitiss, J., and Wang, J. C. (1988) Proc. Natl. Acad. Sci. U. S. A. 85 7501-7505 [DOI] [PMC free article] [PubMed] [Google Scholar]
- 18.Nitiss, J. L., Liu, Y. X., Harbury, P., Jannatipour, M., Wasserman, R., and Wang, J. C. (1992) Cancer Res. 52 4467-4472 [PubMed] [Google Scholar]
- 19.Gietz, D., St. Jean, A., Woods, R. A., and Schiestl, R. H. (1992) Nucleic Acids Res. 20 1425. [DOI] [PMC free article] [PubMed] [Google Scholar]
- 20.Vaughn, J., Huang, S., Wessel, I., Sorensen, T. K., Hsieh, T., Jensen, L. H., Jensen, P. B., Sehested, M., and Nitiss, J. L. (2005) J. Biol. Chem. 280 11920-11929 [DOI] [PubMed] [Google Scholar]
- 21.Nitiss, J. L., Liu, Y. X., and Hsiung, Y. (1993) Cancer Res. 53 89-93 [PubMed] [Google Scholar]
- 22.Dong, J., Walker, J., and Nitiss, J. L. (2000) J. Biol. Chem. 275 7980-7987 [DOI] [PubMed] [Google Scholar]
- 23.Worland, S. T., and Wang, J. C. (1989) J. Biol. Chem. 264 4412-4416 [PubMed] [Google Scholar]
- 24.Elsea, S. H., Hsiung, Y., Nitiss, J. L., and Osheroff, N. (1995) J. Biol. Chem. 270 1913-1920 [DOI] [PubMed] [Google Scholar]
- 25.Sabourin, M., Byl, J. A., Hannah, S. E., Nitiss, J. L., and Osheroff, N. (1998) J. Biol. Chem. 273 29086-29092 [DOI] [PubMed] [Google Scholar]
- 26.Burden, D. A., Kingma, P. S., Froelich-Ammon, S. J., Bjornsti, M. A., Patchan, M. W., Thompson, R. B., and Osheroff, N. (1996) J. Biol. Chem. 271 29238-29244 [DOI] [PubMed] [Google Scholar]
- 27.Walker, J. V., Nitiss, K. C., Jensen, L. H., Mayne, C., Hu, T., Jensen, P. B., Sehested, M., Hsieh, T., and Nitiss, J. L. (2004) J. Biol. Chem. 279 25947-25954 [DOI] [PubMed] [Google Scholar]
- 28.Lindsley, J. E. (2001) Methods Mol. Biol. 95 57-64 [DOI] [PubMed] [Google Scholar]
- 29.Jannatipour, M., Liu, Y. X., and Nitiss, J. L. (1993) J. Biol. Chem. 268 18586-18592 [PubMed] [Google Scholar]
- 30.Robinson, M. J., and Osheroff, N. (1990) Biochemistry 29 2511-2515 [DOI] [PubMed] [Google Scholar]
- 31.Robinson, M. J., Corbett, A. H., and Osheroff, N. (1993) Biochemistry 32 3638-3643 [DOI] [PubMed] [Google Scholar]
- 32.Osheroff, N., and Zechiedrich, E. L. (1987) Biochemistry 26 4303-4309 [DOI] [PubMed] [Google Scholar]
- 33.Hsiung, Y., Elsea, S. H., Osheroff, N., and Nitiss, J. L. (1995) J. Biol. Chem. 270 20359-20364 [DOI] [PubMed] [Google Scholar]
- 34.Burden, D. A., Froelich-Ammon, S. J., and Osheroff, N. (2001) Methods Mol. Biol. 95 283-289 [DOI] [PubMed] [Google Scholar]
- 35.Strumberg, D., Nitiss, J. L., Rose, A., Nicklaus, M. C., and Pommier, Y. (1999) J. Biol. Chem. 274 7292-7301 [DOI] [PubMed] [Google Scholar]
- 36.Strumberg, D., Nitiss, J. L., Dong, J., Kohn, K. W., and Pommier, Y. (1999) J. Biol. Chem. 274 28246-28255 [DOI] [PubMed] [Google Scholar]
- 37.Nitiss, K. C., Malik, M., He, X., White, S. W., and Nitiss, J. L. (2006) Proc. Natl. Acad. Sci. U. S. A. 103 8953-8958 [DOI] [PMC free article] [PubMed] [Google Scholar]
- 38.Malik, M., and Nitiss, J. L. (2004) Eukaryot. Cell 3 82-90 [DOI] [PMC free article] [PubMed] [Google Scholar]
- 39.Malik, M., Nitiss, K. C., Enriquez-Rios, V., and Nitiss, J. L. (2006) Mol. Cancer Ther. 5 1405-1414 [DOI] [PubMed] [Google Scholar]
- 40.Wasserman, R. A., and Wang, J. C. (1994) Cancer Res. 54 1795-1800 [PubMed] [Google Scholar]
- 41.Wasserman, R. A., and Wang, J. C. (1994) J. Biol. Chem. 269 20943-20951 [PubMed] [Google Scholar]
- 42.Freudenreich, C. H., and Kreuzer, K. N. (1993) EMBO J. 12 2085-2097 [DOI] [PMC free article] [PubMed] [Google Scholar]
- 43.Freudenreich, C. H., and Kreuzer, K. N. (1994) Proc. Natl. Acad. Sci. U. S. A. 91 11007-11011 [DOI] [PMC free article] [PubMed] [Google Scholar]
- 44.Mao, Y., Yu, C., Hsieh, T. S., Nitiss, J. L., Liu, A. A., Wang, H., and Liu, L. F. (1999) Biochemistry 38 10793-10800 [DOI] [PubMed] [Google Scholar]
- 45.Zechiedrich, E. L., Christiansen, K., Andersen, A. H., Westergaard, O., and Osheroff, N. (1989) Biochemistry 28 6229-6236 [DOI] [PubMed] [Google Scholar]
- 46.Pommier, Y., Schwartz, R. E., Zwelling, L. A., and Kohn, K. W. (1985) Biochemistry 24 6406-6410 [DOI] [PubMed] [Google Scholar]


