Abstract
In low-temperature-supercooled liquids, below the ideal mode-coupling theory transition temperature, hopping and continuous diffusion are seen to coexist. Here, we present a theory that shows explicitly the interplay between the two processes and shows that activated hopping facilitates continuous diffusion in the otherwise frozen liquid. Several universal features arise from nonlinear interactions between the continuous diffusive dynamics described here by the mode coupling theory (MCT)] and the activated hopping (described here by the random first-order transition theory). We apply the theory to a specific system, Salol, to show that the theory correctly predicts the temperature dependence of the nonexponential stretching parameter, β, and the primary α relaxation timescale, τ. The study explains why, even below the mean field ergodic to nonergodic transition, the dynamics is well described by MCT. The nonlinear coupling between the two dynamical processes modifies the relaxation behavior of the structural relaxation from what would be predicted by a theory with a complete static Gaussian barrier distribution in a manner that may be described as a facilitation effect. Furthermore, the theory correctly predicts the observed variation of the stretching exponent β with the fragility parameter, D. These two predictions also allow the complexity growth to be predicted, in good agreement with the results of Capaccioli et al. [Capaccioli S, Ruocco G, Zamponi F (2008) J Phys Chem B 112:10652-10658].
Keywords: complexity, glass transition, random first order
The glass transition is characterized by a number of interesting kinetic phenomena. Very slow and simultaneously nonexponential relaxation of time correlation functions over large time windows is one such important phenomenon. This relaxation is often approximated by the stretched exponential, Kohlrausch–William–Watts (KWW) formula, ø(t) = exp(−(t/τ))β, with both β and τ exhibiting nontrivial temperature dependence. The origin of the stretching is usually attributed to the presence of dynamic heterogeneity in the system (1, 2). The temperature dependence of the typical relaxation time can be described by the the Vogel–Fulcher–Tamman (VFT) expression, τ = τVFT exp(DTo/(T−To)), where τVFT is the high-temperature relaxation time, To is the VFT temperature, and D is the fragility index. The fragility index, D, determines the degree of deviation from the Arrhenius law that is appropriate for simple activated events. Experimental and theoretical model studies have shown that β and D are correlated (3–5). The temperature dependence of τ has also been described by phenomenological mode coupling theory (MCT) expression, τ ∼ [(T−Tcfit)/Tcfit]−γ, (γ > 0), but this ultimately breaks down at low temperature. Tcfit is referred to as the MCT transition temperature. Above Tcfit, MCT is found to explain many experimental results (6–9), and below Tcfit, the MCT picture of continuous diffusion fails eventually. It is conjectured that this breakdown is due to the ergodic to nonergodic transition in the dynamics and below Tcfit activated dynamics becomes a dominant mode of transport. However in an elegant work, Brumer and Reichman (10) (BR) have recently shown that the idealized MCT using microscopic input breaks down at a much higher temperature, Tc0, which corresponds to the temperature, TL, where the landscape properties show a sharp change. Kob et al. (11) have shown that the structural MCT predicts the proper dynamics till very close to Tcfit but needs static inputs to be calculated at a higher effective temperature. Stevenson et al. (12, 13) have shown that below the ergodic to nonergodic transition but before the predicted crossover to the activated dynamics, string or fractal excitations drive the dynamics and that this qualitatively describes the crossover temperature as occurring at a specific value of the configurational entropy.
Computer simulation studies seem to show the coexistence of continuous diffusion and hopping as mechanism of mass transport at temperatures much above Tcfit (14–17). These studies show that individual hopping events are often followed by enhanced continuous diffusion or more hops of the surrounding atoms or molecules (14, 15, 18). Simulations have also shown that a single hopping event relaxes the local stress (16), hence, it is expected that hopping events are followed by continuous diffusive dynamics. From BR study we know the temperature at which the ergodic to nonergodic transition takes place (Tc0 = TL) (10). However, there is no clear theoretical understanding of the dynamics in the range, Tcfit < T < Tc0. Furthermore, we need to understand, why, below Tc0, the MCT still seems to explain the form of the dynamics rather well and, finally, what happens at Tcfit that leads to the breakdown of the MCT as far as the temperature dependence is concerned. In an earlier work it was shown that the full dynamics is a synergetic effect of continuous diffusive motion and activated dynamics (19). Here, we show how the coupling between these two dynamical processes influences each other. The coupling leads to hopping-induced diffusive motion below Tc0 and thus explains the validity of MCT below Tc0. The study also explains the origin of the apparent breakdown of MCT at T0fit. The crucial result of the present study is that the coupling renormalizes the distribution of hopping barriers which participates in the dynamics. This provides a formal treatment of the facilitation effect discussed by Xia and Wolynes (4, 5) in their theory of the stretching exponent.
The present work uses a scheme of calculation similar to the one presented earlier (19) with a few modifications. For describing the diffusive motion we use the schematic F12 model of the MCT (20–22) but the activated hopping dynamics now have a static barrier height distribution (4, 5). The equation of motion for the total intermediate scattering function is written as,
In describing the activated dynamics we consider that there is a distribution of the hopping barriers in the system arising from the entropy fluctuation (4, 5). Thus, the total contribution from the multiple-barrier hopping events is written as,
 |
where ℘static(ΔF) is taken to be Gaussian,
We call this distribution, the static barrier height distribution. Here, øhops = e–tKhop(ΔF) describes the activated hopping dynamics for a single hopping barrier. Khop(ΔF) = ℱ(q)Phop(ΔF). The expression for ℱ(q) is given by .¶ For the present work the q dependence of ℱ(q) will be neglected and ℱ(q) will be set to unity. Phop(ΔF) is the average hopping rate, which is a function of the free-energy barrier height, ΔF, and is given by (23).
The equation of motion for the MCT part of the intermediate scattering function, øMCT(t), is written as,
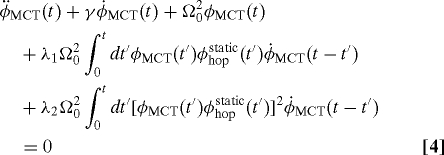 |
Now, the MCT part of the intermediate scattering function, øMCT(t) is self-consistently calculated with the full scattering function, ø(t). In describing the dynamics with schematic MCT the coupling between the different wave vectors is neglected and the contribution from the static and dynamic quantities is calculated at a single wavenumber q = qm (qm is the wave number where the peak of the structure factor appears) which is known to provide the dominant contribution. In the present formalism it is assumed that hopping opens up multiple relaxation channels for the otherwise frozen MCT dynamics.
Eqs. 1 and 4 together describe the full dynamics, which is similar in spirit to the extended MCT (21) and other recent approaches (24). The similarity of the present scheme to the extended MCT of Gotze and Sjogren was elaborately analyzed in our earlier work (19).
As in our earlier work (19), the values of Ωo and γ are kept fixed at unity, neglecting their temperature dependence, and the scaling time is taken as 1 ps. and (21, 22). The MCT formalism predicts a relationship between λ and βMCT as βMCT = −log(2)/log(1−λ) (22). ɛ is a measure of the distance from the ergodic to nonergodic transition temperature of the ideal MCT, TC0, thus . To calculate the MCT part of the relaxation we need to estimate λ and Tc0. These quantities can be calculated for systems where the static quantities (like static structure factor) are known, but for realistic systems, because of the unavailability of the static quantities, the estimation becomes difficult. We thus use the following methods to estimate λ and Tc0. The ergodic to nonergodic transition is found to take place at TL where the energy landscape properties first change (10), thus we set Tc0 = TL. TL is also the temperature where the stretching parameter starts falling (25). From experimental studies we know that for the Salol system the stretching parameter starts falling at T = 278 K (7). Thus, we estimate that Tc0 = TL = 278 K. Now, to estimate λ in this schematic MCT equation, we again make use of experimental results. MCT is expected to explain the dynamics above Tc0; thus, the stretching parameter above Tc0 should be equal to βMCT = 0.84 (7). We have also mentioned that λ and βMCT are related. Thus, λ is fixed in such a way that, above Tc0, we get the correct βMCT.
Next, we discuss the hopping dynamics for the Salol system as predicted from random first-order transition (RFOT) theory. According to the RFOT theory, the free-energy cost, F(r), which is used to calculate the mean barrier height, can be written as , where ΓK(r) and ΓA(r) are the surface energy terms at TK (Kauzmann temperature) and TA (temperature where hopping barrier disappears), respectively (19, 23). The temperature dependence of the configurational entropy can also be given by an empirical formula (26), sc = sfit(1−TK/T), where sfit is a system dependent parameter which is also related to the specific heat jump at the Kauzmann temperature (Δ̄cp(T)=sfit(TK)/T)). For the Salol system sfit = 2.65, TK = 175 K and TA = 333 K. With these values of the parameters the mean barrier height and the critical nucleus radius are calculated. We find that at T = 280 K, the size of the critical nucleus is above unity. Thus, although TA = 333 K, for all practical purposes T = 280 K should be considered as the temperature where activated events start, which, as found in simulations, is close to Tc0 (17). The value of τo is fixed in such a way that at T = 280 K, both the MCT and the hopping dynamics together predict a relaxation time that is close to that obtained in the experiment (8). Thus, for Salol the fitting gives τ0 = 2400 ps. A more microscopic treatment of the barrier height can be found by treating the shape of the nucleating region as a fuzzy sphere (12). The distribution of barrier heights arises due to the fluctuation in entropy density, which can be related to the specific heat according to the Landau formula, 〈(ΔS)2〉 = kBCp (27), where ΔS is the entropy fluctuation and CP is the specific heat. This expression can be rewritten in terms of configurational entropy fluctuation per bead δsc and heat capacity jump per bead Δ̄cp(T) as, and . Here, r* is the droplet radius determined by using F(r*) = 0. a is the length of the bead. We can also relate the entropy fluctuation to the width of the barrier height distribution, , and thus define the width of the static barrier height distribution in terms of entropy fluctuation and specific heat.
Combining the static RFOT and MCT, we solve Eqs. 1 and 4 numerically.‖ We use a numerical method presented earlier (28) with a minor modification (29). The total relaxation time, τtotal, and the stretching parameter, βtotal, are obtained from the coupled dynamics by fitting the long time part of ø(t) (obtained from Eq. 1) to a KWW stretched exponential function, ø(t) = A exp(−(t/τtotal))βtotal. Similarly from øMCT(t) we obtain the MCT relaxation time, τMCT, and the corresponding stretching parameter, βMCT.
Hopping-Induced Continuous Diffusion
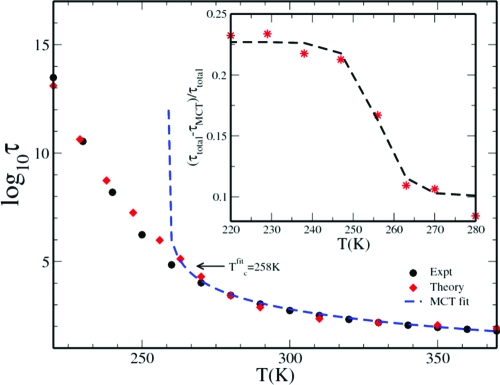
The plot for the relaxation time τtotal is given in Fig. 1, where we have also shown the experimental results (for Salol) and the fit to the MCT phenomenological expression. Already the temperature dependence of τtotal reveals several interesting physics. The τtotal compares well with the experimental results (8) and predicts the correct glass transition temperature, Tg = 220 K. Recall that in our calculation the ergodic to nonergodic transition takes place at Tc0 = 278 K where the activated dynamics also becomes significant. Thus, we know that the idealized MCT prediction breaks down at T = 278 K and below this temperature, its validity as such is unclear. However, when we fit the relaxation time to MCT expression (τ ∼ [(T−Tcfit)/Tcfit]−γ) we obtain a value, Tcfit = 258 K, which is in excellent agreement with the experimental fits (6, 8, 9).
Fig. 1.
Temperature dependence of the α relaxation timescale for Salol–hopping-induced diffusive dynamics. The timescale for the longtime part of the total structural relaxation, ø(t), obtained from experiments (8) (black circles) and that calculated from the present coupled theory, τtotal (red diamonds) are plotted against temperature. We fit the τtotal to the MCT phenomenological expression, τtotal ∼ [(T−Tcfit/Tcfit]−γ (blue dashed line), we obtain Tcfit = 258 K. (Inset) We plot (τMCT−τtotal)/τtotal as obtained from the theory (red stars). The black dashed line is a guide to the eye. The function shows a jump at approximately T = 258 K. We find that across this temperature the hopping dynamics changes its role and below Tcfit = 258 K it plays a direct role in the dynamics. The scaling times is 1 ps.
The advantage of the present scheme of calculation is that, in addition to addressing the coupling between the continuous diffusion and the hopping motion, we can separately analyze their relative contributions to the total dynamics and explore the origin of the apparent validity of the MCT below Tc0. Due to the nonlinear coupling in Eqs. 1 and 4, the activated dynamics plays both a “direct” and a “hidden” role in the total relaxation. The direct role is the direct relaxation of ø via øhopstatic. However, if we analyze the structure of Eq. 4, we find that the activated dynamics also acts to soften the growth of the longitudinal viscosity, which finally leads to the relaxation of the otherwise frozen øMCT. Thus øhopstatic plays a hidden role in the relaxation by helping øMCT to relax. Earlier simulation studies of Bhattacharyya and Bagchi have already observed this hidden role of hopping in relaxing the local stress (16). We now analyze these two different roles of the hopping dynamics and their effect on the total relaxation.
The present study shows that both continuous and activated dynamics change continuously across Tcfit. However, when we plot (τMCT − τtotal)/τtotal against T (in Fig. 1 Inset) this quantity is seen to undergo a rapid increase in the temperature range of the phenomenological MCT transition temperature Tcfit. This implies that although below Tcfit the continuous diffusion still remains the dominant mode of relaxation, there is an increased contribution from the activated dynamics. This plot suggests that in the range, Tcfit < T < Tc0, where direct hopping contribution is small, the activated dynamics plays only an important hidden role, whereas below Tcfit, it also plays a direct role in the relaxation process.
One important observation is that although idealized MCT breaks down at Tc0 = 278 K, the functional form of MCT continues to describe the dynamical characteristics until 258 K. The latter is a widely known result, usually obtained from fitting the MCT functional forms to the experimental data (6, 8, 9). Thus, our study provides an explanation of this intriguing result in terms of the interaction between the MCT and activated dynamics, which leads to hopping-induced continuous diffusive motion. This also quantitatively explains the observations reported by Kob et al. (11). The authors find that until close to Tcfit the dynamics can be described via MCT, although the static inputs need to be calculated at a higher effective temperature. The present study further shows that as we progressively lower the temperature below Tcfit, although the continuous diffusive dynamics continues to play an important role in the relaxation, the increased contribution from the activated dynamics finally leads to the breakdown of the MCT predictions.
Renormalized Barrier Height Distribution
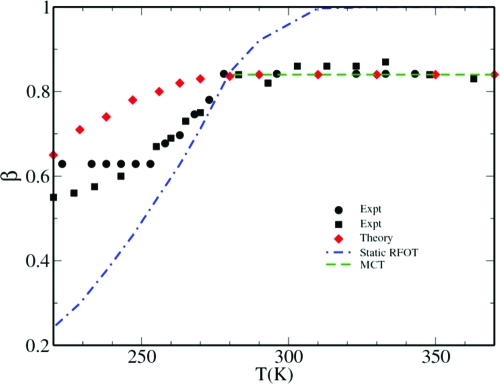
In Fig. 2 we plot the calculated temperature dependence of the stretching parameter βtotal. In the same figure we also plot βMCT and βhopstatic as predicted by the MCT and the static RFOT theory†† (by using static barrier height distribution), respectively. The experimental results on Salol are also plotted in the same figure (6, 7). It is clear that neither the MCT nor the static RFOT distribution can alone describe the proper temperature dependence of the stretching parameter. However, the coupled theory predicts a temperature dependence of βtotal which is qualitatively similar to that found in experiments. The stretching parameter is known to provide a measure of the heterogeneity in the system. In our study the heterogeneity arises from the distribution of hopping barriers. However, below Tc0, βtotal is larger than βhopstatic, which means that the barrier height distribution that participates in the dynamics (dynamic barrier height distribution) is narrower than the initial assumption of distribution (static barrier height distribution). This modification of the barrier height distribution (or heterogeneity) takes place because of the coupling between the diffusive and the activated dynamics. The timescale analysis reveals that the smaller barriers contribute to the dynamics, which implies that, in the presence of the quasi-static dynamic heterogeneity, the coupling leads to a facilitation effect. Regions that would be slow are relaxed by their neighbors.
Fig. 2.
Temperature dependence of the stretching parameter for Salol. The stretching parameter for the longtime part of the total structural relaxation, ø(t), obtained from experiments (6) (black squares) and (7) (black circle) and that calculated from the present coupled theory, βtotal (red diamonds), are plotted against temperature. In the same plot we also present the stretching parameter predicted by the RFOT theory by using the static barrier height distribution, βhopstatic (blue dashed-dot line) and the MCT, βMCT (green dashed line) (which shows no temperature dependence).
To quantify these points, we carry out the following analysis. Nonexponential relaxation in the system can be considered as arising from superposition of exponentials,
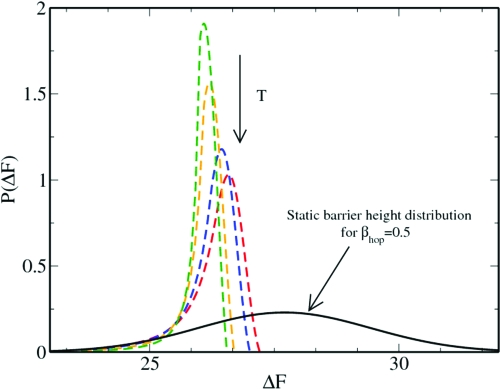
It is now possible to find an effective distribution function of the relaxation times ℘dynamic(τ) by Laplace inverting the stretched exponential. Once we obtain the distribution of relaxation times we can convert it into the distribution of barrier heights by using, ℘dynamic(ΔF)dΔF = ℘dynamic(τ)dτ, provided τ can be expressed in terms of ΔF. The details are presented in Materials and Methods. Note that it is possible to find an analytical relation between τ and ΔF only when the individual dynamics are exponential. Hence, we do this analysis considering only exponential MCT relaxation (i.e., for this analysis we choose λ such that βMCT = 1.0). We now analyze the dependence of ℘dynamic(ΔF) on the MCT relaxation time and show that ℘dynamic(ΔF) not only depends on ℘static(ΔF), but also depends on the MCT relaxation time τMCT = KMCT−1. We fix the ℘static(ΔF) and change the τMCT by calculating the MCT dynamics [which is coupled to ℘static(ΔF)] at different temperatures. The results are presented in Fig. 3.
Fig. 3.
Temperature dependence of the probability distribution of barrier heights which participate in the dynamics, ℘dynamics(ΔF). In this figure we plot the static barrier height distribution, ℘static(ΔF), which is used in the calculation of the total dynamics (black solid curve). From the total dynamics we again estimate the barrier height distribution that actually participates in the dynamics (colored dashed line). This has been done for different MCT relaxation time scale by changing the temperature of the MCT part of the dynamics (T = 240 K, 230 K, 200 K, and 175 K). As the temperature is lowered, the barrier height distribution becomes broader.
At high temperatures, where MCT dynamics is fast, ℘dynamic(ΔF) is narrow (βtotal is large), and the position of the maximum, ΔFmax, is shifted to smaller ΔF (Fig. 3). We also find that, as the MCT dynamics slows down, the distribution becomes broader and more non-Gaussian (βtotal also becomes smaller), larger barriers contribute to the dynamics, and ΔFmax shifts to higher values (though it always remains smaller than ΔFo). Thus, we find, in accord with the literature, that as the temperature is lowered (or the dynamics becomes slower) there is a growth in dynamic heterogeneity. We may say that ℘dynamic(ΔF) provides a mean field estimation of the dynamic heterogeneity. Note that ℘dynamic(ΔF) is always narrower than ℘static(ΔF) and overlaps with it only in the low barrier side. Xia and Wolynes (4) have given a physical interpretation of this exclusion of the higher barriers from the dynamics by using the picture of dynamic mosaic structure. Because the exclusion of higher barriers hastens the hopping dynamics this can be described as a “facilitation effect.” The present theoretical model does not explicitly treat the spatial structure of the dynamical mosaic. However, we find that the presence of the continuous dynamics and its coupling to the activated dynamics does lead to such a facilitation effect. Note that the facilitation is strongest when the MCT dynamics is exponential and should be weaker when we have stretching in the MCT dynamics.
The MCT modification of the static barrier height distribution, as predicted by the present theory, plays a key role in describing the proper relationship between the fragility index, D, and the stretching parameter, β. The study of Bohmer et al. (3) finds a relationship between the fragility index, D, and the stretching parameter, β, at T = Tg. As discussed in ref. 4, βhopstatic is related to the width of the static Gaussian distribution of the barrier heights δΔF. δΔF can be related to the fragility, D, . Thus, βhopstatic can be related to the fragility (4), . However, it was found that this expression alone (with the full static barrier height distribution) does not describe the correct relationship between β and D (4).
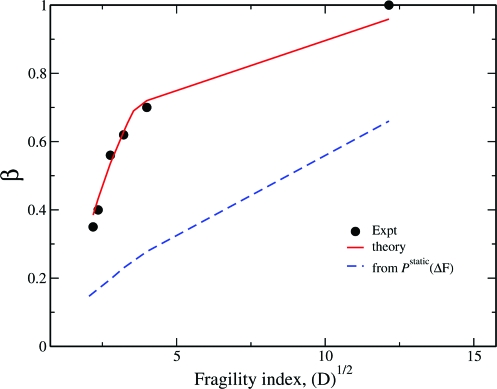
The details of the calculation are presented in Materials and Methods. In Fig. 4 we plot the relationship between βtotal and D as predicted by the present calculation. In the same plot we also show the experimental results (3). We find that the present theory captures the correct trend. This is to be contrasted with the predictions obtained from the static distribution of barrier heights. Note that, in all the cases, βtotal > βhopstatic, which implies that ℘dynamic(ΔF) is always narrower than ℘static(ΔF). Earlier we showed that ℘dynamic(ΔF) overlaps with ℘static(ΔF) only on the low barrier side. Thus, the higher barriers do not participate in the dynamics leading to facilitation effect. Hence, for a wide range of systems the theory predicts a proper modification of the barrier height distribution. Note that Xia and Wolynes (4) showed that the static barrier height distribution should have a cutoff to describe the relationship between β and D. The authors gave a physical explanation of this “cutoff” by using the picture of dynamic mosaic structure.
Fig. 4.
Fragility dependence of the stretching parameter. The stretching parameter for the total structural relaxation, ø(t), obtained from experiments βexpt (3) (black circles) and that calculated from the present coupled theory, βtotal (red solid line) are plotted against the square root of fragility index D. As D decreases, the fragility of the system increases. In the same plot we also present the stretching parameter predicted by the full static barrier height distribution (blue dashed line). The experimental and the theoretical values are at the glass transition temperature T = Tg.
The combination of distributed activated hopping and mode coupling facilitation also explains some recent exciting experimental observations of Capaccioli et al. (31). These authors recognized that, in those theories of glassy dynamics based on an underlying entropy crisis, the complexity of a dynamically correlated region is a key quantity. They also used earlier insights (32, 33) to show how this quantity can be roughly inferred from experiment. This inference is independent of chemical details, such as bead count, which have previously been used for comparisons of RFOT theory with experiment.
The complexity, αCRR (the logarithm of the number of accessible states in a cooperatively rearranging region) is obtained by combining the configurational entropy density, Sc, inferred from calorimetry, with the temperature dependence of dynamics as reflected in the alpha relaxation time, τα(T), and stretching exponent of dielectric relaxation or viscosity, β(T) (31).
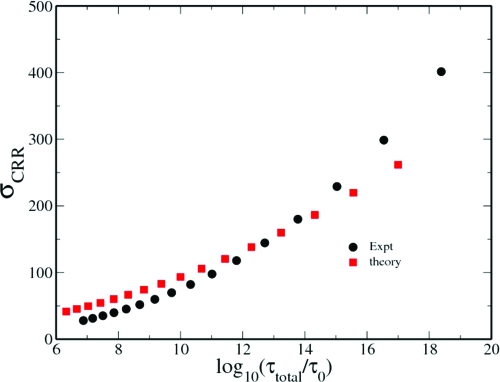
In those purely kinetic models of the glass transition that are based on the facilitation concept but have trivial underlying thermodynamics (34), one would not expect this inferred complexity to be a universal function of the relaxation time. However, according to the Adam–Gibbs argument, the complexity should be a constant for all values of the relaxation time but could depend on substance. The static RFOT theory predicts that the logarithm of the relaxation timescales should be a universal function of the complexity of the dynamically reconfiguring regions for all glass formers. In contrast to the expectations from thermodynamically trivial kinetic models, Capaccioli et al. (31) showed a very strong data collapse of this complexity, σCRR versus log10(τα) for many substances. The Adam–Gibbs prediction of a constant value is not borne out, however. In contrast also to static RFOT, which predicts an asymptotically linear relation, the experimental data show a distinct curvature.
In Fig. 5 we show the prediction of σCRR versus log10(τtotal/τ0) that is obtained from the present calculation‡‡ for Salol using the analysis of Capaccioli et al. along with their results (31). In harmony with the experimental observation we see that the combined MCT/activated RFOT mechanism does give a curvature. The universal curve obtained experimentally was fit by an assumed scaling form containing several adjustable exponents. The present calculations suggest that the true asymptotic region may not yet have been reached experimentally. At the same time, we must be clear that the present calculation is still a low-order one. It is conceivable that a renormalization group treatment, in which the static RFOT barriers themselves are modified by the MCT effects that occur on shorter-length scales, could ultimately give anomalous scaling even in the ultimate asymptotic regime.
Fig. 5.
Relation between alpha relaxation timescale and complexity of dynamically reconfiguring regions. σCRR calculated from the present theory (see footnote ‡‡) (red squares) is plotted against log10 (τtotal/τ0) for Salol by using the analysis of Capaccioli et al. (31). This τ0 is the relaxation time at high temperature and different from the τ0 used to describe the activated dynamics. We also plot the results presented by Capaccioli et al. (31) that they obtained from experimental data (black circles).
The present study enriches our understanding of the dynamics below the ergodic to nonergodic transition temperature, Tc0. It predicts the presence of hopping-induced diffusive dynamics below Tc0. It also predicts that this diffusive dynamics continues to exist even below Tcfit and provides a dominant contribution to the total dynamics. However, in this temperature range there is an increased contribution from the activated dynamics that leads to the breakdown of the MCT. The diffusive dynamics is found to modify the activated dynamics by redefining the barrier height distribution of the hopping events in a way such that the higher barriers are excluded from the total dynamics. Thus, we find that in this unified theory the two dynamical processes do not just act as parallel channels of relaxation, but they interact with each other and modify each other's behavior, which leads to the facilitation of the total dynamics.
Materials and Methods
Relationship Between τtotal and ΔF.
According to the present theory, , where . Even for the simple exponential MCT relaxation the relationship between KMCT and ΔF is nontrivial (29). However, in the low-temperature limit we can write , where . A is the Debye–Waller factor or the form factor (height of the plateau), thus, . ΔFo, is calculated at T = Tg, by using Salol parameters. δΔF is related to βhopstatic [by βhopstatic = [1+(δΔF/kBT)2]−1/2 (4, 30)] and it is taken in such a way that it gives βhopstatic = 0.5. We calculate the total relaxation and fit it to a stretched exponential. From the fitting we obtain τtotal and βtotal. This is now fed into Eq. 5 to obtain ℘dynamic(ΔF).
Fragility Dependence of βtotal.
The mean barrier height depends on the configurational entropy and is almost independent of the system; thus, for all the systems (12), we calculate ΔFo by using Salol parameters (sfit = 2.65, TK = 175 K, Tc0 = 278 K). δΔF is fixed according to the value of D, which is taken from Bohmer et al. (3). For the Salol system τo is used as a fitting parameter to describe the proper timescale of the dynamics. In this calculation we also vary τo for each system in such a way that at T = Tg the relaxation time is of the order of 100 s. We find that, for a more fragile system, we need a larger value of τo.
Above Tcfit, the dynamics is expected to be described completely by the MCT. Thus, the βtotal above Tc0 should be equal to the βMCT value. For the systems like Salol (6), Glycerol (35), and Silica [Silica is known to be a strong liquid with β ≃ 1.] where the value of βMCT at high temperatures is known, we use these values to define βMCT. For the systems where βexpt at high temperatures are not known, we use a reasonable value [definitely larger than βexpt(T = Tg)] and also vary it in small amounts along with τo to get the proper relaxation timescale at Tg. Tc0 is kept same as that for the Salol system. So, our only constraint is that the timescale should be of the order of 100 s at Tg.
Acknowledgments.
S.M.B. thanks Prof. K. Miyazaki for discussions. This work was supported in part by Department of Science and Technology, J.C. Bose Fellowship, and the National Science Foundation.
Footnotes
The authors declare no conflict of interest.
In the previous article (19) there was a mistake in the derivation of the hopping kernel. The correct expression is presented here.
The results converge properly for the total time step N = 510 and the initial timestep for the integration is taken to be 10−9 ps.
When the full static barrier height distribution is considered we can write βhopstatic = [1 + (δΔF/kBT)2]−1/2 (4, 30).
σCRR is calculated from Eq. 6. In the calculation, the temperature dependence of Sc and ΔCP are calculated by using the empirical forms (for details, see text) (26). The temperature dependence of τtotal is obtained from the theory (Fig. 1). In our theory, although we predict a temperature dependence of β(T), to compare our results with Capaccioli et al. (31) we have considered, following those authors, β(T) to be independent of T. We fixed it to its value at T = Tg. For this plot we take τo = 10−3.9 ps (31).
References
- 1.Kob W, Donati C, Plimpton SJ, Poole PH, Glotzer SC. Dynamical heterogeneities in a supercooled Lennard-Jones liquid. Phys Rev Lett. 1997;79:2827–2830. [Google Scholar]
- 2.Cicerone MT, Ediger MD. Relaxation of spatially heterogeneous dynamic domains in supercooled ortho-terphenyl. J Chem Phys. 1995;103:5684–5692. [Google Scholar]
- 3.Bohmer R, Ngai KL, Angell CA, Plazek DJ. Nonexponential relaxations in strong and fragile glass formers. J Chem Phys. 1993;99:4201–4209. [Google Scholar]
- 4.Xia X, Wolynes PG. Microscopic theory of heterogeneity and nonexponential relaxations in supercooled liquids. Phys Rev Lett. 2001;86:5526–5529. doi: 10.1103/PhysRevLett.86.5526. [DOI] [PubMed] [Google Scholar]
- 5.Xia X, Wolynes PG. Fragilities of liquids predicted from the random first order transition theory of glasses. Proc Natl Acad Sci USA. 2000;97:2990–2994. doi: 10.1073/pnas.97.7.2990. [DOI] [PMC free article] [PubMed] [Google Scholar]
- 6.Li G, Du WM, Sakai A, Cummins HZ. Light-scattering investigation of α and β relaxation near the liquid-glass transition of the molecular glass Salol. Phys Rev A. 1992;46:3343–3356. doi: 10.1103/physreva.46.3343. [DOI] [PubMed] [Google Scholar]
- 7.Dreyfus C, et al. Brillouin scattering in Salol: Determining Tc of the mode coupling theory. Phys Rev Lett. 1992;69:3666–3669. doi: 10.1103/PhysRevLett.69.3666. [DOI] [PubMed] [Google Scholar]
- 8.Stickel F, Fischer EW, Richert R. Dynamics of glass-forming liquids: I. Temperature-derivative analysis of dielectric relaxation data. J Chem Phys. 1995;102:6251–6257. [Google Scholar]
- 9.Hinze G, Brace DD, Gottke SD, Fayer MD. A detailed test of mode-coupling theory on all time scales: Time domain studies of structural relaxation in a supercooled liquid. J Chem Phys. 2000;113:3723–3733. [Google Scholar]
- 10.Brumer Y, Reichman DR. Mean-field theory, mode-coupling theory, and the onset temperature in supercooled liquids. Phys Rev E. 2004;69 doi: 10.1103/PhysRevE.69.041202. 041202-1–041202-5. [DOI] [PubMed] [Google Scholar]
- 11.Kob W, Nauroth M, Sciortino F. Quantitative tests of mode-coupling theory for fragile and strong glass formers. J Non-Cryst Solids. 2002;307-310:181–187. [Google Scholar]
- 12.Stevenson JD, Schmalian J, Wolynes PG. The shapes of cooperatively rearranging regions in glass-forming liquids. Nat Phys. 2006;2:268–274. [Google Scholar]
- 13.Hall RW, Wolynes PG. Intermolecular forces and the glass transition. J Phys Chem B. 2008;112:301–312. doi: 10.1021/jp075017j. [DOI] [PubMed] [Google Scholar]
- 14.Bhattacharyya S, Mukherjee A, Bagchi B. Correlated orientational and translational motions in supercooled liquids. J Chem Phys. 2002;117:2741–2746. [Google Scholar]
- 15.Mukherjee A, Bhattacharyya S, Bagchi B. Pressure and temperature dependence of viscosity and diffusion coefficients of a glassy binary mixture. J Chem Phys. 2002;116:4577–4586. [Google Scholar]
- 16.Bhattacharyya S, Bagchi B. Anisotropic local stress and particle hopping in a deeply supercooled liquid. Phys Rev Lett. 2002;89 doi: 10.1103/PhysRevLett.89.025504. 025504-1–025504-4. [DOI] [PubMed] [Google Scholar]
- 17.Denny RA, Reichman DR, Bouchaud J-P. Trap models and slow dynamics in supercooled liquids. Phys Rev Lett. 2003;90 doi: 10.1103/PhysRevLett.90.025503. 025503-1–025503-4. [DOI] [PubMed] [Google Scholar]
- 18.Chaudhuri P, Berthier L, Kob W. Universal nature of particle displacements close to glass and jamming transitions. Phys Rev Lett. 2007;99 doi: 10.1103/PhysRevLett.99.060604. 060604-1–060604-4. [DOI] [PubMed] [Google Scholar]
- 19.Bhattacharyya SM, Bagchi B, Wolynes PG. Bridging the gap between the mode coupling and the random first order transition theories of structural relaxation in liquids. Phys Rev E. 2005;72 doi: 10.1103/PhysRevE.72.031509. 031509-1–031509-11. [DOI] [PubMed] [Google Scholar]
- 20.Gotze W. In: Liquids, Freezing and the Glass Transition. Hansen JP, Levesque D, Zinn-Justin J, editors. Amsterdam: North Holland; 1991. pp. 287–503. [Google Scholar]
- 21.Gotze W, Sjogren L. The glass transition singularity. Z Phys B-Cond Mat. 1987;65:415–427. [Google Scholar]
- 22.Gotze W, Sjogren L. Scaling properties in supercooled liquids near the glass transition. J Phys C Solid State Phys. 1988;21:3407–3421. [Google Scholar]
- 23.Lubchenko V, Wolynes PG. Barrier softening near the onset of nonactivated transport in supercooled liquids: Implications for establishing detailed connection between thermodynamics and kinetic anomalies in supercooled liquids. J Chem Phys. 2003;119:9088–9105. [Google Scholar]
- 24.Greenall MJ, Cates ME. Crossover behavior and multistep relaxation in a schematic model of the cutt-off glass transition. Phys Rev E. 2007;75 doi: 10.1103/PhysRevE.75.051503. 051503-1–051503-12. [DOI] [PubMed] [Google Scholar]
- 25.Sastry S, Debenedetti PG, Stillinger FH. Signatures of distinct dynamical regimes in the energy landscape of a glass-forming liquid. Nature. 1998;393:554–557. [Google Scholar]
- 26.Richert R, Angell CA. Dynamics of glass-forming liquid. V. On the link between molecular dynamics and configurational entropy. J Chem Phys. 1998;108:9016–9026. [Google Scholar]
- 27.Landau LD, Lifshitz EM. Statistical Physics. Reading, MA: Addison-Wesley; 1969. pp. 338–343. [Google Scholar]
- 28.Fuchs M, Gotze W, Hofacker I, Latz A. Comments on the α-peak shapes for relaxation in supercooled liquids. J Phys Condensed Matter. 1991;3:5047–5071. [Google Scholar]
- 29.Bhattacharyya SM, Bagchi B, Wolynes PG. Dynamical heterogeneity and the interplay between activated and mode coupling dynamics in supercooled liquids. 2007 http://arXiv.org/abs/0702435.
- 30.Monthus C, Bouchaud J. Models of traps and glass phenomenology. J Phys A. 1996;29:3847–3869. [Google Scholar]
- 31.Capaccioli S, Ruocco G, Zamponi F. Dynamically correlated regions and configurational entropy in supercooled liquids. J Phys Chem B. 2008;112:10652–10658. doi: 10.1021/jp802097u. [DOI] [PubMed] [Google Scholar]
- 32.Berthier L, et al. Direct experimental evidence of a growing length scale accompanying the glass transition. Science. 2005;310:1797–1800. doi: 10.1126/science.1120714. [DOI] [PubMed] [Google Scholar]
- 33.Dalle-Ferrier C, et al. Spatial correlations in the dynamics of glassforming liquids: Experimental determination of their temperature dependence. Phys Rev E. 2007;76 doi: 10.1103/PhysRevE.76.041510. 041510–041515. [DOI] [PubMed] [Google Scholar]
- 34.Fredrickson GH, Andersen HC. Kinetic Ising model of the glass transition. Phys Rev Lett. 1984;53:1244–1247. [Google Scholar]
- 35.Leon C, Ngai KL. Rapidity of the change of the Kohlrausch exponent of the α-relaxation of glass-forming liquids at TB or Tβ and Consequences. J Phys Chem B. 1999;103:4045–4051. [Google Scholar]


