MEDICAL SCIENCES. For the article “Lithium delays progression of amyotrophic lateral sclerosis,” by Francesco Fornai, Patrizia Longone, Luisa Cafaro, Olga Kastsiuchenka, Michela Ferrucci, Maria Laura Manca, Gloria Lazzeri, Alida Spalloni, Natascia Bellio, Paola Lenzi, Nicola Modugno, Gabriele Siciliano, Ciro Isidoro, Luigi Murri, Stefano Ruggieri, and Antonio Paparelli, which appeared in issue 6, February 12, 2008, of Proc Natl Acad Sci USA (105:2052–2057; first published February 4, 2008; 10.1073/pnas.0708022105), the authors note that portions of Fig. 2e and of supporting information (SI) Figs. 11b, 12c, 13c, 17c, 19 a and b, 20e, and 23b were assembled from multiple sources or include images moved from their original orientation. The rearrangements were done to provide clarity and consistency within the figures. We regret not explicitly noting this rearrangement in the text or figure legends. We are providing corrected figures, with the rearrangements indicated by thin vertical lines, in accordance with PNAS policies. In addition, SI on the web site has been updated to include the revised figures. The corrected figures and their legends appear below.
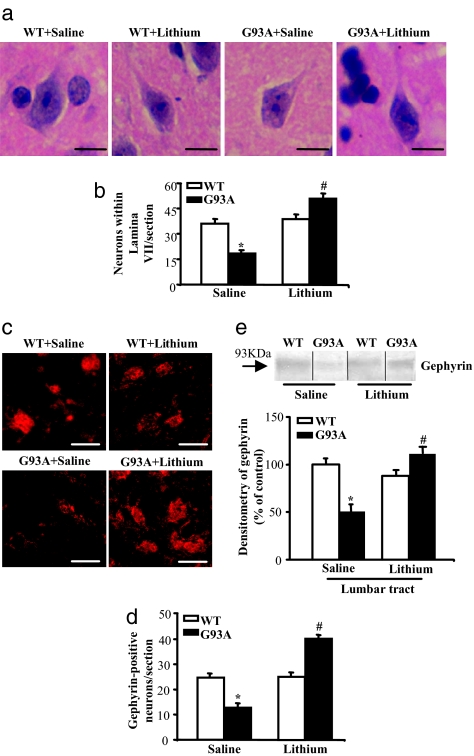
Fig. 2.
Neuroprotective effects of lithium on medium-size lamina VII neurons. (a) Representative micrographs of those H&E-stained lamina VII neurons that were selected for the count based on size specificity (diameter from 10 to 20 μm). (b) Graph indicates the severe loss of these neurons in G93A mice, which exceeded the loss of MN. Remarkably, the G93A mice treated with lithium showed a much higher number of lamina VII medium-size neurons, even compared with saline-treated WT mice. (c–e) These results were confirmed by gephyrin immunostaining, as shown here, and by all of the staining procedures summarized in SI Fig. 16. Counts represent the mean ± SEM of 62,000 cells per group (3,100 per mouse in groups of 20 mice). Comparison among groups was made by using one-way ANOVA. *, P ≤ 0.05 compared with WT saline-treated group. #, P ≤ 0.001 compared with G93A saline-treated groups. (Scale bars: 17 μm.)
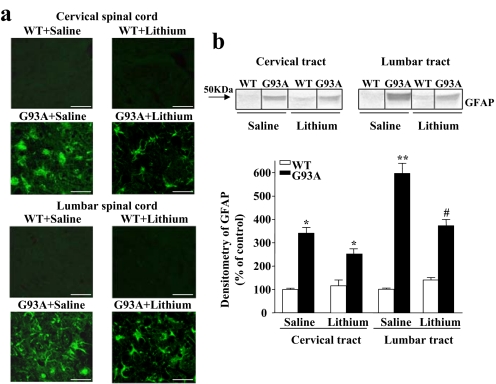
SI Fig. 11.
Lithium treatment decreases GFAP immunostaining. (a) Immunofluorescence of cervical and lumbar spinal cords of WT and G93A lithium-treated mice compared with the saline-treated mice showing GFAP staining. At the end of the disease, GFAP immunofluorescence appears highly intense in G93A saline-treated mice, whereas lithium treatment decreases GFAP-positive cells in both tracts of the spinal cord compared with saline-treated G93A mice. No GFAP staining was observed in age-matched, saline- or lithium-treated WT mice. (b) Representative immunoblots and relative densitometric analysis of GFAP expression in the spinal cord of saline- and lithium-treated WT and G93A mice. The significance of these findings is discussed in SI Discussion, -2- The Potential Role of Interference with Glial Activation. Values represent the mean ± SEM of five repeated analyses compared by one-way ANOVA. *, P < 0.05 compared with WT saline-treated group; **, P < 0.01 compared with WT saline-treated group; #, P < 0.05 compared with WT and G93A saline-treated groups. (Scale bars: 28 μm.)
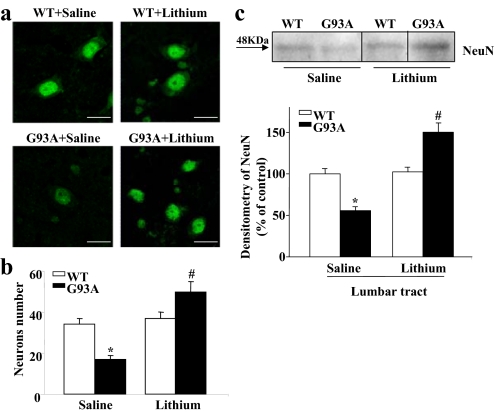
SI Fig. 12.
Lithium treatment increases the number of NeuN-positive neurons within Lamina VII. (a) Representative images showing NeuN-positive neurons in the Lamina VII of WT and G93A saline- and lithium-treated mice. (b) Histogram shows the number of NeuN-positive neurons within the Lamina VII of the lumbar spinal cord increased in the G93A mice after lithium treatment. Remarkably, this effect not only consisted of protection from the loss that occurred in the G93A saline-treated mice, but extended to a robust increase in neuron number compared with saline-treated controls. The number of NeuN-positive neurons overlaps that reported within Lamina VII after H&E staining, calbindin 28K, and gephyrin immunostaining. The counting criteria were the same under comparable stereological conditions. (c) Representative Western blot and densitometric analyses of NeuN expression in the lumbar spinal cord of WT and G93A mice, which confirms the increase in NeuN staining after lithium treatment. Values represent means ± SEM, analyzed by one-way ANOVA. *, P < 0.05 compared with WT saline-treated group; #, P < 0.05 compared with WT and G93A saline-treated groups. (Scale bars: 13 μm.)
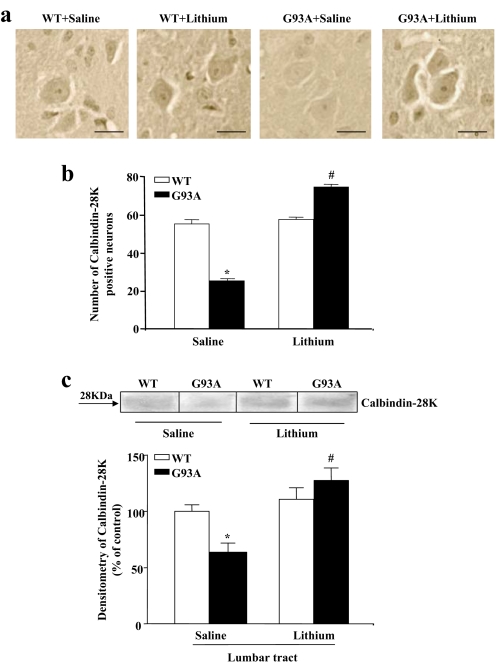
SI Fig. 13.
Lithium treatment increases the number of calbindin 28K-positive neurons in Lamina VII. (a) Lumbar spinal cord sections from saline- and lithium-treated WT and G93A mice immunostained for calbindin 28K. (b) Histogram shows the significant loss of Lamina VII calbindin 28K-positive neurons in the G93A mutant mice compared with WT. Even in this case, the increase in the number of neurons in G93A mice after lithium treatment significantly surpasses that counted in controls. As observed after the other staining procedures, lithium induced no effect on neuron number in WT mice. (c) Representative Western blot and densitometric analyses of calbindin 28K expression in lumbar spinal cord in WT and G93A mice confirm the loss of the calbindin 28K-positivity in G93A saline-treated mice and the increase in the calbindin 28K-positivity after lithium treatment. Values represent means ± SEM, analyzed by one-way ANOVA. *, P < 0.05 compared with WT saline-treated group; #, P < 0.05 compared with WT and G93A saline-treated groups. (Scale bars: 16 μm.)
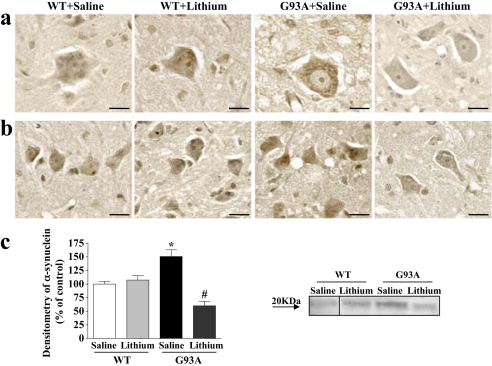
SI Fig. 17.
Effects of lithium on α-synuclein immunostaining. (a and b) Representative images of Lamina IX (a) and Lamina VII (b) of α-synuclein immunostaining of WT and G93A mice after saline and lithium treatment. Images suggest an increase in α-synuclein staining in G93A mice, which is reverted by lithium administration. (Scale bars: 18 μm.) (c) Representative Western blot and densitometric analyses of α-synuclein expression confirming the lithium-induced occlusion in α-synuclein increased positivity of G93A mice. Values represent means ± SEM, analyzed by one-way ANOVA. *, P < 0.05 compared with WT saline-treated group; #, P < 0.05 compared with WT and G93A saline-treated groups.
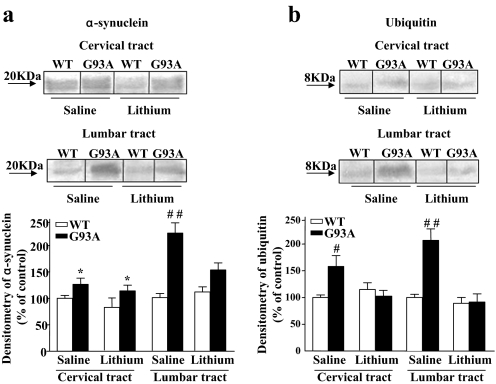
SI Fig. 19.
Lithium reduces both α-synuclein and ubiquitin in the spinal cord of G93A mice. Representative Western blots and densitometric analysis of α-synuclein (a) and ubiquitin (b) expression in the cervical and lumbar tracts of WT and G93A saline- and lithium-treated mice. Lithium significantly decreased the expression of α-synuclein in the lumbar tract, whereas the expression of ubiquitin decreased in both the cervical and lumbar tracts. Values represent means ± SEM, analyzed by one-way ANOVA. *, P < 0.05 compared with WT saline-treated group; #, P < 0.05 compared with WT saline-treated mice and G93A lithium-treated mice; ##, P < 0.01 compared with WT saline-treated mice and G93A lithium-treated mice.
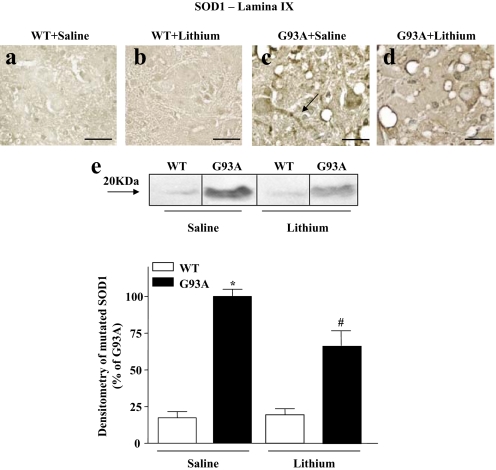
SI Fig. 20.
Effects of lithium on SOD1 immunostaining. (a–d) Immunostaining for SOD1 is lighter in WT (a and b) compared with G93A (c and d) mice. In particular, G93A mice treated with saline show intense and aggregated SOD1 immunostaining (c), which, similarly to ubiquitin, was also found in the axon of motor neurons (arrow). This SOD1 accumulation was markedly cleared after lithium administration (d). (Scale bars: 33 μm.) (e) Representative Western blot and densitometric analyses of a triplicate of SOD1 expression shows an accumulation of the protein in G93A saline-treated mice, whereas this is suppressed after lithium administration. Values represent means ± SEM, analyzed by one-way ANOVA. *, P < 0.05 compared with WT saline-treated group; #, P < 0.05 compared with WT and G93A saline-treated groups.
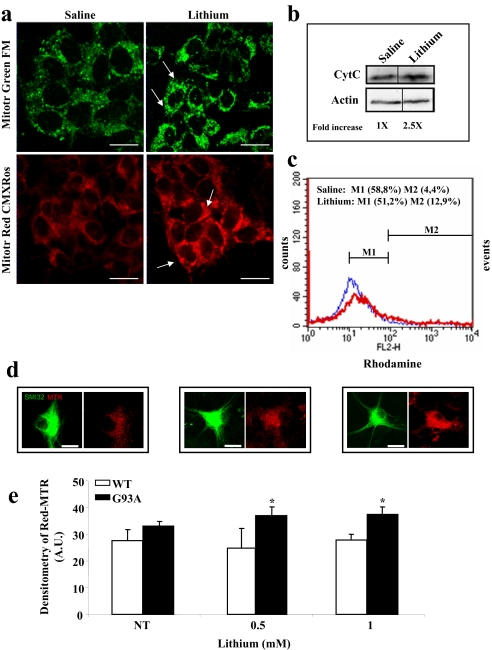
SI Fig. 23.
Effects of lithium administration on mitochondria in motor neuron cell cultures and cell lines. (a) SH-SY5Y cells plated on sterile coverslips were either not treated (saline) or were treated for 72 h with 1 mM lithium (changing the medium and readding the substance every 24 h), stained for 60 min with 300 nM MitoTracker Red or MitoTracker Green (Invitrogen), and observed under the confocal fluorescence microscope. Arrows point to cytoplasmic regions of high fluorescence intensity that indicate the accumulation of mitochondria. (Scale bars: 17 μm.) (b) Immunoblotting of cytochrome C (monoclonal antibody; Alexis) in homogenates of SH-SY5Y cells treated for 72 h with 1 mM lithium or not treated (saline). One blot, representative of three, is shown. Using densitometry, the amount of cytochrome C increased in treated vs. nontreated cells by a factor of 2.5. (c) Flow cytometry analysis of control and lithium-treated (1 mM for 72 h) SH-SY5Y cells labeled with rhodamine-123 (100 nM for 20 min), a fluorescent dye that accumulates specifically in healthy mitochondria. Cytofluorimetry profiles show consistent differences between the two populations. In particular, the proportion of cells showing a higher rhodamine labeling (fluorescence > 102 arbitrary units; M2) is increased by 3-fold upon treatment with lithium. Data shown are representative of five independent determinations. (d) Neuronal cultures were treated with 0.5 and 1 mM lithium for 18 h (the time interval used in all of the cell culture experiments), then MitoTracker Red was added to the culture for 1 h [lithium and nontreated (NT)]. Labeled mitochondria were quantified on the basis of MitoTracker Red fluorescence in treated and NT cultures. (Scale bars: 40 μm.) (e) Data are expressed in arbitrary units as background-subtracted fluorescence intensity, assessed by selecting three small regions without cells on the coverslip. Images were collected by using a confocal laser microscope (CLSM510; Zeiss) and were analyzed by using the ImageJ analysis program. The values represent means ± SEM, analyzed by one-way ANOVA after Newman–Keuls post hoc test. *, P < 0.05 compared with WT.


