Abstract
To the extent that their fate choice and differentiation processes can be understood and manipulated, neural stem cells represent a promising therapeutic tool for a variety of neuropathologies. We have previously shown that mature astrocytes possess neural stem cell attributes, and can give rise to neurons through the formation of multipotent neurosphere clones. Here we show that relatively mature neurons generated from neurospheres derived from postnatal subependymal zone or cerebellar cortex undergo a phenotypic transformation into astrocytes that coincides with the appearance of a non-fused, hybrid cell type that shares the morphology, antigenicity, and physiology of both neurons and astrocytes. We refer to this astrocyte/neuron hybrid as an “asteron”, and hypothesize that it represents an intermediate step in the trans- or de-differentiation of neurons into astrocytes. The present finding suggests that seemingly terminally differentiated neural cells may in fact represent points along a bi-directionally fluid continuum of differentiation, with intermediate points represented by “hybrid” cells co-expressing phenotypic markers of more than one lineage.
Persistent germinal matrices in the subependymal zone (SEZ), and subgranular layer of the hippocampus contain neural stem cells (NSC) responsible for in vivo neurogenesis (Smart, 1961; Altman and Das, 1965; Kaplan and Hinds, 1977), and NSC's from these and other regions along the neuraxis (Weiss et al., 1996) can be cultured as multipotent clones (neurospheres) that generate neurons, astrocytes, and oligodendrocytes (Reynolds and Weiss, 1992; Kukekov et al., 1999). Many investigators have demonstrated that certain “neurogenic” astrocytes (Laywell et al., 2000) display neural stem cell characteristics (Kondo and Raff, 2000; Seri et al., 2001), leading to the conclusion that some differentiated cells can undergo a process of de- or trans-differentiation to acquire characteristics of ontogenetically more primitive cells. In the present study, we analyze the fate of cells derived from differentiating primary neurospheres to show that unambiguously identified neurons can undergo a phenotypic shift into cells with astrocyte characteristics by transitioning through an “asteron” (neuron/astrocyte hybrid) morphotype. Asterons are transient, co-express a variety of neuron- and astrocyte-specific proteins and genes, exhibit a membrane physiology that appears to combine properties of neurons and astrocytes, and do not result from neuron/astrocyte fusion.
Taken together, these data suggest that, under the appropriate culture conditions neurons can alter their phenotype to assume characteristics associated with astrocytes. Our results are supported by recent reports describing the in vitro presence of astrocyte/oligodendrocyte “hybrids”(Milosevic and Goldman, 2002), as well as neurons with some astrocyte characteristics in cultured cerebellar dissociates (Okano-Uchida et al., 2004). These findings represent the discovery of a novel cellular state during the differentiation of neural stem/progenitor cells whereby attributes of both neuronal and astroglial phenotype are present in the same cell. This “phenotypic fluidity” is characterized using a variety of molecular and physiological approaches, and supports the notion that, not only do astrocyte-like stem cells have the ability to generate neurons (Doetsch et al., 1999; Laywell et al., 2000), but newly-generated neurons can revert to an astrocytic phenotype under stressful (e.g. in vitro) conditions. Numerous reports of the apparent resiliency of glial cells derived from stem cells in neural grafting studies may actually be explained by a similar, post-transplantation transition of neurons into astrocytes. Thus, this work has significant ramifications toward understanding neural fate choice decisions, and a new thinking regarding the propensity for glial cell “survival” seen in neural grafting studies.
Material and Methods
Generation of neurospheres
Postnatal day 1-10 (P1-P10) C57BL/6 mice (The Jackson Laboratory) deeply anesthetized by hypothermia and decapitated. The SEZ and cerebellar cortex were removed, and dissociated into a single-cell suspension as previously described (Laywell et al., 2002). Cells were then plated into standard T25 tissue culture flasks in growth medium consisting of DMEM/F12 containing N2 supplements, 5% fetal bovine serum (FBS; Atlanta Biologicals), 20ng/mL epidermal growth factor (EGF; Sigma, St. Louis), and 10ng/mL basic fibroblast growth factor (bFGF; Sigma). After 1-2 days, floating cells were collected, centrifuged, trypsinized, triturated into a single-cell suspension, and counted. A secondary culture was initiated by resuspending cells in growth medium (with or without BrdU), and plating them into ultra low attachment polystyrene 6-well plates (Corning, NY) at densities ranging from 1×10³ to 1×10⁵ cells/cm2. Neurospheres became apparent within 3-5 days.
Differentiation and immunolabeling of spheres
To promote differentiation, spheres were placed into a drop of differentiation medium (DMEM/F12 + N2 supplements + 5% FBS, with or without on coverglass coated sequentially with polyornithine and laminin (10μg/mL and 5μg/mL, respectively; Sigma). Some neurospheres were plated in the presence of 10μM bromodeoxyuridine (BrdU; Sigma) in order to label proliferating cells. Eighteen hours to 4 weeks after plating, coverslips were fixed with 4% paraformaldehyde in PBS, and processed for immunofluorescence as described (Laywell et al., 2000) with a variety of antibodies, including monoclonal (Promega, Madison, WI) and polyclonal (Covance, Richmond, CA) antibodies against the neuronal cytoskeletal protein β-III tubulin, monoclonal and polyclonal antibodies against the astrocyte intermediate glial fibrillary acidic protein (GFAP), (Immunon, Pittsburgh), a monoclonal antibody against the neuronal nuclear protein NeuN (Chemicon, Temecula, CA), polyclonal antibodies against the astrocyte-associated calcium binding protein S100β (Swant; Bellinzona, Switzerland). For detection of BrdU, cells were first incubated in 1:1 formamide:2× SSC for 2 hr. at 65°, and 2N HCl for 30 min. at 37°. After equilibrating for 10 min. in borate buffer, cells were immunolabeled with a monoclonal rat antibody against the thymidine analog BrdU (Abcam, Cambridge, MA) in combination with anti-GFAP and anti- β-III tubulin antibodies. After washing and applying appropriate fluorescent secondary antibodies (Molecular Probes, Eugene, OR), the cells were counterstained with Hoechst 33342 fluorescent nuclear stain (Sigma), coverslipped, and viewed with epifluorescence or confocal microscopy. Images were captured on a Spot camera and Spot software and Adobe Photoshop were used to adjust contrast and brightness to more closely resemble images seen under the microscope.
In Situ Hybridization with GFAP cDNA
GFAP cDNA probes were generated by RT-PCR amplification of a 401bp DNA fragment from neonatal mouse brain tissue with a pair of primers designed with the Primer 3 program (http://frodo.wi.mit.edu/cgi-bin/primer3/primer3_www.cgi), using the GFAP sequence from the Genebank database (gi: 26080421). Forward primer: GCCACCAGTAACATGCAAGA; Reverse primer: ATGGTGATGCGGTTTTCTTC. The PCR product was cloned into the PCR4 TOPO vector (Invitrogen, Carlsbad, CA). After linearization, plasmids extracted from clones of both directions were used as templates to synthesize digoxigenin (DIG)-labeled GFAP sense and antisense probes using the T7 RNA polymerase (1277073 Roche, Indianapolis, IN).
The hybridization protocol followed the method of Braissant and Wahli (Braissant and Wahli, 1998), with a probe concentration of 400ng/ml, and the hybridization temperature set at 45°C. Hybridized probe was immunodetected with a monoclonal antibody against DIG (Roche, Indianapolis, IN) using alkaline phosphatase as the chromagen. Finally, hybridized cells were processed for immunolabeling with antibodies against GFAP and β-III tubulin, as described above.
Analysis of cell death
Apoptotic cells within plated spheres were visualized using a fluorometric terminal deoxynucleotidyl transferase-mediated dUTP nick-end labeling (TUNEL) assay (G3250 Promega, Madison, WI) according to the manufacturer's recommendations. This assay measures the fragmented DNA of apoptotic cells by incorporating fluoroscein-labeled dUTP at the 3′ ends of DNA strands. As a positive control, some spheres were processed for TUNEL following 30 min. incubation with DNase. Alternatively, activated caspase 3, an enzyme present in early stages of apoptosis, was detected in plated spheres using an anti-activated caspase 3 antibody (BD Pharmingen, San Diego, CA). As a positive control, some spheres were treated with staurosporine (1μg/ml for 4 hours at 37°C) prior to immunolabeling. Following TUNEL processing or caspase 3 labeling, spheres were immunolabeled as above with antibodies against β-III tubulin, and counterstained with Hoechst 33342 (Sigma).
Cell death was quantified by counting the number of TUNEL+ or caspase 3+ nuclei within every sphere on each of three coverslips (range = 12-15 spheres/coverslip). The criterion for apoptotic neurons was intentionally liberal to avoid undercounting. All TUNEL+ or caspase 3+ cells contacting a β-III tubulin+ process were counted as apoptotic neurons.
Chromosome Painting
Spheres plated for 48-96 hours were used to determine the occurrence of in vitro fusion. Asterons emanating from spheres were prospectively identified by combined immunolabeling for GFAP and β-III tubulin, with Hoechst 33342 as a nuclear counterstain. After extensive photodocumentation, the cells were processed for fluorescence in situ hybridization (FISH) chromosome painting with FITC-conjugated probes complimentary to mouse x-chromosome (Vysis, Downers Grove, IL). After removal of the coverslips, the cells were immersed in 95% ethanol:5% acetic acid for 15 min. (this is a required step of the FISH protocol that inadvertently abolishes the existing fluorescent labels). The cells were then washed 3× in PBS, and air dried at room temperature (RT) overnight. Next, cells were incubated for 15 min. in a 3:1 mixture of methanol:acetic acid, dehydrated in 100% ethanol for 2 min., and digested with pepsin (1mg/ml in 0.01N HCL). Finally, cells were immersed in formaldehyde (1% in PBS), dehydrated through graded alcohols, and hybridized overnight with chromosome paint (5 min. at 74°C, followed by 16+ hours at 37°C). After hybridization, cells were washed first in 1:1 formamide:2×SSC, then in 2×SSC before being re-coverslipped in mountant containing DAPI (Vector, Burlingame, CA). Chromosome-painted cells corresponding to previously photodocumented asterons were identified and photographed. It should be noted that the stringency of the FISH protocol causes the loss of some cells, and slight distortion (i.e. shrinkage) of the remaining cells, rendering re-identification of individual cells difficult.
Electrophysiology
Spheres plated for 48-96 hours were used to assess membrane properties of asterons. Coverslips were placed in a recording chamber perfused with artificial cerebrospinal fluid (ACSF) containing (in mM) 124 NaCl, 26 NaHCO2, 1.25 NaH2PO4, 2.5 KCl, 2 CaCl2, 1 MgCl2, 20 D-glucose, oxygenated with 95% O2 and 5% CO2, giving a pH of 7.4. All recordings were performed at room temperature (22°C). Putative neurons, astrocytes, and asterons were visually identified using infrared DIC videomicroscopy with a fixed-stage microscope equipped with a 40×, 0.8 W water-immersion lens (Zeiss, Oberkochen, Germany), and whole-cell patch-clamp recordings were performed. Patch electrodes had a resistance of 6-8 MΩ when filled with intracellular solution containing (in mM): 120 K-gluconate, 8 NaCl, 10 HEPES, 4 Mg ATP, 0.3 Na3GTP, 0.2 EGTA, 0.1% biocytin (pH 7.3 with KOH, osmolarity 290-300 mOsm). Cells were recorded under either current-clamp or voltage-clamp mode using an Axopatch 1D amplifier (Axon Instruments, Foster City, CA). Series resistance was 10-25 MΩ and cells were rejected if resistance changed more than 10% throughout the recording session. Action potentials were observed in current-clamp mode by injecting a number of current steps (from -50 pA to 150 pA, in 50pA increments). Na+ and K+ currents were studied in voltage-clamp mode. Cells were held at -65 mV, and steps of voltage were imposed (from -80mV to 55mV, with 15 mV increments). Maximum Na+ current usually occurred when cells were held at -5 mV or 10 mV. The magnitude of K+ current was measured at the steady part of the trace of the last step (55mV). Action potentials and Na-currents were abolished by adding 1μM TTX (Sigma).
Recorded cells were filled with biocytin, and visualized by application of an avidin-AMCA conjugate (Vector). Cell phenotypes were confirmed by immunolabeling the biocytin-filled cells with antibodies against GFAP and β-III tubulin, as above.
Results
Neurosphere Differentiation and Expression of Hybrid “Asteron” Phenotype
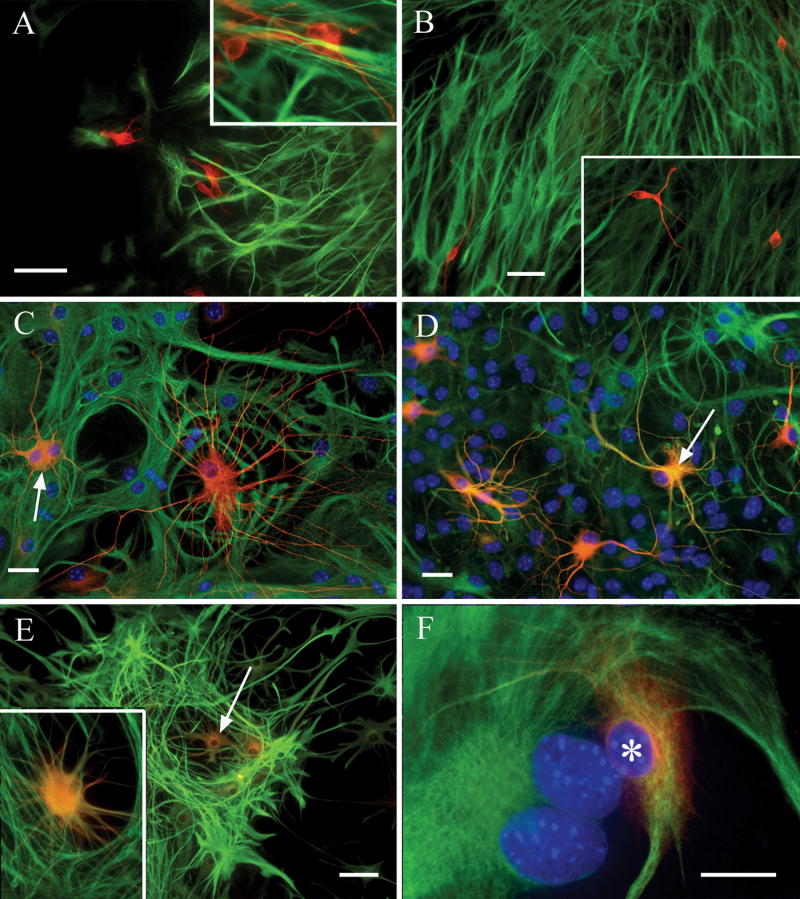
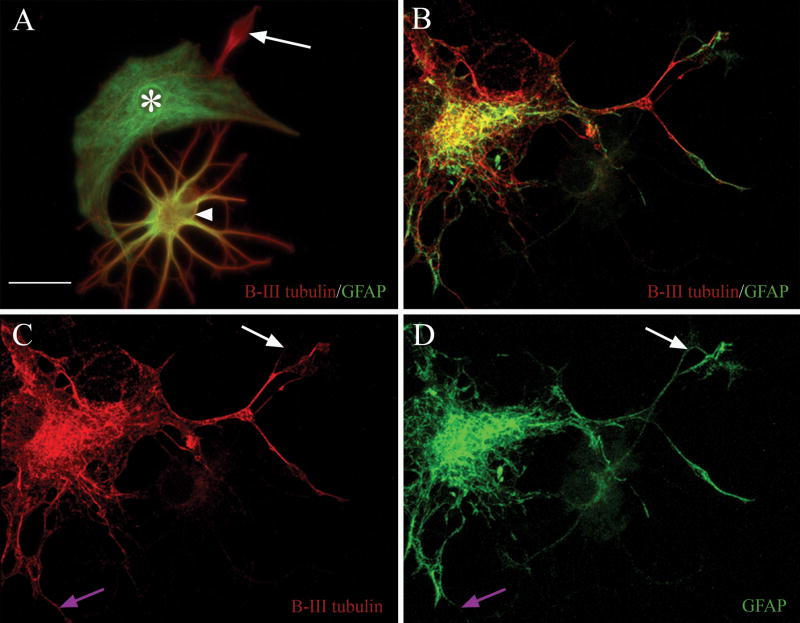
Shortly after the initiation of sphere differentiation by plating onto adhesive substrata, combined β-III tubulin/GFAP immunolabeling reveals non-overlapping neuron/astrocyte mixtures (Fig. 1A & B), in which no individual cells are seen co-expressing these markers. During the first day post-plating, “immature” neurons are apparent as small, rounded cells with relatively short processes (Fig. 1A & inset). Over the next 1-2 days, the neuronal phenotype begins to “mature” as they start to show a more fusiform soma in combination with longer, branching processes (Fig. 1B & inset). Shortly after this stage, exclusively β-III tubulin+ neurons can be seen combining fine neuronal-like processes with wide, flattened cell bodies characteristic of astrocytes (see Fig. 1C). By 5-6 days post-plating, there are few cells left that exclusively express β-III tubulin, while the number of co-expressing asterons reaches its maximum level (Fig. 1D). Asterons continue to display flatter, more stellate morphologies (see Fig. 1E), and in the second post-plating week show a wide, flat, “fibroblastic” morphology typical of cultured astrocytes (see Fig. 1F). During this transition period of neuronal decline and asteron increase, cells with all three phenotypes (neuron, astrocyte, and asteron) can often be seen in a single, high magnification field of view (Fig. 2A), arguing against the interpretation that the asteron phenotype results simply from antibody cross-reactivity. Likewise, confocal microscopy of individual asterons reveals that antibodies for neuronal and glial markers are co-localized within the same cell, and it appears that these markers label separate populations of subcellular elements within the same cell (Fig. 2B-D), suggesting that the asteron phenotype is not the result of antibody cross-reactivity or epifluorescence bleed-through. Combinations of monoclonal anti-β-III tubulin + polyclonal anti-GFAP, and polyclonal anti-β-III tubulin + monoclonal anti-GFAP co-label hybrid asteron cells equivalently (data not shown).
Figure 1. Combined β-III tubulin and GFAP immunolabeling reveals the temporal progression of the asteron phenotype.
Shortly after initiation of differentiation (A), spheres contain non-overlapping populations of cells immunopositive for either β-III tubulin (red), or GFAP (green). No cells co-expressing both markers are seen (inset in A shows higher magnification of non-overlapping neuron/astrocyte labels). Note also the relatively short, poorly branched neuronal processes at this early time point. By twenty-four hours post-plating (B), spheres still contain cells with mutually exclusive β-III tubulin (red)/GFAP (green) labeling patterns, but neuronal morphology is more mature, showing longer processes with greater branching (inset in B). Two days after plating (C), phenotypic heterogeneity is increased, with some cells co-labeling with both neuron (red) and astrocyte (green) markers (arrow points to a co-expressing “yellow” cell). Additionally, cells immunolabeled exclusively with β-III tubulin can be seen displaying “hybrid” morphologies that combine fine, highly branched processes with wide, flat somas (i.e. the large red cell in C). At three days post-plating (D), few cells exclusively express β-III tubulin, and the number of co-expressing asterons increases (e.g. arrow). Asterons at this stage also begin to acquire more “astrocytic” morphologies, with thicker processes and less rounded somas. At five days (E) neurons are scarce and co-expressing asterons (e.g. arrow) display astrocytic morphologies. Inset in (E) shows a higher magnification of an asteron at this stage. By six days (F) co-expressing cells show a wide, flat, fibroblast-like morphology typical of cultured astrocytes (asterisk). Blue in panels C,D,F is Hoechst 33342 nuclear counterstain. Scale bar = 50 uM in (A), 25 uM in (B), and 20 uM in (C&D).
Figure 2. Antibodies against β-III tubulin and GFAP reveal three immunophenotypes, and label separate sub-cellular elements within asterons.
In (A) β-III tubulin+ neurons (red, arrow), GFAP+ astrocytes (green, asterisk), and co-expressing asterons (arrowhead) can be seen in close proximity with no evidence of antibody cross-reactivity in either the exclusively red or green cells. Confocal microscopy (B-D) shows the co-localization of both immunomarkers in a single z-axis of an asteron. Notice that the red and green chromagens often label separate intracellular structures. Some areas labeled with green are unlabeled with red (compare white arrows in C & D), and vice versa (compare purple arrows in C & D). Scale bar = 20 uM in all panels.
Other Asteron Markers
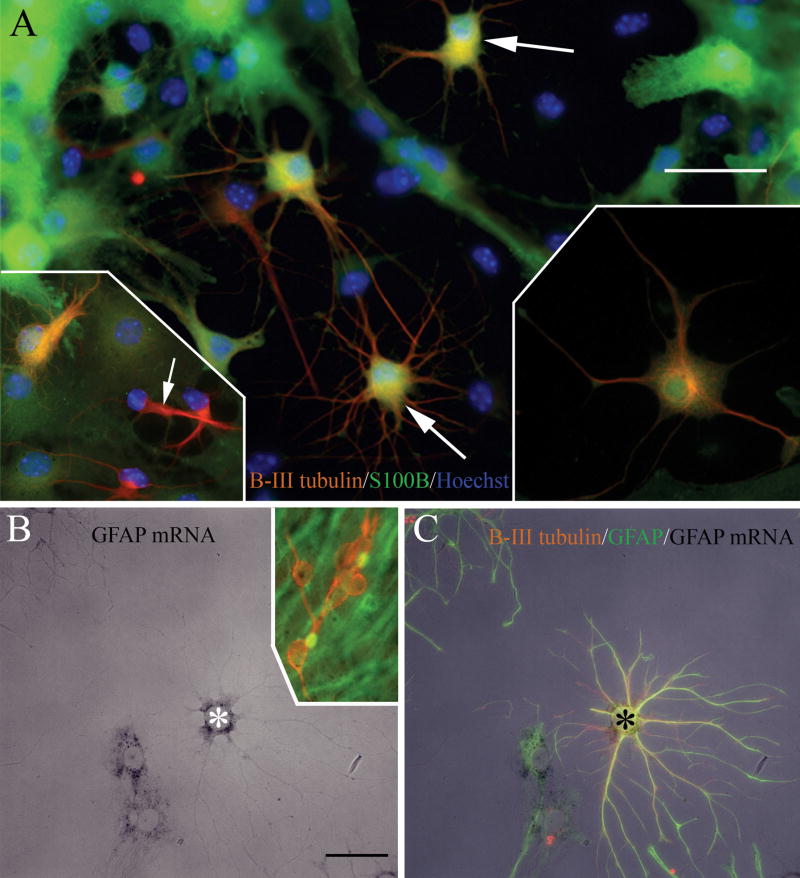
In addition to β-III tubulin and GFAP, asterons also co-label with a combination of monoclonal anti-β-III tubulin and polyclonal anti-S100β. Again, some but not all β-III tubulin+ cells are also immunopositive for S100β (Fig. 3A & insets). Likewise, asterons are immunolabeled with antibodies against GFAP and the neuronal protein, MAP2 (data not shown). However, when we combine polyclonal anti-GFAP with monoclonal anti-NeuN, a protein thought to be restricted to fully mature neurons, we never observe cells expressing both markers (25 spheres examined), even though it is clear from positive controls that both antibodies are present at optimal concentrations for immunolabeling (data not shown). Finally, combining GFAP cDNA in situ hybridization with β-III tubulin and GFAP immunolabeling shows that cells transcribing astrocyte-associated mRNA are immunopositive for both glia- and neuron-associated cytoskeletal proteins (Fig 3B & C).
Figure 3. Asterons co-express β-III tubulin with S100β, and transcribe GFAP mRNA.
Two days after plating, some cells (e.g. arrows) are co-labeled with both the astrocyte calcium-binding protein S100β (green), and β-III tubulin (red) (A). Not all β-III tubulin+ cells are also S100β+ (lower left inset in A: arrow indicates a cell exclusively expressing β-III tubulin), indicating that the staining pattern does not result from antibody cross-reactivity. Lower right inset in (A) shows higher magnification of a double-labeled asteron. (B&C). Some cells that hybridze GFAP cDNA (asterisk in B) also immunolabel for GFAP and β-III tubulin (asterisk in C). Inset in (B) shows that β-III tubulin+ neurons (red) do not hybridize GFAP cDNA. Scale bar = 40 uM.
Analysis of Cell Death
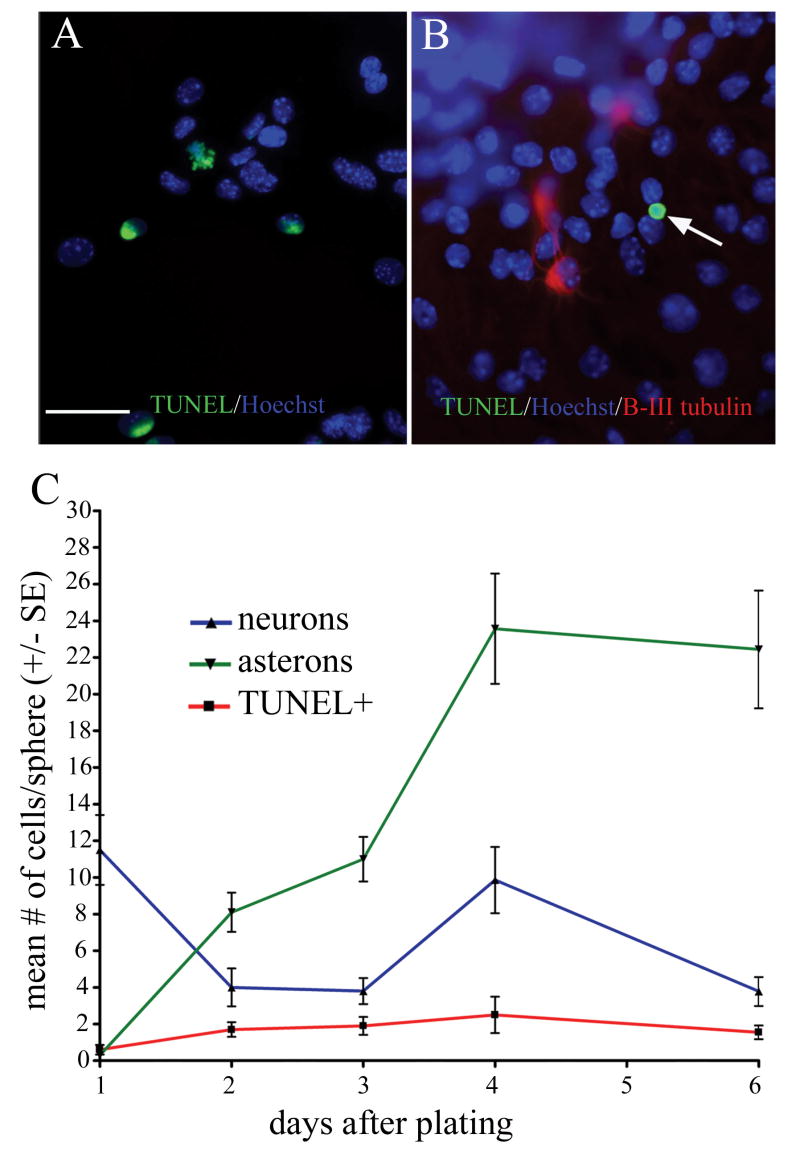
Neurons (i.e. cells exclusively expressing neuronal phenotype markers) become apparent immediately after spheres attach to substrate and begin differentiation, then decrease in number until, after approximately two weeks, they are no longer detectable. The observed decrease in neuron number is paralleled by an increase in asteron cells co-expressing neuronal and glial phenotype markers, and it is this inverse relationship that originally led us to hypothesize that neurons in these cultures undergo a phenotypic transformation into hybrid neuron/astrocytic cells. A partial alternative to this hypothesis, though, is that the reduction in neuronal cells is due simply to cell death. In order to determine if cell death plays a significant role in neuronal reduction, we used two methods to analyze apoptosis in cerebellar-derived spheres: TUNEL and caspase 3 immunolabeling. We focused our apoptosis analysis on the six days immediately after sphere plating, since this time window corresponds to the vast majority of neuron/asteron inversion. At all time points assessed only a small number of sphere-derived cells are TUNEL+ (Fig. 4B, compare to +control in 4A) and, of these, only 14% are immunopositive for β-III tubulin (data not shown). Quantification of sphere composition (including both the penumbral and the central sphere mass) with respect to neurons, astrocytes, and TUNEL+ cells (Fig. 4C) shows that even if all of the TUNEL+ cells represented dying neurons, it could not account for the dramatic reduction in neuron number during the first few days after plating. The TUNEL analysis is mirrored very closely by immunodetection of the early apoptosis marker, activated caspase 3; again, only a small number of sphere cells at all time points analyzed are caspase+, and only a fraction of these cells (6% of all caspase+ cells, data not shown) are immunopositive for β-III tubulin.
Figure 4. Asteron appearance corresponds with neuronal reduction that is not attributable to apoptotic cell loss.
TUNEL reveals apoptotic cells in control DNAse-treated sphere (green label in A). In untreated sphere cells plated for three days (B), TUNEL reveals a single dying cell (arrow) that is negative for β-III tubulin immunostaining (red). Graph in (C) shows the temporal relationship among neurons, asterons, and apoptotic cells. As neurons (blue line) decrease, there is a corresponding increase in asterons (green line). TUNEL (red line) shows that there is a steady rate of 1-3 apoptotic cells per sphere during the first week after plating. Scale bar = 40 uM.
Incorporation of BrdU by Asterons
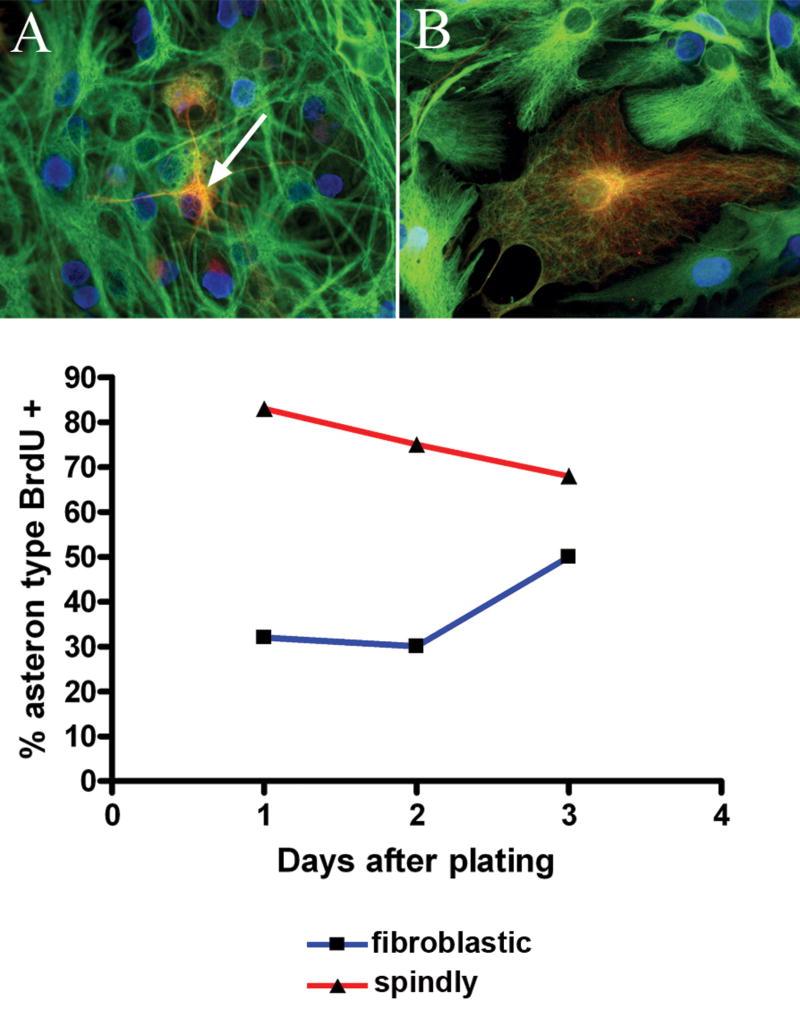
Spheres were differentiated for five days in the presence of 10μM BrdU to determine if asterons are capable of dividing. Some, but not all, asterons are seen to have incorporated BrdU after two days of differentiation (Fig. 5). Upon closer examination, it became apparent that the asterons most likely to show BrdU incorporation are those with a spindly morphology characterized by thin, branched processes. Conversely, the asterons least likely to have incorporated BrdU are those with a flat, wide, fibroblast-like morphology (compare asterons in Fig. 5A & B). To quantify this observation, twenty triple-labeled (GFAP/ β-III tubulin/BrdU) fibroblastic and spindly asterons were prospectively identified by combined GFAP/β-III tubulin immunolabeling at 2, 3, and 5 days after sphere differentiation. After assigning the asteron morphotype, the cells were examined for BrdU incorporation. It was found that spindly asterons are much more likely to be BrdU+ than fibroblastic asterons at all time points examined, but that the percentage of spindly astrocytes positive for BrdU decreases from 2 to 5 days, while the percentage of BrdU+ fibroblastic asterons increases over this period, suggesting that spindly asterons transition into fibroblastic asterons over time (Fig. 5C). The fact that asterons can proliferate offers at least a partial explanation for the finding that the number of asterons present in spheres after 5 days of differentiation exceeds the starting number of neurons.
Figure 5. Differential rate of BrdU incorporation correlates with asteron morphotype.
Some, but not all, asterons incorporate BrdU (blue) when this thymidine analog is present at the beginning of sphere differentiation. Asterons with spindly morphologies (A; arrow points to a BrdU+ asteron) are more likely to show BrdU incorporation than asterons with fibroblastic morphologies (B). The histogram (C) shows that the percentage of spindly asterons expressing BrdU (red line) decreases over the first five days of differentiation, while the percentage of BrdU+ fibroblastic asterons (blue line) increases over the same period, perhaps indicating a transition of spindly asterons into fibroblastic asterons.
Analysis of Fusion with Chromosome Paint
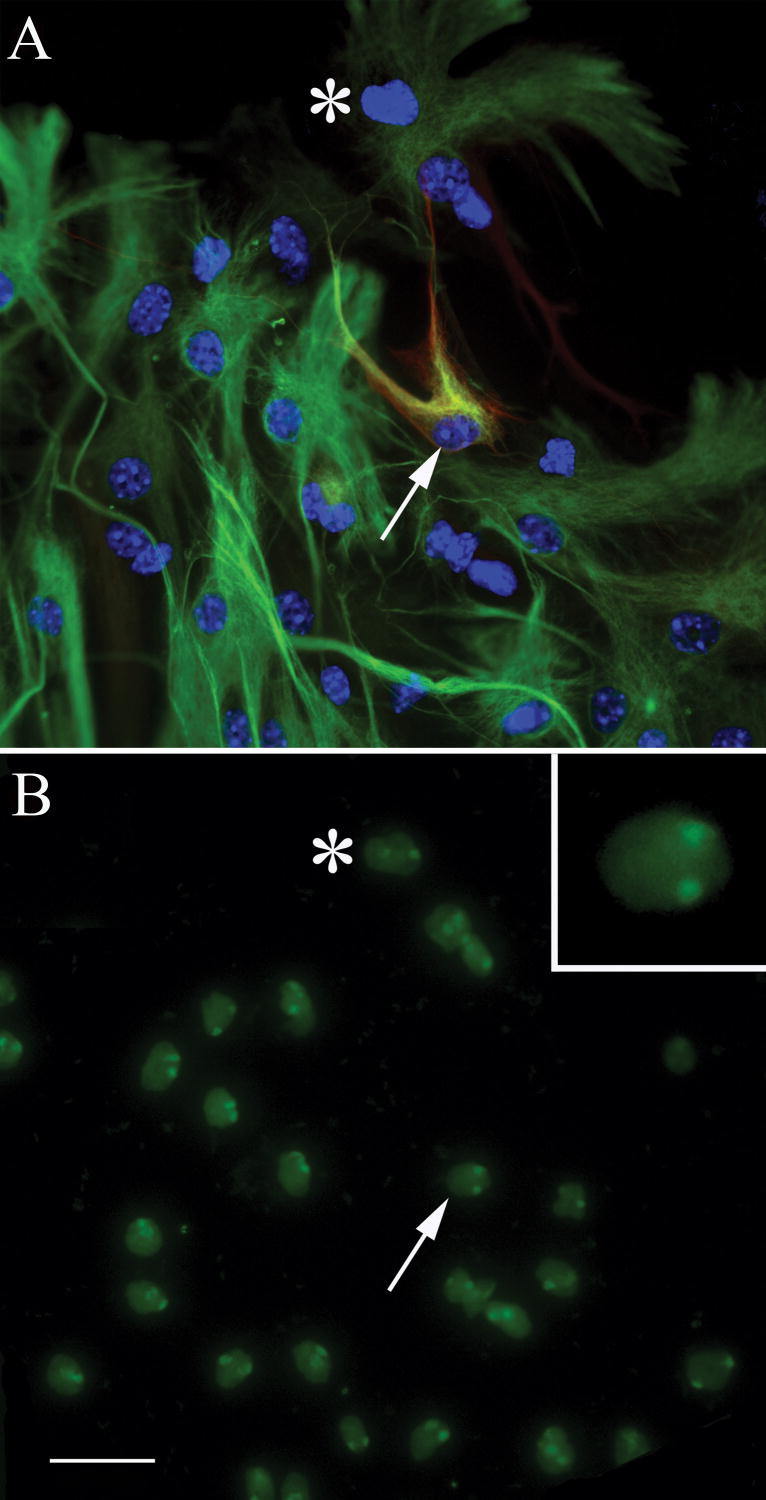
In order to investigate the possibility that asterons arise as a consequence of fusion between neurons and astrocytes, we performed ploidy analysis of asterons using FISH with chromosome paint. Two to four days after plating, twenty-eight cells from female-derived spheres were prospectively identified as asterons by β-III tubulin/GFAP/Hoechst 33342 immunolabeling (Fig. 6A). Fourteen of these cells were re-identified after FISH with mouse x-chromosome paint. Of these, 4 did not display detectable levels of fluorescent label, leaving 10 known asterons with chromosome paint. Seven of these ten are clearly diploid as demonstrated by the presence of two discrete fluorescent loci within the nucleus (Fig. 6B & inset). The remaining three cells give an indeterminate labeling pattern (i.e., a single, enlarged fluorescent locus within the nucleus), though none are clearly polyploid (data not shown). Confocal analysis was not performed on the three indeterminant cells, but it is likely that the apparent single locus results from two overlapping x-chromosome labels.
Figure 6. Chromosome painting reveals that asterons are diploid.
Asterons from female mouse cerebellar spheres, defined by co-expression of β-III tubulin and GFAP (red & green, respectively in A), are shown to be diploid when hybridized with probes specific for mouse x-chromosome (green in B). The same general field is shown before (A) and after (B) FISH chromosome painting. Asterisk is added for reference. The asteron indicated by the arrow in (A) can be seen to have two x-chromosomes in (B). Inset in (B) shows a higher magnification of this cell. Scale bar= 25 uM.
Physiological properties of hybrid asterons
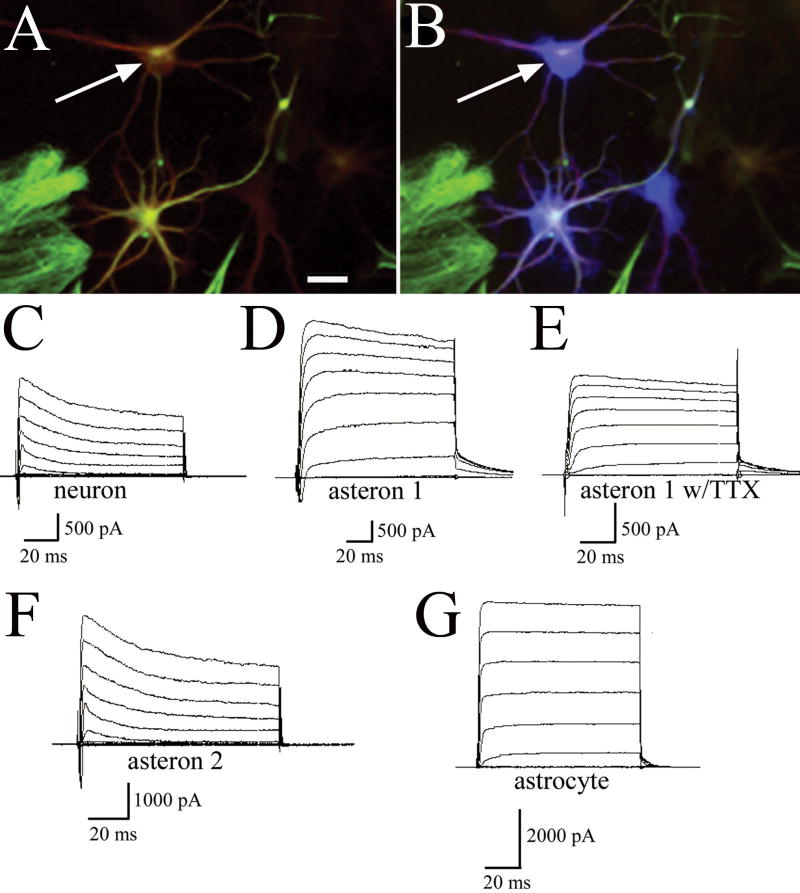
Electrophysiological recording of 20 candidate neurons, astrocytes, and asterons reveals that retrospectively identified asterons (Fig. 7A&B) have a varied electrophysiological profile. Clearly-identified neurons show both K+ and Na+ channels, a depolarizing spike, and resting membrane potentials of -70 mV or lower (Fig 7C), whereas astrocytes show large K+ channels, small (or no) Na+ channels, no depolarizing spike, and resting membrane potentials usually greater than -70 mV (Fig. 7G). Asterons show wide variability in resting membrane potential (-52 to -78 mV), but consistently display K+ currents with relative amplitudes that place them between the amplitudes seen for neuronal and astrocytic K+ currents. We found examples of asterons that display physiological profiles that resemble astrocytes (Fig. 7F; compare to 7G), though with lower amplitude K+ current. In addition, one confirmed asteron showed intermediate amplitude K+ channels, neuron-like Na+ channels, and a Na+ spike that could be abolished by the administration of TTX (Fig. 7D&E). The relative amplitude of the K+ current among the different cell types, combined with the presence or absence of significant Na+ channels suggests that as cells transition into asterons from neurons, they begin to turn off Na+ channel expression and upregulate K+ channel amplitude.
Figure 7. Physiology of neurons, astrocytes, and asterons.
Retrospectively identified asterons (A) immunolabeled for β-III tubulin (red) and GFAP (green) were voltage clamped and filled with biocytin (blue) (arrow indicates same cell in A and B). Voltage- clamp recordings demonstrate the Na+ and K+ current profiles of a typical neuron (C). An asteron possessing Na+ and K+ currents is shown in (D). The Na+ current of this cell was abolished by exposure to TTX (E). Another example of an asteron shows no Na+ current, and a more astrocytic K+ current (F). A trace from a typical astrocyte (G) shows a large amplitude K+ current with no Na+ current. Scale bar= 20 uM.
Discussion
Under our culture conditions, neurospheres derived from SEZ and cerebellum give rise initially to separate populations of neurons and astrocytes; however, there subsequently appears a population of cells –which we call asterons- that share the morphological, antigenic, and physiological profile of both neurons and astrocytes, and whose appearance is coterminous with the disappearance of cells exhibiting exclusive neuronal phenotype. We believe that the most parsimonious interpretation of this inverse neuron/asteron relationship –combined with the supporting evidence presented- is that asterons represent the phenotypic shift of neurons into astrocytic cells. Such “phenotypic fluidity” may represent a dynamic continuum of cellular differentiation wherein cells pass through transitional stages which, in some instances, defy easy categorization into definitive glial or neuronal fates, and where ultimate commitment hangs in the balance (Steindler and Laywell, 2003). In light of previous findings showing that certain populations of astrocytes possess neural stem cell attributes and can generate neurons (Laywell et al., 2000), the phenotypic fluidity presented here may represent a reversal of the normal developmental sequence.
Antibody labeling is merely the first step in establishing the existence of a hybrid cell, and an obvious concern is that our observations result from antibody cross-reactivity; however, we believe our double-immunolabeling data is strong, particularly since we initially see two distinct (neuron or astrocyte) populations of cells, and only later see overlap within the same cell. Furthermore, asterons co-label with both mono- or poly-clonal β-III tubulin, and mono- or poly-clonal GFAP antibody combinations. It might be, though, that antibody non-specificity increases with extended time in vitro. Such an explanation seems unlikely, however, since it is possible to capture neurons, astrocytes, and asterons in close proximity within the same sphere. Additionally, for non-specific labeling to account for our data it would need also to occur with combinations of anti-MAP2/anti-GFAP and anti-β-III tubulin/anti-S100β antibodies. The fact that we fail to observe co-localization of GFAP and NeuN may indicate that neurons stop expressing this mature neuronal marker -and possibly other nuclear and cytoplasmic proteins, reflecting dynamic transcription/translation events- as they begin to display a hybrid phenotype. Alternatively, co-expression of NeuN with glial markers may occur only briefly, and we have simply failed to capture it.
Our TUNEL and caspase 3 results suggest that there is insignificant neuronal cell death occurring during the time that the majority of neuron/asteron inversion takes place (see Fig. 4). Even if all, rather than -as is the case- a small fraction of the TUNEL+ and caspase3+ cells represent dying neurons, this number is too small to account for the dramatic reduction in neurons that occurs concomitantly with an equally dramatic increase in asterons. One interesting aspect of the neuron/asteron/apoptosis quantification is that the maximum number of asterons (i.e. day 4) exceeds the maximum number of neurons (i.e. day 1). This datum suggests that there is not a 1:1 relationship between starting neuron number and final asteron number, a fact that could be accounted for if asterons maintain their hybrid phenotype while proliferating. Analysis of sphere differentiation in the presence of BrdU indicates that asterons are capable of undergoing proliferation while maintaining the hybrid phenotype, although cell division is not required for the expression of this phenotype since there are numerous examples of BrdU negative asterons that had differentiated in the continual presence of the thymidine analog. An interesting serendipitous finding resulting from the BrdU analysis is the differential proliferation kinetics of asterons that corresponds to two different morphologies. When asterons are prospectively classified based on gross morphological characteristics into either “spindly” –having relatively fine, radiating processes- or “fibroblastic” –displaying a wide, flattened shape with few processes- it becomes apparent that a greater percentage of spindly asterons incorporate BrdU early during differentiation. This disparity decreases over time, however, and the percentage of BrdU+ spindly and fibroblastic asterons begins to converge at later timepoints. While the cell-cycle kinetics of asterons warrants a separate set of future studies, the pattern of proliferation revealed by this brief analysis fits intuitively with our model of neuron-to-astrocyte transition, in which fusiform –or spindly- neuronal cells gradually acquire a fibroblastic astrocyte morphology. Alternatively, we cannot rule out the possibility that astrocytes within these cultures might undergo a reverse transition by acquiring certain properties of neuronal phenotypes, and this would also offer a partially explanation for why asteron number exceeds the initial number of neuron within the differentiating spheres.
Another confounding factor that could account for our results is that asterons arise from fusion between neurons and astrocytes. Recent studies have shown that bone marrow cells (Terada et al., 2002) and neural progenitors (Ying et al., 2002) can fuse with embryonic stem cells in vitro, and appear to transdifferentiate; furthermore, there are reports that fusion can occur in vivo in liver (Vassilopoulos et al., 2003; Wang et al., 2003) and brain (Alvarez-Dolado et al., 2003; Weimann et al., 2003) after bone marrow reconstitution. We think it unlikely that fusion causes the asteron phenotype for three reasons: first, we rarely see multinucleated cells that one would expect to result from cellular fusion; second, if fusion were occurring between astrocytes and neurons, we would expect to see instances of cells co-expressing NeuN and GFAP, rather than this combination of antibodies being the only one we used not to co-localize; finally, our FISH analysis with sex-specific chromosome paint, which we have previously used to rule out fusion events in human brain sections (Cogle et al., 2004), reveals many instances of diploid asterons, with no evidence of polyploidy that one would expect if nuclear fusion had occurred.
Finally, to examine if the asteron phenotype has a functional correlate, we employed patch-clamp recording to determine if asterons display a “hybrid” membrane physiology. It was previously shown that some GFAP+ cells derived from human embryonic CNS stem cells can exhibit spontaneous neuronal firing patterns in vitro (Gritti et al., 2000), and a GluR-expressing astrocyte in the hippocampus has been described that may represent an intermediate cell type -referred to as an “astron”- that possesses glial properties, but may have begun to express neuronal genes (Matthias et al., 2003). We show that, in contrast to the physiological profiles obtained for neurons and astrocytes, there is large variability in membrane physiology of asterons, which makes it difficult to assign them a conclusive electrophysiological profile. We observed individual asterons with neuron-like, astrocyte-like, and apparently hybrid membrane properties, indicating that there are numerous intermediate functional stages between neurons and astrocytes that will require extensive study beyond the scope of the present report to elucidate. Nevertheless, from our significant sample of recorded cells we identify some general trends. Assuming that the asteron represents a transitional state from neuron to astrocytic cell, our data show that asterons tend to lose Na+ currents and spike generation, increase K+ current amplitude, and decrease resting membrane potential.
In summary, neurons in differentiating neurospheres from both SEZ and cerebellum of neonatal mice undergo a phenotypic shift into astrocytes by transitioning through a hybrid cell that possesses characteristics of both neurons and astrocytes. The idea that neural cells can possess hybrid characteristics is not new, as Ramon y Cajal (Ramon y Cajal, 1911) described “neurogliform” or “dwarf neurons” in the striatum that defy easy characterization, though consensus seems to be that they are neuronal (Dimova et al., 1980; Sancesario et al., 1998). Recently, there have been a number of interesting reports of phenotypically confusing cells. Milosevic & Goldman (Milosevic and Goldman, 2002) have demonstrated the presence of a “hybrid” astrocyte/oligodendrocyte cell in cultures of neonatal rat cerebellum, and exposure to sonic hedgehog and bone morphogenetic proteins have been shown to induce a similar neuron/astrocyte “hybrid” phenotype in dissociated cerebellar granule neurons (Okano-Uchida et al., 2004). The chick retina, too, has been shown to contain a hybrid cell –the peripapillary glial cell- that expresses antigens associated with radial glia, neurons, astrocytes, and oligodendrocytes (Quesada et al., 2004). Finally, neuronal and glial intermediate filament protein expression has been characterized in medulloblastoma (Wetmore et al., 2000), and the in vitro conditions used here may recapitulate conditions for generating intermediate cell forms and phenotypic fluidity as may also be seen during the genesis of these and other aggressive tumors (Ignatova et al., 2002; Hemmati et al., 2003; Singh et al., 2004).
It is strictly conjecture at this point to suggest mechanisms of asteron formation in vitro, and to relate this to cellular differentiation that might occur in vivo. It is interesting, though, that in grafts of most neural stem/progenitor cells in the injured brain and spinal cord (Cao et al., 2001) donor cells generally differentiate only into glia after different lesions and post-graft survival times. In light of the asteron lineage presented here being associated with the generation of astrocytes from neurons -and the reverse (i.e. the clonogenic multipotent astrocytic stem cell (Laywell et al., 2000)- the conversion of neurons to astrocytes where the growth factor milieu most likely underlies this fate switch may also actually mirror the lack of the required neuronogenic growth factors present in brain wounds that might lead to the support only of astrocytic differentiation. The genetic and molecular switching that must underlie asteron formation, and speculation about the subcellular mechanisms of this transformation, including the switching of cytoskeletal proteins and reprogramming of the nucleus, are topics for future investigation. Since diversity of cellular phenotype is one of the hallmarks of both the gliomas and developmental CNS histogenesis, the presence of intermediate phenotypes in an apparent de-differentiation cascade may indicate a level of plasticity that might yield inducible differentiation approaches to selectively generate and expand distinct populations of neural precursors, as well as differentiated neurons and glia for bioassays and transplantation.
Acknowledgments
Supported by NIH grants NS37556 (DAS) and NS041472 (EDL).
References
- Altman J, Das GD. Autoradiographic and histological evidence of postnatal hippocampal neurogenesis in rats. J Comparative Neurology. 1965;124:319–336. doi: 10.1002/cne.901240303. [DOI] [PubMed] [Google Scholar]
- Alvarez-Dolado M, Pardal R, Garcia-Verdugo JM, Fike JR, Lee HO, Pfeffer K, Lois C, Morrison SJ, Alvarez-Buylla A. Fusion of bone-marrow-derived cells with Purkinje neurons, cardiomyocytes and hepatocytes. Nature. 2003;425:968–973. doi: 10.1038/nature02069. [DOI] [PubMed] [Google Scholar]
- Braissant O, Wahli W. Differential expression of peroxisome proliferator-activated receptor-alpha, -beta, and -gamma during rat embryonic development. Endocrinology. 1998;139:2748–2754. doi: 10.1210/endo.139.6.6049. [DOI] [PubMed] [Google Scholar]
- Cao QL, Zhang YP, Howard RM, Walters WM, Tsoulfas P, Whittemore SR. Pluripotent stem cells engrafted into the normal or lesioned adult rat spinal cord are restricted to a glial lineage. Exp Neurol. 2001;167:48–58. doi: 10.1006/exnr.2000.7536. [DOI] [PubMed] [Google Scholar]
- Cogle CR, Yachnis AT, Laywell ED, Zander DS, Wingard JR, Steindler DA, Scott EW. Bone marrow transdifferentiation in brain after transplantation: a retrospective study. Lancet. 2004;363:1432–1437. doi: 10.1016/S0140-6736(04)16102-3. [DOI] [PubMed] [Google Scholar]
- Dimova R, Vuillet J, Seite R. Study of the rat neostriatum using a combined golgi-electron microscope technique and serial sections. Neuroscience. 1980;5:1581–1596. doi: 10.1016/0306-4522(80)90022-6. [DOI] [PubMed] [Google Scholar]
- Doetsch F, Caille I, Lim DA, Garcia-Verdugo JM, Alvarez-Buylla A. Subventricular zone astrocytes are neural stem cells in the adult mammalian brain. Cell. 1999;97:703–716. doi: 10.1016/s0092-8674(00)80783-7. [DOI] [PubMed] [Google Scholar]
- Gritti A, Rosati B, Lecchi M, Vescovi AL, Wanke E. Excitable properties in astrocytes derived from human embryonic CNS stem cells. Eur J Neurosci. 2000;12:3549–3559. doi: 10.1046/j.1460-9568.2000.00234.x. [DOI] [PubMed] [Google Scholar]
- Hemmati HD, Nakano I, Lazareff JA, Masterman-Smith M, Geschwind DH, Bronner-Fraser M, Kornblum HI. Cancerous stem cells can arise from pediatric brain tumors. Proc Natl Acad Sci U S A. 2003;100:15178–15183. doi: 10.1073/pnas.2036535100. [DOI] [PMC free article] [PubMed] [Google Scholar]
- Ignatova TN, Kukekov VG, Laywell ED, Suslov ON, Vrionis FD, Steindler DA. Human cortical glial tumors contain neural stem-like cells expressing astroglial and neuronal markers in vitro. Glia. 2002;39:193–206. doi: 10.1002/glia.10094. [DOI] [PubMed] [Google Scholar]
- Kaplan MS, Hinds JW. Neurogenesis in the adult rat: electron microscopic analysis of light radioautographs. Science. 1977;197:1092–1094. doi: 10.1126/science.887941. [DOI] [PubMed] [Google Scholar]
- Kondo T, Raff M. Oligodendrocyte precursor cells reprogrammed to become multipotential CNS stem cells. Science. 2000;289:1754–1757. doi: 10.1126/science.289.5485.1754. [DOI] [PubMed] [Google Scholar]
- Kukekov VG, Laywell ED, Suslov O, Davies K, Scheffler B, Thomas LB, O'Brien TF, Kusakabe M, Steindler DA. Multipotent stem/progenitor cells with similar properties arise from two neurogenic regions of adult human brain. Exp Neurol. 1999;156:333–344. doi: 10.1006/exnr.1999.7028. [DOI] [PubMed] [Google Scholar]
- Laywell ED, Kukekov VG, Suslov O, Zheng T, Steindler DA. Production and analysis of neurospheres from acutely dissociated and postmortem CNS specimens. Methods Mol Biol. 2002;198:15–27. doi: 10.1385/1-59259-186-8:015. [DOI] [PubMed] [Google Scholar]
- Laywell ED, Rakic P, Kukekov VG, Holland EC, Steindler DA. Identification of a multipotent astrocytic stem cell in the immature and adult mouse brain. Proc Natl Acad Sci U S A. 2000;97:13883–13888. doi: 10.1073/pnas.250471697. [DOI] [PMC free article] [PubMed] [Google Scholar]
- Matthias K, Kirchhoff F, Seifert G, Huttmann K, Matyash M, Kettenmann H, Steinhauser C. Segregated expression of AMPA-type glutamate receptors and glutamate transporters defines distinct astrocyte populations in the mouse hippocampus. J Neurosci. 2003;23:1750–1758. doi: 10.1523/JNEUROSCI.23-05-01750.2003. [DOI] [PMC free article] [PubMed] [Google Scholar]
- Milosevic A, Goldman JE. Progenitors in the postnatal cerebellar white matter are antigenically heterogeneous. J Comp Neurol. 2002;452:192–203. doi: 10.1002/cne.10384. [DOI] [PubMed] [Google Scholar]
- Okano-Uchida T, Himi T, Komiya Y, Ishizaki Y. Cerebellar granule cell precursors can differentiate into astroglial cells. Proc Natl Acad Sci U S A. 2004;101:1211–1216. doi: 10.1073/pnas.0307972100. [DOI] [PMC free article] [PubMed] [Google Scholar]
- Quesada A, Prada FA, Aguilera Y, Espinar A, Carmona A, Prada C. Peripapillary glial cells in the chick retina: A special glial cell type expressing astrocyte, radial glia, neuron, and oligodendrocyte markers throughout development. Glia. 2004;46:346–355. doi: 10.1002/glia.10351. [DOI] [PubMed] [Google Scholar]
- Ramon y Cajal S. Histologie du système nerveux de l'hommes et des vertébrés 1911 [Google Scholar]
- Reynolds BA, Weiss S. Generation of neurons and astrocytes from isolated cells of the adult mammalian central nervous system. Science. 1992;255:1707–1710. doi: 10.1126/science.1553558. [DOI] [PubMed] [Google Scholar]
- Sancesario G, Pisani A, D'Angelo V, Calabresi P, Bernardi G. Morphological and functional study of dwarf neurons in the rat striatum. Eur J Neurosci. 1998;10:3575–3583. doi: 10.1046/j.1460-9568.1998.00374.x. [DOI] [PubMed] [Google Scholar]
- Seri B, Garcia-Verdugo JM, McEwen BS, Alvarez-Buylla A. Astrocytes give rise to new neurons in the adult mammalian hippocampus. J Neurosci. 2001;21:7153–7160. doi: 10.1523/JNEUROSCI.21-18-07153.2001. [DOI] [PMC free article] [PubMed] [Google Scholar]
- Singh SK, Hawkins C, Clarke ID, Squire JA, Bayani J, Hide T, Henkelman RM, Cusimano MD, Dirks PB. Identification of human brain tumour initiating cells. Nature. 2004;432:396–401. doi: 10.1038/nature03128. [DOI] [PubMed] [Google Scholar]
- Smart I. The subependymal layer of the mouse brain and its cell production as shown by radioautography after thymidine-H3. J Comp Neurol. 1961;116:325–349. [Google Scholar]
- Steindler DA, Laywell ED. Astrocytes as stem cells: nomenclature, phenotype, and translation. Glia. 2003;43:62–69. doi: 10.1002/glia.10242. [DOI] [PubMed] [Google Scholar]
- Terada N, Hamazaki T, Oka M, Hoki M, Mastalerz DM, Nakano Y, Meyer EM, Morel L, Petersen BE, Scott EW. Bone marrow cells adopt the phenotype of other cells by spontaneous cell fusion. Nature. 2002;416:542–545. doi: 10.1038/nature730. [DOI] [PubMed] [Google Scholar]
- Vassilopoulos G, Wang PR, Russell DW. Transplanted bone marrow regenerates liver by cell fusion. Nature. 2003;422:901–904. doi: 10.1038/nature01539. [DOI] [PubMed] [Google Scholar]
- Wang X, Willenbring H, Akkari Y, Torimaru Y, Foster M, Al-Dhalimy M, Lagasse E, Finegold M, Olson S, Grompe M. Cell fusion is the principal source of bone-marrow-derived hepatocytes. Nature. 2003;422:897–901. doi: 10.1038/nature01531. [DOI] [PubMed] [Google Scholar]
- Weimann JM, Charlton CA, Brazelton TR, Hackman RC, Blau HM. Contribution of transplanted bone marrow cells to Purkinje neurons in human adult brains. Proc Natl Acad Sci U S A. 2003;100:2088–2093. doi: 10.1073/pnas.0337659100. [DOI] [PMC free article] [PubMed] [Google Scholar]
- Weiss S, Dunne C, Hewson J, Wohl C, Wheatley M, Peterson AC, Reynolds BA. Multipotent CNS stem cells are present in the adult mammalian spinal cord and ventricular neuroaxis. J Neurosci. 1996;16:7599–7609. doi: 10.1523/JNEUROSCI.16-23-07599.1996. [DOI] [PMC free article] [PubMed] [Google Scholar]
- Wetmore C, Eberhart DE, Curran T. The normal patched allele is expressed in medulloblastomas from mice with heterozygous germ-line mutation of patched. Cancer Res. 2000;60:2239–2246. [PubMed] [Google Scholar]
- Ying QL, Nichols J, Evans EP, Smith AG. Changing potency by spontaneous fusion. Nature. 2002;416:545–548. doi: 10.1038/nature729. [DOI] [PubMed] [Google Scholar]


