

Abstract
Colon cancer progression is characterized by activating mutations in Ras and by the emergence of the tumor-promoting effects of transforming growth factor-β (TGF-β) signaling. Ras-inducible rat intestinal epithelial cells (RIE:iRas) undergo a well-described epithelial to mesenchymal transition and invasive phenotype in response to H-RasV12 expression and TGF-β treatment, modeling tumor progression. We characterized global gene expression profiles accompanying Ras-induced and TGF-β–induced epithelial to mesenchymal transition in RIE:iRas cells by microarray analysis and found that the regulation of gene expression by the combined activation of Ras and TGF-β signaling was associated with enrichment of a class of mRNAs containing 3′ AU-rich element (ARE) motifs known to regulate mRNA stability. Regulation of ARE-containing mRNA transcripts was validated at the mRNA level, including genes important for tumor progression. Ras and TGF-β synergistically increased the expression and mRNA stability of vascular endothelial growth factor (VEGF), a key regulator of tumor angiogenesis, in both RIE:iRas cells and an independent cell culture model (young adult mouse colonocyte). Expression profiling of human colorectal cancers (CRC) further revealed that many of these genes, including VEGF and PAI-1, were differentially expressed in stage IV human colon adenocarcinomas compared with adenomas. Furthermore, genes differentially expressed in CRC are also significantly enriched with ARE-containing transcripts. These studies show that oncogenic Ras and TGF-β synergistically regulate genes containing AREs in cultured rodent intestinal epithelial cells and suggest that posttranscriptional regulation of gene expression is an important mechanism involved in cellular transformation and CRC tumor progression.
Introduction
Mutations in oncogenes or tumor suppressor genes, in combination with tumor cell interaction with its microenvironment, play important roles in regulating cancer cell growth and behavior. Approximately 90% of human pancreatic cancers and 50% of colon cancers have conserved activating mutations in k-Ras (1), and activation of the downstream mitogen-activated protein kinase, mitogen-activated protein kinase/extracellular signal-regulated kinase (ERK) kinase (MEK), occurs in >70% of colorectal tumors (2), implicating Ras activation as a central regulator of carcinogenesis.
Transforming growth factor-β (TGF-β) is normally growth inhibitory for intestinal epithelial cells (3, 4) and functions through activation of the Smad signaling pathway to initiate transcription of target genes that potently inhibit cell growth (5). However, increased TGF-β expression is observed in >90% of cancers (6) and is associated with advanced stage, increased recurrence, and poor prognosis in colorectal cancer (CRC; refs. 7, 8). We and others have found that transforming events, such as Ras activation, contribute to both the resistance of epithelial cells to growth inhibition by TGF-β as well as to the tumor-promoting effects of TGF-β signaling (4, 9-11).
The interactions between the Ras and TGF-β signaling cascades are well described in keratinocytes and mammary epithelial cells. Oncogenic H-RasV12–transformed keratinocytes are refractory to TGF-β–mediated growth inhibition and have reduced TGF-β-Smad signaling due to decreased ligand and TGF-β type II receptor (TβRII) expression and nuclear accumulation of Smad2/3 (12, 13). TGF-β cooperates with Ras in EpRas mammary epithelial cells to induce a spindly phenotype, loss of cell-cell junction integrity associated with cytoplasmic localization of E-cadherin and β-catenin, decreased expression of epithelial markers, increased expression of mesenchymal markers, and increased invasion (14). Blocking TGF-β signaling with dominant-negative TβRII expression in EpRas cells blocks epithelial to mesenchymal transition (EMT), invasion, tumor growth, and metastasis (14). TGF-β stimulates Ras-dependent ERK activity and increases motility and invasion in transformed keratinocytes (15). Furthermore, restoration of low levels of TβRII expression in colon cancer cell lines increases cell invasiveness but high TβRII expression restores the growth-inhibitory effects of TGF-β (14). Expression of Smad7, which inhibits TGF-β-Smad signaling, induces oncogenic Ras-expressing keratinocytes to form carcinomas instead of papillomas (16). TGF-β and Ras cooperate to increase invasion and migration in breast cancer cells and TGF-β–induced EMT requires active MEK/ERK signaling (17, 18). These studies indicate that activation of oncogenes, such as Ras, causes a switch in the TGF-β response in epithelial cells from tumor suppression to tumor promotion.
We previously reported that conditional oncogenic Ha-RasV12 expression causes morphologic changes consistent with EMT, actin reorganization, increased vimentin expression, decreased E-cadherin expression, and increased invasiveness of rat intestinal epithelial cells (RIE:iRas cells; ref. 11). TGF-β enhances EMT in RIE:iRas cells transformed by oncogenic Ras, further decreasing E-cadherin expression, increasing nuclear localization of β-catenin, and increasing cell invasiveness (11, 19). Interestingly, although blocking TGF-β signaling with dominant-negative TβRII expression decreases the growth-inhibitory effect of TGF-β regardless of RasV12 expression, dominant-negative TβRII also decreases TGF-β–induced invasion in Ras-transformed cells, showing that TGF-β has both tumor-suppressing and tumor-promoting functions (11).
The mechanisms by which oncogenic Ras and TGF-β cooperate to induce EMT and invasion are not completely understood. We have shown that oncogenic Ras induces degradation of Smad4 in the rat intestinal epithelial cells, expression of which is necessary for TGF-β–induced growth suppression, suggesting that oncogenic Ras inhibits the growth-inhibitory Smad-mediated responses of TGF-β (10). Recently, TGF-β treatment of oncogenic Ras-expressing cells was shown to synergistically induce cyclooxygenase-2 (COX-2) mRNA and protein expression through a mechanism of increased COX-2 mRNA stability involving the AU-rich element (ARE) region of the COX-2 3′-untranslated region (3′-UTR; refs. 19, 20). Interestingly, increased COX-2 expression and mRNA stability in colon cancer cell lines is associated with increased growth and tumor size (21).
In this study, we examined the collaborative effects of Ras and TGF-β by gene expression profiling. To characterize changes in gene expression related to the cooperative effect on malignant behavior that occurs with TGF-β treatment of Ras-transformed cells, we examined global gene expression patterns induced by Ras transformation alone, TGF-β treatment alone, and the combination of Ras transformation and TGF-β treatment by oligonucleotide microarray.
We found that oncogenic Ras and TGF-β together have a more than additive, or synergistic, effect on the expression of a set of genes that are enriched for ARE-containing mRNAs. Consistent with this effect, we found that oncogenic Ras and TGF-β synergistically increase the expression of vascular endothelial growth factor (VEGF) through stabilization of its ARE-containing mRNA. Furthermore, we found that VEGF and other synergistically regulated genes, particularly ARE-containing transcripts, are differentially regulated in stage IV colorectal adenocarcinomas. Thus, we show that the cooperation between oncogenic Ras and TGF-β resulting in EMT and malignant cell behaviors may occur through aberrant posttranscriptional regulation of gene expression with biological relevance to human CRC.
Results
Ras and TGF-β Specifically Activate Downstream Effectors in RIE:iRas Cells
To examine the interaction between oncogenic Ras and TGF-β signaling, we used rat intestinal epithelial cells stably transfected with an inducible activated H-RasG12V construct (RIE:iRas cells) in which oncogenic Ras expression induces EMT and invasion, which is further augmented by treatment with TGF-β (11, 20). To validate that this phenotypic transformation is specific for Ras activation and TGF-β treatment, both immediate downstream effectors (i.e., Smads and MEK) as well as targets further downstream, such as COX-2, were examined in the RIE:iRas cells.
TGF-β–induced activation of its primary downstream effector, Smad2, was examined by Western blotting for phosphorylated Smad2. Treatment of RIE:iRas cells for 24 h with TGF-β induced robust phosphorylation and activation of Smad2 in the presence or absence of Ras induction (Fig. 1A), whereas oncogenic Ras alone did not activate Smad2. An inhibitor of the kinase activity of TβRI, which blocks its ability to activate downstream effectors, was used for two purposes: first, to confirm the specificity of TGF-β treatment, and second, to determine whether oncogenic Ras expression induces expression of TGF-β in the RIE:iRas cells and whether this TGF-β then acts alone or in concert with RasV12 to activate downstream signaling. Inhibition of TβRI activity with LY364947 (TRKi) blocks TGF-β–induced phosphorylation of Smad2 (Fig. 1A). When RIE:iRas cells were treated with TRKi to inhibit TGF-β signaling, TGF-β–induced expression of COX-2, a known downstream effector of TGF-β (20), was completely blocked and the cooperative induction of COX-2 by Ras and TGF-β together was reduced to the level of COX-2 expression induced by Ras alone (Fig. 1A).
FIGURE 1.
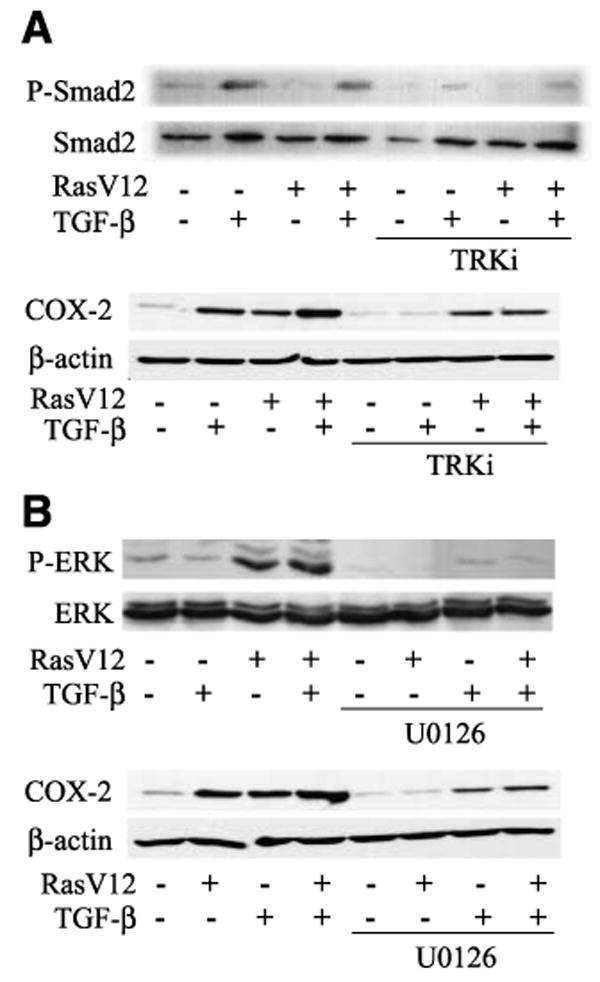
Ras and TGF-β activate their downstream effectors in RIE:iRas cells. RIE:iRas cells were pretreated for 15 min with (A) a TGF-β receptor kinase inhibitor (2 μmol/L LY364947/TRKi) or (B) a MEK inhibitor (10 μmol/L U0126) and then treated for 24 h with 5 mmol/L IPTG and/or 3 ng/mL TGF-β. Western blotting was done for phosphorylated Smad2 (P-Smad2), total Smad2, phosphorylated ERK (P-ERK), total ERK, COX-2, and β-actin. Blots shown are representative of three independent experiments.
Phosphorylation and activation of the MEK/ERK signaling pathway by oncogenic Ras and TGF-β was examined by Western blot using antibodies specific for phosphorylated ERK or total ERK. After treatment of RIE:iRas cells for 24 h with isopropyl-l-thio-B-d-galactopyranoside (IPTG), TGF-β, or IPTG and TGF-β together, ERK was phosphorylated in the RasV12-expressing cells. Although TGF-β alone transiently activates ERK within the first few hours of treatment (data not shown), MEK/ERK was not active after 24 h of TGF-β treatment alone in these cells (Fig. 1B). No marked difference in ERK phosphorylation was seen with RasV12 and TGF-β together compared with RasV12 alone. Pretreatment of RIE:iRas cells with U0126, a MEK inhibitor, blocked both basal and Ras-induced phosphorylation of ERK. Inhibition of MEK/ERK signaling with U0126 blocked Ras-induced and slightly reduced TGF-β–induced COX-2 expression in the presence or absence of oncogenic Ras (Fig. 1B). Taken together, these results indicate that the cooperation between oncogenic Ras and TGF-β does not occur at the level of primary signal transduction through ERK and Smads because the combination of Ras activation and TGF-β treatment does not modify the activation of ERK or Smad2 compared with either alone. Rather, these data suggest that Ras and TGF-β signaling events intersect further downstream.
Oncogenic Ras and TGF-β Synergistically Regulate Gene Expression
To assess global changes in gene expression related to the cooperative interaction of Ras and TGF-β in transformation, we conducted microarray analysis of RIE:iRas cells at 72 h after induction of H-RasV12 expression and/or TGF-β treatment while simultaneously assessing the cells for molecular and morphologic changes associated with EMT and acquisition of an invasive phenotype (11). RNA from RIE:iRas cells left untreated, induced to express oncogenic Ras, treated with TGF-β, or after both Ras induction and TGF-β treatment together was hybridized to a 28,000-gene rat-specific oligonucleotide microarray and analyzed. Each of these treatment groups yielded both unique and overlapping gene signatures (Fig. 2A). Further analysis of the gene expression profile stimulated by Ras and TGF-β together revealed a set of genes that showed a more than additive, or synergistic, change with combined RasV12 expression and TGF-β treatment over either treatment alone. We found that RasV12 induction and TGF-β treatment significantly (P < 0.05) induced the expression of 553 transcripts, of which 194 showed a synergistic increase. Similarly, Ras activation and TGF-β treatment together significantly (P < 0.05) down-regulated 619 transcripts, including 185 that were synergistically decreased. In total, Ras activation and TGF-β treatment synergistically regulated 379 transcripts, representing 191 unique, annotated genes. A complete list of synergistically regulated genes is found in Supplementary Table S2. Oncogenic Ras expression and TGF-β treatment together display a novel gene expression profile that would not have been predicted from either stimulus alone, resulting in the cooperative regulation of a cohort of genes, collectively referred to hereafter as the “Ras and TGF-β signature.”
FIGURE 2.

Summary of microarray results and validation. A. Venn diagrams showing the distribution of genes up-regulated or down-regulated in RIE:iRas cells after treatment with 5 mmol/L IPTG to induce RasV12 expression, 3 ng/mL TGF-β treatment, or combined IPTG and TGF-β treatment for 72 h. The total number of genes with altered expression above 2-fold (P < 0.05) for each treatment is given in parenthesis. B. Quantitative real-time reverse transcription-PCR of Cox-2, Wnt5a, Spp1, and Cugbp2 in RIE:iRas cells treated for 72 h with 5 mmol/L IPTG, 3 ng/mL TGF-β, or IPTG and TGF-β together. Changes in gene expression under treated conditions were calculated relative to untreated samples and all values were normalized to the housekeeping gene Pmm1. Dotted lines show mean expression for each treatment. Significance was determined by ANOVA with Bonferroni correction. *, P < 0.02.
Validation of Microarray Results
We have previously shown that oncogenic Ras and TGF-β cooperate to synergistically increase PAI-1 and COX-2 expression (11, 20). Independent and quantitative validation of the Ras and TGF-β signature was conducted in RIE:iRas cells for both mRNA and protein expression. The synergistic regulation of several genes implicated in tumor progression, such as Cox-2, Wnt5a, osteopontin (Spp1), and Cugbp2, was validated by quantitative real-time reverse transcription-PCR (Fig. 2B). Additional validation at the protein level was determined by Western blot (PAI-1, Id2, and follistatin) or ELISA (TGF-α; data not shown). For each of these genes, oncogenic Ras expression combined with TGF-β treatment resulted in synergistic regulation of gene expression levels compared with each condition alone.
Ras and TGF-β Target Genes Involved in Cell Growth and Movement
The Ras and TGF-β gene signature was subsequently subjected to WebGestalt and Ingenuity Pathway Analysis to examine the signaling pathways, cellular and molecular functions, and biological processes in which these genes are involved based on the published literature. This analysis showed that one interaction network was linked through TGF-β as a central node and contained 29 genes involved in tissue morphology, cell cycle, and cellular development. Another network contained H-Ras as a central node for 13 genes with known roles in cellular movement, cancer, and cell morphology. Overall, the Ras and TGF-β signature was significantly enriched for genes associated with cell movement (52 genes; P < 0.002), development (59 genes; P < 0.002), and cell growth and proliferation (80 genes; P < 0.002). The Ras and TGF-β signature also contains several transcription factors (Zfp36l1, Fosb, Tcf7, Dmrt2, Klf4, Stat1, Id2, and Smarca2), extracellular matrix–related genes (Col5a3, Col14a1, Timp2, Adamts1, Mmp13, Mmp10, Lamb3, Lamc2, and Itga5), as well as genes involved in cell adhesion and cytoskeletal organization (Ctnnal1, Marks, Fhl3, Tns4, Frmd4a, Map1b, Ocln, Cav1, and Cadm1), angiogenesis (Vegfa, Edn1, Fgf1, and Sphk1), and several members of the TGF-β (Id2, Bmp2, Inhba, Tgfb1, Bmp4, Fst, and Pai1) and Wnt (Wnt5a, Fzd1, Wnt7b, Axin2, and Wnt2) signaling pathways. In addition, the Ras and TGF-β signature is enriched for several genes with known roles in cancer (67 genes; P < 0.002). In summary, microarray analysis revealed the gene expression program associated with oncogenic Ras-induced and TGF-β–induced EMT, which included genes with known roles in mitogenesis, migration, and invasion.
Oncogenic Ras and TGF-β Synergistically Increase VEGF mRNA and Protein Expression
Because the angiogenic factor VEGF has a well-established role in promoting cancer progression and metastasis (22-25), we verified that VEGF mRNA and protein levels were synergistically induced by activated Ras in combination with TGF-β exposure. VEGF levels were determined by ELISA in conditioned medium from RIE:iRas cells treated for 24 h with IPTG to induce oncogenic Ras expression, TGF-β, or both IPTG and TGF-β. Untreated RIE:iRas cells produce low levels of VEGF protein. Treatment of RIE:iRas cells with TGF-β or expression of oncogenic Ras alone increased VEGF protein levels in the medium by 3- to 4-fold, whereas oncogenic Ras and TGF-β together synergistically increased VEGF protein levels >15-fold (Fig. 3A). Similar results were observed after 72 h of treatment (data not shown). Likewise, steady-state VEGF mRNA levels are very low in untreated RIE:iRas cells and increase 6- and 4-fold after IPTG induction of RasV12 or TGF-β treatment, respectively, but increase >13-fold with RasV12 expression and TGF-β together (Fig. 3A). The cooperative effects of RasV12 and TGF-β on VEGF protein expression were confirmed independently in young adult mouse colonocyte (YAMC) cells and YAMC cells stably transfected with RasV12 (YAMC-Ras). Oncogenic Ras expression increased VEGF expression in YAMC-Ras cells compared with parental cells and TGF-β treatment cooperated with RasV12 to further increase VEGF expression (Fig. 3B).
FIGURE 3.
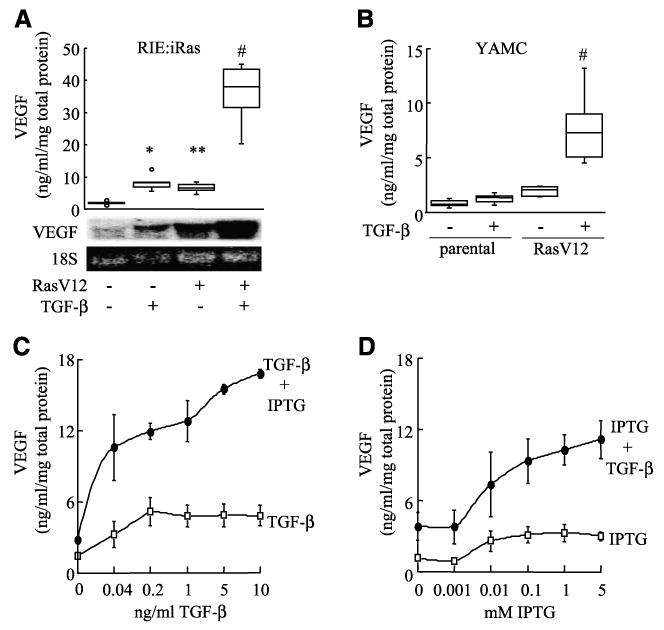
Oncogenic Ras and TGF-β synergistically increase VEGF expression in RIE:iRas and YAMC cells. A. RIE:iRas cells were treated with either vehicle, 5 mmol/L IPTG, 3 ng/mL TGF-β, or both IPTG and TGF-β for 24 h. VEGF protein levels were measured in conditioned medium by ELISA and normalized to total protein concentrations. Box plot shows data summarized from seven independently replicated experiments. *, P < 0.004, compared with untreated; **, P < 0.03, compared with untreated; #, P < 0.002, compared with all treatments. VEGF mRNA levels in RIE:iRas cells were visualized by Northern blot using a mouse VEGF165 cDNA probe and 18S rRNA visualized with ethidium bromide. Northern blot is representative of six separate experiments. B. YAMC and YAMC-Ras cells were treated with or without 5 ng/mL TGF-β for 24 h and then VEGF levels were measured in conditioned medium by ELISA and normalized to total protein concentrations. Box plot shows data from eight independently replicated experiments. #, P < 0.0001, compared with all samples. C and D. RIE:iRas cells were treated with IPTG and/or TGF-β at varying doses for 24 h and VEGF levels were measured in conditioned medium by ELISA and normalized to total protein concentrations. Cells were treated with or without 5 mmol/L IPTG and 0, 0.04, 0.2, 1, 5, or 10 ng/mL of TGF-β or cells were treated with or without 3 ng/mL TGF-β and 0, 0.001, 0.01, 0.1, 1, or 5 mmol/L of IPTG. Points, average of three independent experiments; bars, SE. Dose dependence and synergistic interaction were confirmed via multiple linear regression (all P < 0.0001).
Induction of VEGF by TGF-β treatment is dose dependent, leveling out at 0.2 ng/mL TGF-β (Fig. 3C). IPTG-induced oncogenic Ras expression also stimulated VEGF in a dose-dependent manner (Fig. 3D); however, the nature of the Lac operon-controlled inducible system relies more on a threshold IPTG dose to induce Ras expression than on a gradient response. However, TGF-β treatment and RasV12 induction together have a synergistic interaction on the production of VEGF (all P < 0.0001, test for interaction in regression). These results show the dose-dependent and synergistic induction of VEGF expression stimulated by Ras and TGF-β together compared with each alone.
VEGF Induction by Oncogenic Ras and TGF-β Is Independent of COX-2 Activity
Because previous studies have indicated a role for COX-2 in the induction of VEGF in tumor cells (26-30), we wanted to examine the secondary effects of COX-2 activity in the RIE:iRas model system. A COX-2–specific inhibitor, NS398, was used at a concentration (10 μmol/L) that completely inhibits COX-2–dependent prostaglandin production (27). Inhibition of COX-2 activity and prostaglandin production at this dose had no effect on the synergistic induction of VEGF by oncogenic Ras and TGF-β (Fig. 4A), indicating that Ras and TGF-β signaling regulate VEGF expression independently of COX-2. Prostaglandin levels, and thus COX-2 activity, were assessed by 6-keto-PGF1α, a stable metabolite of PGI2 and one of the major prostaglandins produced by COX-2 activity in these cells (Fig. 4B). Similar results were obtained with the COX-2 inhibitor celecoxib and a similar response was observed for PGE2 levels (data not shown). These data show that oncogenic Ras and TGF-β regulate VEGF gene expression through a COX-2–independent mechanism.
FIGURE 4.

Ras-mediated and TGF-β–mediated increase in VEGF expression is COX-2 independent. RIE:iRas cells were pretreated with DMSO or 10 μmol/L NS398 for 15 min and then treated with vehicle, 5 mmol/L IPTG, 3 ng/mL TGF-β, or both IPTG and TGF-β for 24 h. A. VEGF protein in conditioned medium was measured by ELISA and normalized to total protein concentration. Box plots show data from four independently replicated experiments. B. Prostacyclin (6-keto-PGF1α) levels in conditioned medium were measured by gas chromatography-mass spectrometry. Box plots show data from four independently replicated experiments. Significance between no inhibitor and NS398 treatment was determined by ANOVA with Bonferroni correction. *, P < 0.0001, compared with TGF-β; **, P = 0.09, compared with Ras; #, P < 0.0001, compared with Ras + TGF-β.
Oncogenic Ras and TGF-β Cooperate to Increase VEGF mRNA Stability
Our previous work shows that oncogenic Ras and TGF-β synergistically increase COX-2 expression and mRNA stability through a mechanism involving AREs in the 3′-UTR of its mRNA transcript (20). VEGF mRNAs also contain AREs in their 3′-UTR that target VEGF mRNA for rapid degradation (31-34). We hypothesized that Ras and TGF-β cooperatively regulate global gene expression profiles through a posttranscriptional mechanism involving AREs. To test this hypothesis, we first examined the half-life of VEGF mRNA in the context of oncogenic Ras expression and TGF-β treatment and found that in untreated cells rapid decay was observed, yielding a half-life of 25 min for VEGF mRNA. Either Ras induction or TGF-β treatment alone increased the stability of VEGF mRNA significantly (both P < 0.0001), extending the half-life to 50 to 55 min. Furthermore, we found that combined Ras activation and TGF-β treatment together also significantly increased VEGF mRNA stability (P < 0.0001), extending the half-life to 120 min (Fig. 5). Although no interaction above the additive effects of TGF-β and RasV12 was seen in mRNA stability (all P > 0.1788), combined oncogenic Ras expression and TGF-β markedly potentiated VEGF mRNA stability compared with each alone. These results show that oncogenic Ras and TGF-β cooperate to increase VEGF expression through increased VEGF mRNA stability.
FIGURE 5.

Oncogenic Ras and TGF-β cooperate to synergistically stabilize VEGF mRNA. Northern blot analysis of RIE:iRas cells after treatment for 24 h with vehicle, 5 mmol/L IPTG, 3 ng/mL TGF-β, or both IPTG and TGF-β and then treatment with 10 Ag/mL actinomycin D for up to 4 h. A. VEGF Northern blot and 18S rRNA, as detected by ethidium bromide staining. B. Percentage of VEGF mRNA, normalized to 18S rRNA levels, remaining after actinomycin D treatment. Data are representative of three separate experiments. □, untreated; ○, TGF-β; ■, RasV12; ●, RasV12 + TGF-β.
Oncogenic Ras and TGF-β Regulate ARE-Containing Genes
To further test the hypothesis that Ras and TGF-β cooperate to regulate gene expression posttranscriptionally, the Ras and TGF-β signature was examined for ARE motifs that mediate posttranscriptional regulation of gene expression (35) and function as binding sites for specific RNA-binding proteins that regulate the rate of RNA degradation and translation (36, 37). We found that 39% of the 379 synergistically regulated transcripts contained AREs in their 3′-UTRs using a multiple-search approach. Among the 191 unique genes in this set with annotations, 105 (56%) contain AREs (Supplementary Table S2). Because only 5% to 8% of the transcriptome is estimated to contain such elements (35), the Ras and TGF-β signature was found to be enriched >4-fold with ARE-containing genes. To assess the statistical significance of ARE gene representation, we used the recently developed and stringent ARED Organism database (38). We observed a statistically significant 4-fold increase in ARE gene representation in the set of synergistically regulated genes (P = 0.001; Table 1). Interestingly, we also observed a 4-fold enrichment of ARE-containing genes among those genes differentially regulated in response to Ras expression (P = 0.0001) or TGF-β treatment (P = 0.0002) alone or together (P = 0.0001). It should be noted that the ARED Organism method is very stringent and noncomprehensive due to the high number of rat genes with incomplete or missing 3′-UTRs. The synergistically regulated ARE-containing genes are significantly enriched for genes associated with cell migration and invasion (P < 0.002), cell growth and proliferation (P < 0.001), and cancer (P < 0.004). The biological and molecular functions of some of these genes are listed in Table 2. The overrepresentation of ARE-containing genes in the Ras and TGF-β signature suggests that neoplastic transformation results in profound changes in gene expression through posttranscriptional mechanisms.
Table 1. Statistical Significance of ARE Gene Representation in RIE:iRas Cells.
| Treatment/Condition | Experimental Gene List | Whole Transcriptome | Enrichment | P |
|---|---|---|---|---|
| TGF-β | 8.2% | 1.92% | 4-fold | 0.0001 |
| IPTG | 8.3% | 1.92% | 4-fold | 0.0002 |
| IPTG + TGF-β | 8.0% | 1.92% | 4-fold | 0.0001 |
| Synergy | 7.5% | 1.92% | 4-fold | 0.0001 |
Table 2. Functions of ARE-Containing Genes Synergistically Regulated by Oncogenic Ras and TGF-β.
| Gene Symbol | Gene Name | Rat Ensembl Gene ID | Fold Change
|
||
|---|---|---|---|---|---|
| TGF-β | RasV12 | RasV12 + TGF-β | |||
| Adhesion and motility | |||||
| Nrg1 | Neuregulin 1 | ENSRNOG00000010392 | −0.02 | 3.15 | 4.38 |
| Podxl | Podocalyxin like | ENSRNOG00000012495 | −1.34 | −1.65 | −2.90 |
| Marcks | Myristoylated alanine-rich protein kinase C substrate | ENSRNOG00000000579 | 0.01 | 1.38 | 3.20 |
| Vnn1 | Vanin 1 | ENSRNOG00000016219 | −2.09 | −5.77 | −7.94 |
| Gne | Glucosamine | ENSRNOG00000014365 | 1.77 | 4.11 | 6.52 |
| Olr1 | Oxidized low-density lipoprotein (lectin-like) receptor 1 | ENSRNOG00000008375 | −1.84 | −4.26 | −21.26 |
| Col14a1 | Procollagen, type XIV, α1 (predicted) | ENSRNOG00000026415 | −1.67 | −8.14 | −13.31 |
| Igsf4a | Immunoglobulin superfamily, member 4A | ENSRNOG00000018778 | −1.33 | −2.11 | −4.23 |
| Lamc2 | Laminin, γ2 | ENSRNOG00000002667 | 1.78 | 7.49 | 9.63 |
| Cxadr | Coxsackie virus and adenovirus receptor | ENSRNOG00000001557 | −1.65 | −7.32 | −10.53 |
| Ctnnal1 | Catenin (cadherin-associated protein), α-like 1 (predicted) | ENSRNOG00000010593 | −2.57 | −2.31 | −7.18 |
| Angiogenesis | |||||
| Vegfa | Vascular endothelial growth factor | ENSRNOG00000019598 | 1.45 | 5.90 | 7.52 |
| Fgf13 | Fibroblast growth factor 13 | ENSRNOG00000003523 | −1.29 | −7.46 | −13.92 |
| Growth and proliferation | |||||
| Gas6 | Growth arrest – specific 6 | ENSRNOG00000018233 | −2.08 | −10.17 | −27.00 |
| Nppb | Natriuretic peptide precursor type B | ENSRNOG00000008141 | 2.73 | 9.17 | 14.57 |
| Fhl1 | Four and a half LIM domains 1 | ENSRNOG00000000875 | 1.30 | −11.85 | −18.74 |
| Dusp1 | Dual specificity phosphatase 1 | ENSRNOG00000003977 | 1.85 | −1.03 | −3.36 |
| Mycn | v-myc myelocytomatosis viral-related oncogene, neuroblastoma derived (avian) | ENSRNOG00000006308 | −1.58 | −18.99 | −67.66 |
| Transcription | |||||
| Klf4 | Kruppel-like factor 4 (6) | ENSRNOG00000016299 | −1.29 | 1.04 | −2.54 |
| Id2 | Inhibitor of DNA binding 2 | ENSRNOG00000007237 | −3.40 | −2.15 | −6.66 |
| Tcf7 | Transcription factor 7, T-cell specific (predicted) | ENSRNOG00000005872 | 1.85 | −1.10 | 20.51 |
| Stat1 | Signal transducer and activator of transcription 2 | ENSRNOG00000014079 | −1.80 | −1.28 | −3.16 |
| Nrg1 | Neuregulin 1 | ENSRNOG00000010392 | −0.02 | 3.15 | 4.38 |
| Extracellular matrix related | |||||
| Adamts1 | A disintegrin-like and metallopeptidase with thrombospondin type 1 motif, 1 | ENSRNOG00000001607 | −2.32 | −12.63 | −19.39 |
| Col14a1 | Procollagen, type XIV, α1 (predicted) | ENSRNOG00000026415 | −1.67 | −8.14 | −13.31 |
| Mmp13 | Matrix metallopeptidase 13 | ENSRNOG00000008478 | 2.18 | 3.23 | 23.10 |
| Mmp10 | Matrix metallopeptidase 10 | ENSRNOG00000032832 | 1.24 | 2.71 | 4.10 |
| Cytoskeleton | |||||
| Marcks | Myristoylated alanine-rich protein kinase C substrate | ENSRNOG00000000579 | 0.01 | 1.38 | 3.20 |
| Map1b | Microtubule-associated protein 1b | ENSRNOG00000017428 | 4.01 | 5.37 | 9.94 |
| Ctnnal1 | Catenin (cadherin-associated protein), α-like 1 (predicted) | ENSRNOG00000010593 | −2.57 | −2.31 | −7.18 |
| Cav | Caveolin | ENSRNOG00000006694 | −1.68 | −2.13 | −5.01 |
| RNA-binding proteins | |||||
| Zfp36l1 | Zinc finger protein 36, C3H type-like 1 | ENSRNOG00000030024 | −2.35 | −2.13 | −6.25 |
| CUGBP2 | CUG triplet repeat, RNA-binding protein 2 | ENSRNOG00000023661 | −2.01 | −2.58 | −5.64 |
| A2bp1 | Ataxin 2 – binding protein | ENSRNOG00000002827 | −1.42 | 3.09 | 4.71 |
| Growth factors and cytokines | |||||
| Nrg1 | Neuregulin 1 | ENSRNOG00000010392 | −0.02 | 3.15 | 4.38 |
| Pdgfa | Platelet-derived growth factor, α | ENSRNOG00000001312 | 1.30 | 2.24 | 6.74 |
| Il24 | Interleukin-24 | ENSRNOG00000004470 | 1.30 | 2.95 | 23.63 |
| Il1a | Interleukin-1α | ENSRNOG00000004575 | 1.08 | 1.46 | 16.17 |
| Ccl2 | Chemokine (C-C motif) ligand 2 | ENSRNOG00000007159 | 5.47 | 17.28 | 37.90 |
| Btc | Betacellulin | ENSRNOG00000002728 | −1.58 | −7.33 | −11.47 |
| Wnt signaling | |||||
| Wnt5a | Wingless-type MMTV integration site 5A | ENSRNOG00000015618 | 1.09 | 2.98 | 7.41 |
| Wnt2 | Wingless-related MMTV integration site 2 | ENSRNOG00000007843 | 2.49 | 1.16 | 7.79 |
| Fzd1 | Frizzled homologue 1 (Drosophila) | ENSRNOG00000016242 | 1.20 | 1.24 | 2.70 |
| Axin2 | Axin2 | ENSRNOG00000003612 | 1.42 | 2.26 | 4.26 |
| TGF-β signaling | |||||
| Bmp4 | Bone morphogenetic protein 4 | ENSRNOG00000009694 | −1.90 | −10.34 | −18.82 |
| Bmp2 | Bone morphogenetic protein 2 | ENSRNOG00000021276 | 1.81 | 20.10 | 25.40 |
| Serpine1 | Serine (or cysteine) peptidase inhibitor, clade E, member 1 (PAI-1) | ENSRNOG00000001414 | 33.57 | 4.60 | 57.69 |
NOTE: All genes listed in the table are significantly and synergistically regulated by a combination of Ras induction and TGF-β treatment and contain an ARE motif in the 3′-UTR. Fold change represents expression in Ras-expressing and/or TGF-β–treated samples compared with untreated. Presence of an ARE was determined by analysis using the ARE database ARED3.0 (35).
Clinical Significance of ARE-Containing Genes in CRC Progression
To determine whether the Ras and TGF-β signature derived from RIE:iRas cells provides mechanistic insights into the human disease, we examined global gene expression profiles from human CRCs. We obtained gene expression profiles from CRC samples using the Affymetrix U133 Plus 2.0 array. We analyzed these profiles for genes significantly (Q < 0.05) changed in human stage IV metastatic colorectal adenocarcinomas compared with adenomas and found that 7,721 transcripts, corresponding to 3,694 unique Ensembl Gene IDs, were differentially regulated.
Previous studies have shown that dysregulation of mRNA stability may occur during the malignant transformation of cancer cells through mutations in the cis-regulatory elements or by dysregulation of the trans-acting proteins that bind these elements (21, 39, 40). Taken together with our observation that ARE-containing genes are enriched in the Ras and TGF-β signature, we asked whether a similar ARE-mRNA enrichment occurs in human CRC samples. We examined the set of 3,694 genes differentially regulated between adenomas and stage IV adenocarcinomas for the presence of conserved ARE motifs (35) and found a 3- to 4-fold enrichment in ARE-containing genes, observing an increase in ARE-mRNAs from 5% to 8% of the whole transcriptome to 20.2% within the differentially regulated transcripts (Supplementary Table S3). To facilitate statistical analysis, we used the stringent ARED database (38) and found that ARE representation in this gene list was statistically significant (P = 0.001; Table 3). Furthermore, we observed AREs in 13% to 18% of the genes differentially expressed between adenomas and any stage of adenocarcinoma, including stage I (P = 0.001), II (P = 0.001), or III (P = 0.002), and all adenocarcinomas combined (P = 0.0002), representing a statistically significant enrichment. A notable enrichment of ARE-containing genes (20.3%) was also observed in the list of genes differentially regulated in late-stage CRC samples that were analyzed with the ABI microarray platform (data not shown).
Table 3. Statistical Significance of ARE Gene Representation during the Progression of Human CRC.
| Stage | Experimental Gene List | Whole Transcriptome | Enrichment | P |
|---|---|---|---|---|
| Adenoma vs adenocarcinoma | 13.6% | 6.7% | 2.0-fold | 0.0002 |
| Adenoma vs stage IV | 13.6% | 6.7% | 2.0-fold | 0.0001 |
| Adenoma vs stage III | 13.0% | 6.7% | 2.0-fold | 0.0002 |
| Adenoma vs stage II | 14.0% | 6.7% | 2.1-fold | 0.0001 |
| Adenoma vs stage I | 18.0% | 6.7% | 2.7-fold | 0.0001 |
Several ARE-containing genes that are differentially expressed between human adenomas and stage IV CRC overlap with genes that are also present in the Ras and TGF-β gene signature derived from RIE:iRas cells (Table 4). There is a high correlation (8 of 11) in the direction of expression change between the oncogenic Ras-regulated and TGF-β–regulated genes and stage IV CRC. Several of the genes in common between the rat cellular model and human CRC are involved in cell proliferation and adhesion, such as COL14A1, GNE, MBP, PAI-1, TFP1, and VEGFA. Furthermore, three of these genes, VEGFA, PAI-1, and TFP1, have well-established roles in cancer. Taken together, these results indicate that molecular events in transformed RIE:iRas cells reflect the gene expression changes in human tumors and could provide mechanistic insights into the oncogenic process.
Table 4. Human and Rat Differentially Expressed ARE-Containing Genes.
| Gene Symbol | Gene Name | Rat RasV12 + TGF-β vs Untreated | Human Stage IV vs Adenoma |
|---|---|---|---|
| AKAP7 | A-kinase anchor protein 7 isoform γ | Down | Down |
| ANKH | Progressive ankylosis protein homologue | Up | Down |
| ARL4C | ADP-ribosylation factor-like protein 4C | Up | Up |
| CHSY1 | Chondroitin sulfate synthase 1 | Up | Up |
| COL14A1 | Collagen α-1(XIV) chain precursor | Down | Up |
| GNE | Bifunctional UDP-N-acetylglucosamine 2-epimerase/N-acetylmannosamine kinase | Up | Down |
| MBP | Myelin basic protein | Down | Down |
| RAB27A | Ras-related protein Rab-27A | Down | Down |
| SERPINE1 | Plasminogen activator inhibitor 1 precursor (PAI-1) | Up | Up |
| TFPI | Tissue factor pathway inhibitor | Up | Up |
| VEGFA | Vascular endothelial growth factor A | Up | Up |
NOTE: All genes listed contain AREs, are synergistically regulated by oncogenic Ras and TGF-β in RIE:iRas cells, and are significantly changed in human stage IV adenocarcinomas compared with adenomas. Presence of an ARE was determined by analysis using the ARE database ARED3.0 (35).
Discussion
The molecular mechanisms leading to the malignant transformation and metastasis of cancer cells are incompletely understood and are of utmost importance if we hope to effectively treat patients and decrease cancer-related fatalities. Given the heterogeneity and complexity of human tumors, experimental models of tumor cell behavior are invaluable for the elucidation of key regulators and mechanisms contributing to malignancy. In this study, we used a rat intestinal epithelial cell line under nontransforming and highly transforming conditions to characterize pathway-specific gene expression signatures in well-controlled conditions and found that a global mechanism of posttranscriptional regulation of gene expression is important during Ras-mediated and TGF-β–mediated EMT in vitro and is relevant to CRC.
TGF-β treatment enhances oncogenic Ras-induced transformation and invasion in intestinal epithelial cells. One explanation for this is that Ras and TGF-β each moderately activate the same pathways and that threshold effects are achieved when the two are activated in combination. In this study, TGF-β–mediated activation of Smad2 was not affected by Ras expression and Ras activation of ERK was not affected by TGF-β treatment, although Ras and TGF-β together cooperate to induce COX-2 expression. These results show that synergy between Ras and TGF-β occurs downstream or in parallel with the primary effectors of Ras and TGF-β signaling. Thus, cross-talk between Ras and TGF-β could lead to threshold activation and uniquely regulate a set of genes that neither alone affects.
This study set out to examine how the interaction of oncogenic Ras expression and TGF-β treatment together affects cells differently than either stimulus alone. Microarray analysis allowed us to examine global gene expression patterns and define a Ras and TGF-β expression signature consisting of genes that are regulated in a more than additive, or synergistic, way in response to the combined effects of oncogenic Ras and TGF-β. Quantitative validation of several genes in the Ras and TGF-β signature at the mRNA and protein levels showed that Ras and TGF-β interact to synergistically regulate gene expression.
The collaboration of Ras and TGF-β in regulating VEGF was of particular interest to us because VEGF is known to play an important role in the angiogenesis necessary for tumor growth and metastasis (22-25). We showed that Ras and TGF-β synergistically regulate VEGF mRNA and protein expression in RIE:iRas cells and in an independent colon cancer cell line, showing that this response is not cell line specific. VEGF is induced in a dose-dependent manner by both TGF-β and Ras induction and we show here that the combination of Ras and TGF-β together induces VEGF expression more than predicted from the effect of each alone. The synergistic increase in VEGF expression during oncogenic Ras-induced and TGF-β–induced EMT may not be accounted for solely due to increased transcriptional activity of the VEGF gene. The posttranscriptional regulation of COX-2 by Ras and TGF-β (20) and recent literature showing that under certain conditions VEGF mRNA stability may be altered (31-34) suggest that changes in posttranscriptional regulation are an important determinant of VEGF expression in cancer cells. We show here that cooperation between TGF-β and oncogenic Ras increased VEGF mRNA and protein expression by stabilizing VEGF mRNA.
We sought to determine the molecular mechanism by which oncogenic Ras and TGF-β synergistically regulate gene expression to gain insight into gene expression patterns associated with carcinogenesis. The synergistic regulation of both VEGF and COX-2 (20) mRNA stability suggested to us that posttranscriptional gene regulation is an important component of the collaborative effects of oncogenic Ras and TGF-β signaling. The primary mechanism for posttranscriptional regulation is through AREs that are located in the 3′-UTR of mRNA (41, 42), and significantly, 39% of genes synergistically regulated in this study contain AREs representing 4-fold enrichment compared with the genome as a whole (35). Among the genes increased or decreased by oncogenic Ras expression and TGF-β treatment, alone or together, we also observed a 4-fold enrichment of ARE-containing genes, suggesting that in addition to COX-2 and VEGF, several other genes known to be involved in tumor progression may also be coregulated by a similar posttranscriptional mechanism. This enrichment of ARE-containing genes indicates that the regulation of mRNA stability is an important mechanism of gene regulation during EMT.
There is a growing body of evidence suggesting that defects in mRNA turnover play a central role in cellular transformation. Specific immediate-early genes (proto-oncogenes among them), growth factors, cytokines, and genes encoding other inflammatory mediators, such as COX-2 and VEGF, have shown to be regulated though mRNA stabilization (43). Through specific interaction with AREs, RNA-binding proteins can be either positive or negative regulators of stability and translation (44). Our Ras and TGF-β signature contains two known RNA-binding proteins. Heterogeneous nuclear ribonucleoprotein A/B, a member of the heterogeneous nuclear ribonucleoprotein family of RNA-binding proteins involved in RNA trafficking and splicing, increased >3-fold with combined Ras expression and TGF-β treatment. In addition, CUGBP2, which has been shown to bind the COX-2 3′-UTR and promote its stability while inhibiting its translation in response to ionizing radiation (45), decreased >4-fold in response to Ras expression and TGF-β treatment. Furthermore, increased expression and cytoplasmic localization of HuR, a RNA-binding protein that stabilizes ARE-containing mRNA transcripts such as COX-2 in vitro (21, 46), is correlated with elevated COX-2 expression and poor outcome in ovarian, breast, and colon cancers (21, 40, 47, 48). Thus, modulating the expression, activity, and binding specificity, these trans-acting regulatory proteins could change the RNA-protein complexes formed, profoundly affecting RNA decay and protein translation. Although beyond the scope of this study, resolving the role of RNA-binding proteins during oncogenic Ras-mediated and TGF-β–mediated EMT could contribute important insights into the mechanisms of malignant transformation.
During Ras-induced and TGF-β–induced EMT and invasiveness, RIE:iRas cells model aspects of human tumor cell behavior (11, 20). We found that several of the ARE-containing transcripts in the Ras and TGF-β gene signature derived from RIE:iRas cells are also differentially regulated in metastatic tumors compared with early adenomas, including VEGFA and PAI-1. To further determine whether genes in the Ras and TGF-β signature are significant for human malignancy, we analyzed human CRC gene expression profiles for the presence of RNA regulatory elements. The genes that are differentially regulated in late-stage carcinomas compared with adenomas show a 3-fold enrichment in ARE-containing genes compared with the genome as a whole (35) and a similar enrichment is seen as early as stage I, suggesting that posttranscriptional gene regulation could be an important intracellular regulatory mechanism involved in early tumor progression from adenoma to invasive carcinoma.
In summary, through microarray-based gene expression profiling, we showed in this study that oncogenic Ras and TGF-β synergize to regulate the expression of numerous genes, resulting in an enrichment of expression in ARE-containing mRNAs in rat intestinal cells. The reflection of this gene expression profile and enrichment of AREs in human CRC cancers shows that this experimental model system can provide novel molecular explanations of EMT and cancer progression. Taken together with evidence that expression of VEGF and COX-2 (20) is coordinately and synergistically increased by combined oncogenic Ras and TGF-β signaling through a mechanism of mRNA stabilization, these results underscore the importance of the regulation of mRNA stability as a common mechanism of gene regulation that contributes to malignant cell behavior and provides insight into the mechanisms of metastatic CRC progression.
Materials and Methods
Cell Culture
Rat intestinal epithelial cells stably expressing inducible Ha-RasG12V cDNA under the control of the Lac operon (RIE:iRas) were derived and cultured as previously described (20). Transcriptional expression of Ha-RasG12V was induced by treatment with 5 mmol/L isopropyl-1-thio-β-D-galactopyranoside (IPTG; Sigma-Aldrich). YAMCs and YAMC cells expressing Ha-RasG12V (YAMC-Ras) were derived and maintained as previously described (49) in permissive conditions at 33°C in RPMI 1640 containing 5% fetal bovine serum and 5 units/mL murine IFN-γ (Roche). For all experiments, YAMC and YAMC-Ras cells were cultured under nonpermissive conditions at 37°C without IFN-γ. TGF-β was purchased from R&D Systems. U0126 was purchased from Calbiochem. A pharmacologic inhibitor of TβRI (LY364947 or TRKi) was provided by Eli Lilly. NS398 was from Cayman Chemical Co. and celecoxib was from Pharmacia and Upjohn.
Western Blots
Cells were lysed in radioimmunoprecipitation assay buffer and stored at −80°C until use. Protein samples were separated by SDS-PAGE (20-40 μg/lane) and transferred to polyvinylidene difluoride. The blots were blocked in PBS containing 0.1% Tween 20 and 5% bovine serum albumin or milk and incubated overnight in primary antibody at 4°C, rinsed, then incubated for 1 h in horseradish peroxidase–conjugated secondary antibody (Santa Cruz Biotechnology), and developed with enhanced chemiluminescence (Amersham). Anti-phosphorylated ERK, anti-ERK, and anti–β-actin antibodies were purchased from Sigma-Aldrich. Anti–phosphorylated Smad2 antibody was purchased from Cell Signaling Technology. Anti-Smad2 antibody was purchased from Invitrogen. Anti-COX-2 was purchased from Santa Cruz Biotechnology.
Microarray
RIE:iRas cells were plated at 0.5 × 10⁶ per 10-cm plate and allowed to attach overnight, and then cells were left untreated or treated for 72 h with 5 mmol/L IPTG (for H-RasV12 induction), 3 ng/mL TGF-β, or IPTG and TGF-β together in DMEM containing 0.5% fetal bovine serum. RNA was collected from three (IPTG and TGF-β) or four (untreated and IPTG + TGF-β) independent cultures. RNA was purified using the RNeasy kit from Qiagen according to the manufacturer's protocol, except no β-mercaptoethanol was added to lysis buffer. RNA was eluted with 10 mmol/L Tris/diethyl pyrocarbonate H2O at pH 8.0, and samples were submitted to the Vanderbilt Microarray Shared Resource.10 RNA quality was assessed with an Agilent 2100 bioanalyzer and then hybridized to Affymetrix Rat Genome 230 2.0 GeneChip Expression arrays according to the manufacturer's instructions. Data sets were normalized and background subtracted by the Robust MultiChip Analysis method (50). For each replicate, samples treated with IPTG and/or TGF-β were compared with the matched untreated sample. Gene expression increases or decreases were defined by a log2 ratio (treated/untreated) greater than 1 or less than −1, respectively, using GeneSpring software (Agilent Technologies). Synergistic regulation is defined as IPTG and TGF-β together showing a more than additive increase or decrease in expression compared with IPTG and TGF-β alone in at least two of three replicates. Significance of differentially expressed genes was determined using the Benjamini-Hochberg multiple testing comparison with a P value of <0.05.
RNA isolated from human CRC samples (5 adenomas and 60 colon adenocarcinomas) was hybridized to Affymetrix U133 Plus 2.0 GeneChip Expression arrays according to the manufacturer's instructions. Analysis of microarray results was done as described for the rat arrays using the Affymetrix analysis functions in Bioconductor.11 Genes differentially expressed between adenomas and adenocarcinomas were identified by a two-sample t test and probes with a Q value of <0.05 were selected for further analysis (51).
Real-time Reverse Transcription-PCR
RNA isolated for microarrays and validation was purified via RNeasy kit according to the manufacturer's instructions. cDNA synthesis was done using 300 ng RNA with SuperScript III Reverse Transcriptase from Invitrogen and one gene-specific primer at 50°C. Real-Time SYBR Green/Fluorescein PCR Master Mix was obtained from SuperArray. Primers for phosphomannomutase 1 (Pmm1), Ptgs2, Wnt5a, and Cugbp2 were designed in our laboratory and ordered from IDT Technologies (see Supplementary Table S1 for sequences). PCRs were prepared according to SYBR Green Master Mix protocol (SuperArray) and analyzed using a Bio-Rad iCycler under the following conditions: 95°C for 13.5 min (1 cycle), 95°C for 15 s, 55°C for 30 s, 72°C for 30 s (45 cycles); 72°C for 7 min (1 cycle), melt curve of 50°C for 10 s and temperature increase by 0.4°C for each cycle (100 cycles). Real-time PCR was done with four biological replicates of RIE:iRas RNA. All samples were set up in quadruplicate with efficiencies for each well calculated from the slopes of the exponential phase of the log-transformed reaction curves. Fold changes were calculated according to the methods of Schefe et al. (52). Reactions using Pmm1 housekeeping gene were used to normalize all data sets (53). ANOVA with Bonferroni correction was used to examine differences between mean fold change in gene expression among three treatment groups. Statistical analyses were done using KaleidaGraph version 4.03.
ELISA
RIE:iRas or YAMC cells were treated with TGF-β and/or IPTG for 24 h in serum-containing medium, conditioned media were collected, and cells were lysed in radioimmunoprecipitation assay buffer [150 mmol/L NaCl, 1% NP40, 1% sodium deoxycholate, 0.1% SDS, 50 mmol/L Tris-HCl (pH 8.0), 2 mmol/L EDTA, 1 mmol/L phenylmethylsulfonyl fluoride, 3 μg/mL aprotinin, 10 μg/mL leupeptin, 0.25 mmol/L vanadate, 10 mmol/L NaF]. Media and lysates were stored at −80°C until use. Samples were thawed and an ELISA was done using the rat/mouse VEGF DuoSet kit (R&D Systems) according to the manufacturer's instructions. VEGF concentration (ng/mL) was normalized to total protein levels in cell lysates as determined by bicinchoninic acid protein assay (Pierce). ANOVA was used to examine differences between mean VEGF protein expression levels among four treatment groups. Statistical analyses were done using Statistical Analysis System version 9.1 and R version 2.1.1. VEGF dose response was modeled via multiple linear regression with terms for linear, quadratic, and interactions between log IPTG and log TGF-β concentration.
RNA Extraction and Northern Blot
Total cellular RNA was extracted using Trizol (GibcoBRL) following the manufacturer's instructions. RNA was separated on a formaldehyde-agarose gel (10 μg/lane) and transferred to Hybond N (Amersham). Membranes were hybridized for 16 h at 42°C with a mouse VEGF165 cDNA probe labeled with [α-32P]dCTP by random primer extension (DECAprime II kit, Ambion). Membranes were then washed and mRNA levels were examined by autoradiography and quantified by phosphorimaging. Background was subtracted from VEGF mRNA levels and RNA loading was normalized to 18S rRNA visualized with ethidium bromide and quantified with a Bio-Rad Gel Doc. Where indicated, RIE:iRas cells were treated for 24 h with TGF-β, IPTG, or both and then transcription was inhibited by treatment with 5 μg/mL actinomycin D (Sigma-Aldrich) for up to 4 h. Mouse VEGF165 cDNA was a gift from Charles Lin (Vanderbilt University, Nashville, TN). VEGF mRNA half-life was estimated from a log-linear plot of VEGF/18S ratio versus time and least squares regression analysis. VEGF mRNA stability was modeled on a log scale via multiple linear regression with effects for time, TGF-β, IPTG, and interactions between treatments and between treatments and time, controlling for differences in three biological replicates.
Prostaglandin Analysis
RIE:iRas cells were pretreated for 15 min with 10 μmol/L NS398, 10 μmol/L celecoxib, or an equal volume of DMSO vehicle in DMEM with 0.5% fetal bovine serum, and then 5 mmol/L IPTG and/or 3 ng/mL TGF-β were added for an additional 24 h. Prostaglandins (PGF1α and PGE2) in conditioned medium were quantified by the mass spectrometric method developed by the Morrow laboratory, as previously described (54).
Human Colorectal Tissue Collection and Processing
Sixty-five patients were recruited at the Vanderbilt-Ingram Cancer Center at Vanderbilt University Medical Center and the Tennessee Valley Healthcare System Veterans Affairs Medical Center in Nashville, Tennessee between 2003 and 2005. All patients were diagnosed with adenoma or colorectal adenocarcinoma (stages I-IV) according to current American Joint Committee on Cancer guidelines. Patients used for this study were further selected based on the diagnosis of adenoma (n = 5 for Affymetrix analysis and n = 5 for ABI analysis), stage I (n = 10), stage II (n = 14), stage III (n = 17), or stage IV colorectal adenocarcinoma (n = 19 for Affymetrix analysis and n = 6 for ABI analysis). Informed consent was obtained from each patient and all protocols and procedures were approved by the Institutional Review Board at Vanderbilt University Medical Center and the Nashville Veterans Affairs Medical Center.
Tissue specimens from all colon and rectal tumors were obtained in the operating suite or at the time of endoscopic biopsy, respectively, and a representative specimen was sent to pathology to confirm the diagnosis of adenoma or adenocarcinoma. The remaining specimen was immediately flash frozen in liquid nitrogen, transported to the laboratory, and stored at −80°C. Representative quality assessment slides were obtained to verify the diagnosis and quality of all tissues sent to the laboratory.
RNA was purified from adjacent biopsy and surgical specimens with a confirmed diagnosis of adenoma or adenocarcinoma using the RNeasy kit according to the manufacturer's protocol, except no β-mercaptoethanol was added to lysis buffer. RNA was eluted with 10 mmol/L Tris/diethyl pyrocarbonate H2O at pH 8.0, and samples were submitted to the Vanderbilt Microarray Shared Resource. RNA quality was assessed with an Agilent 2100 bioanalyzer.
Identification of AREs
Human and rat RefSeq mRNAs with complete 3′-UTR were processed to computationally extract their 3′-UTRs; the ARE motifs were searched as previously described (55). Rat genes from the synergy gene list containing AREs were identified by a second independent approach; for those with incomplete 3′-UTR or missing 3′-UTR from rat Genbank mRNA records, AREs were defined from the human sequence homologues because AREs are conserved among mammalian species (56). This was accomplished by using BLAST to human mRNA records and retrieval of data from HomoloGene database at the National Center for Biotechnology Information. To assess the statistical significance of ARE gene representation, we used the stringent ARED Organism (38), which is based on the HomoloGene database, to examine the lists of differentially expressed rat genes (individual, combined, and synergistic conditions) and human adenoma compared with adenocarcinoma or each individual stage. The χ2 test was used to determine statistical significance.
Network and Functional Analysis
Rat microarray data were analyzed through the use of Ingenuity Pathway Analysis (Ingenuity Systems).12 Functional analysis of differentially regulated genes identified the biological functions and/or diseases that were most significant (P < 0.05) to the data set. Fischer's exact test was used to calculate a P value determining the probability that each biological function and/or disease assigned to the data set is due to chance alone.
The WebGestalt toolkit13 was used for the orthologous mapping, boolean operation, and functional annotation of the differentially expressed gene sets (57). Rat and human Affymetrix probe set IDs were uploaded into WebGestalt for the analyses. Rat genes were mapped to human orthologs to allow a direct comparison with the human gene sets.
Supplementary Material
Note: Supplementary data for this article are available at Molecular Cancer Research Online (http://mcr.aacrjournals.org/).
Acknowledgments
We thank the Vanderbilt Microarray Shared Resource, Lauren Sims, and Braden Boone for technical assistance and data analysis; Bing Zhang for additions to WebGestalt and microarray analysis advice; Anason Halees and Hana Abulleef for assistance with ARE analysis; Bonnie LaFleur and Rafe Donahue for statistical analysis; Stephanie Sanchez for prostaglandin analysis; and Jonathon M. Yingling (Lilly Research Laboratories, Indianapolis, IN) for kindly providing the inhibitor of TβRI and TβRII kinases (LY364947).
Grant support: USPHS National Cancer Institute grants CA69457 and CA95103, National Institute of Diabetes and Digestive and Kidney Diseases grant DK52334, and Vanderbilt-Ingram Cancer Center support grant CA68485.
Footnotes
Disclosure of Potential Conflicts of Interest No potential conflicts of interest were disclosed.
References
- 1.Bos J, Fearon E, Hamilton S, et al. Prevalence of ras gene mutations in human colorectal cancers. Nature. 1987;327:293–7. doi: 10.1038/327293a0. [DOI] [PubMed] [Google Scholar]
- 2.Lee S, Lee J, Soung Y, et al. Colorectal tumors frequently express phosphorylated mitogen-activated protein kinase. APMIS. 2004;112:233–8. doi: 10.1111/j.1600-0463.2004.apm11204-0502.x. [DOI] [PubMed] [Google Scholar]
- 3.Kurokowa M, Lynch K, Podolsky D. Effects of growth factors on an intestinal epithelial cell line: transforming growth factor β inhibits proliferation and stimulates differentiation. Biochem Biophys Res Commun. 1987;142:775–82. doi: 10.1016/0006-291x(87)91481-1. [DOI] [PubMed] [Google Scholar]
- 4.Filmus J, Zhao J, Buick R. Overexpression of H-ras oncogene induces resistance to the growth-inhibitory action of transforming growth factor β-1 (TGF-β1) and alters the number and type of TGF-β1 receptors in rat intestinal epithelial cell clones. Oncogene. 1992;7:521–6. [PubMed] [Google Scholar]
- 5.Shi Y, Massague J. Mechanisms of TGF-β signaling from cell membrane to the nucleus. Cell. 2003;113:685–700. doi: 10.1016/s0092-8674(03)00432-x. [DOI] [PubMed] [Google Scholar]
- 6.Derynck R, Goeddel D, Ullrich A, et al. Synthesis of messenger RNAs for transforming growth factors α and β and the epidermal growth factor receptor by human tumors. Cancer Res. 1987;47:707–12. [PubMed] [Google Scholar]
- 7.Robson H, Anderson E, James R, Schofield P. Transforming growth factor β1 expression in human colorectal tumours: an independent prognostic marker in a subgroup of poor prognosis patients. Br J Cancer. 1996;74:753–8. doi: 10.1038/bjc.1996.432. [DOI] [PMC free article] [PubMed] [Google Scholar]
- 8.Friedman E, Gold L, Klimstra D, Zeng Z, Winawer S, Cohen A. High levels of transforming growth factor β1 correlate with disease progression in human colon cancer. Cancer Epidemiol Biomarkers Prev. 1995;4:549–54. [PubMed] [Google Scholar]
- 9.Cui W, Fowlis D, Bryson S, et al. TGFβ1 inhibits the formation of benign skin tumors, but enhances progression to invasive spindle carcinomas in transgenic mice. Cell. 1996;86:531–42. doi: 10.1016/s0092-8674(00)80127-0. [DOI] [PubMed] [Google Scholar]
- 10.Saha D, Datta P, Beauchamp R. Oncogenic ras represses transforming growth factor-β/Smad signaling by degrading tumor suppressor Smad4. J Biol Chem. 2001;276:29531–7. doi: 10.1074/jbc.M100069200. [DOI] [PubMed] [Google Scholar]
- 11.Fujimoto K, Sheng H, Shao J, Beauchamp R. Transforming growth factor-β1 promotes invasiveness after cellular transformation with activated Ras in intestinal epithelial cells. Exp Cell Res. 2001;266:239–49. doi: 10.1006/excr.2000.5229. [DOI] [PubMed] [Google Scholar]
- 12.Game S, Huelsen A, Patel V, et al. Progressive abrogation of TGF-β1 and EGF growth control is associated with tumour progression in ras-transfected human keratinocytes. Int J Cancer. 1992;52:461–70. doi: 10.1002/ijc.2910520322. [DOI] [PubMed] [Google Scholar]
- 13.Kretzschmar M, Doody J, Timokhina I, Massagué J. A mechanism of repression of TGFβ/Smad signaling by oncogenic Ras. Genes Dev. 1999;13:804–16. doi: 10.1101/gad.13.7.804. [DOI] [PMC free article] [PubMed] [Google Scholar]
- 14.Oft M, Heider K, Beug H. TGFβ signaling is necessary for carcinoma cell invasiveness and metastasis. Curr Biol. 1998;8:1243–52. doi: 10.1016/s0960-9822(07)00533-7. [DOI] [PubMed] [Google Scholar]
- 15.Santibáñez J, Iglesias M, Frontelo P, Martínez J, Quintanilla M. Involvement of the Ras/MAPK signaling pathway in the modulation of urokinase production and cellular invasiveness by transforming growth factor-β(1) in transformed keratinocytes. Biochem Biophys Res Commun. 2000;273:521–7. doi: 10.1006/bbrc.2000.2946. [DOI] [PubMed] [Google Scholar]
- 16.Liu X, Lee J, Cooley M, Bhogte E, Hartley S, Glick A. Smad7 but not Smad6 cooperates with oncogenic ras to cause malignant conversion in a mouse model for squamous cell carcinoma. Cancer Res. 2003;63:7760–8. [PubMed] [Google Scholar]
- 17.Kim E, Kim M, Moon A. Transforming growth factor (TGF)-β in conjunction with H-ras activation promotes malignant progression of MCF10A breast epithelial cells. Cytokine. 2005;29:84–91. doi: 10.1016/j.cyto.2004.10.001. [DOI] [PubMed] [Google Scholar]
- 18.Xie L, Law B, Chytil A, Brown K, Aakre M, Moses H. Activation of the Erk pathway is required for TGF-β1-induced EMT in vitro. Neoplasia. 2004;6:603–10. doi: 10.1593/neo.04241. [DOI] [PMC free article] [PubMed] [Google Scholar]
- 19.Roman C, Morrow J, Whitehead R, Beauchamp R. Induction of cyclooxygenase-2 and invasiveness by transforming growth factor-β(1) in immortalized mouse colonocytes expressing oncogenic Ras. J Gastrointest Surg. 2002;6:304–9. doi: 10.1016/s1091-255x(01)00041-5. [DOI] [PubMed] [Google Scholar]
- 20.Sheng H, Shao J, Dixon D, et al. Transforming growth factor-β1 enhances Ha-ras-induced expression of cyclooxygenase-2 in intestinal epithelial cells via stabilization of mRNA. J Biol Chem. 2000;275:6628–35. doi: 10.1074/jbc.275.9.6628. [DOI] [PubMed] [Google Scholar]
- 21.Dixon D, Tolley N, King P, et al. Altered expression of the mRNA stability factor HuR promotes cyclooxygenase-2 expression in colon cancer cells. J Clin Invest. 2001;108:1657–65. doi: 10.1172/JCI12973. [DOI] [PMC free article] [PubMed] [Google Scholar]
- 22.Fujimoto K, Hosotani R, Wada M, et al. Expression of two angiogenic factors, vascular endothelial growth factor and platelet-derived endothelial cell growth factor in human pancreatic cancer, and its relationship to angiogenesis. Eur J Cancer. 1998;34:1439–47. doi: 10.1016/s0959-8049(98)00069-0. [DOI] [PubMed] [Google Scholar]
- 23.Wong M, Cheung N, Yuen S, Leung S, Chung L. Vascular endothelial growth factor is up-regulated in the early pre-malignant stage of colorectal tumour progression. Int J Cancer. 1999;81:845–50. doi: 10.1002/(sici)1097-0215(19990611)81:6<845::aid-ijc1>3.0.co;2-5. [DOI] [PubMed] [Google Scholar]
- 24.Takahashi Y, Kitadai Y, Bucana C, Cleary K, Ellis L. Expression of vascular endothelial growth factor and its receptor, KDR, correlates with vascularity, metastasis, and proliferation of human colon cancer. Cancer Res. 1995;55:3964–8. [PubMed] [Google Scholar]
- 25.Konno H, Tanaka T, Baba M, et al. Quantitative analysis of vascular endothelial growth factor in colon cancer. Clinical and experimental. Eur Surg Res. 1998;30:273–8. doi: 10.1159/000008587. [DOI] [PubMed] [Google Scholar]
- 26.Masunaga R, Kohno H, Dhar D, et al. Cyclooxygenase-2 expression correlates with tumor neovascularization and prognosis in human colorectal carcinoma patients. Clin Cancer Res. 2000;6:4064–8. [PubMed] [Google Scholar]
- 27.Tsujii M, Kawano S, Tsuji S, Sawaoka H, Hori M, DuBois R. Cyclooxygenase regulates angiogenesis induced by colon cancer cells. Cell. 1998;93:705–16. doi: 10.1016/s0092-8674(00)81433-6. [DOI] [PubMed] [Google Scholar]
- 28.Abdelrahim M, Safe S. Cyclooxygenase-2 inhibitors decrease vascular endothelial growth factor expression in colon cancer cells by enhanced degradation of Sp1 and Sp4 proteins. Mol Pharmacol. 2005;68:317–29. doi: 10.1124/mol.105.011825. [DOI] [PubMed] [Google Scholar]
- 29.Kim S, Seo J, Lee Y, et al. Autocrine vascular endothelial growth factor/vascular endothelial growth factor receptor-2 growth pathway represents a cyclooxygenase-2-independent target for the cyclooxygenase-2 inhibitor NS-398 in colon cancer cells. Oncology. 2005;68:204–11. doi: 10.1159/000086775. [DOI] [PubMed] [Google Scholar]
- 30.Nishikawa M, Stapleton P, Freeman T, Gaughan J, Matsuda T, Daly J. NS-398 inhibits tumor growth and liver metastasis of colon cancer through induction of apoptosis and suppression of the plasminogen activation system in a mouse model. J Am Coll Surg. 2004;199:428–35. doi: 10.1016/j.jamcollsurg.2004.05.265. [DOI] [PubMed] [Google Scholar]
- 31.Levy A, Levy N, Wegner S, Goldberg M. Transcriptional regulation of the rat vascular endothelial growth factor gene by hypoxia. J Biol Chem. 1995;270:13333–40. doi: 10.1074/jbc.270.22.13333. [DOI] [PubMed] [Google Scholar]
- 32.Shima D, Deutsch U, D'Amore P. Hypoxic induction of vascular endothelial growth factor (VEGF) in human epithelial cells is mediated by increases in mRNA stability. FEBS Lett. 1995;370:203–8. doi: 10.1016/0014-5793(95)00831-s. [DOI] [PubMed] [Google Scholar]
- 33.Claffey K, Shih S, Mullen A, et al. Identification of a human VPF/VEGF 3′ untranslated region mediating hypoxia-induced mRNA stability. Mol Biol Cell. 1998;9:469–81. doi: 10.1091/mbc.9.2.469. [DOI] [PMC free article] [PubMed] [Google Scholar]
- 34.Levy N, Chung S, Furneaux H, Levy A. Hypoxic stabilization of vascular endothelial growth factor mRNA by the RNA-binding protein HuR. J Biol Chem. 1998;273:6417–23. doi: 10.1074/jbc.273.11.6417. [DOI] [PubMed] [Google Scholar]
- 35.Bakheet T, Williams B, Khabar K. ARED 3.0: the large and diverse AU-rich transcriptome. Nucleic Acids Res. 2006;34:D111–4. doi: 10.1093/nar/gkj052. [DOI] [PMC free article] [PubMed] [Google Scholar]
- 36.Ross H, Sato N, Ueyama Y, Koeffler H. Cytokine messenger RNA stability is enhanced in tumor cells. Blood. 1991;77:1787–95. [PubMed] [Google Scholar]
- 37.Lee C, Bradley G, Ling V. Increased P-glycoprotein messenger RNA stability in rat liver tumors in vivo. J Cell Physiol. 1998;177:1–12. doi: 10.1002/(SICI)1097-4652(199810)177:1<1::AID-JCP1>3.0.CO;2-R. [DOI] [PubMed] [Google Scholar]
- 38.Halees AS, El-Badrawi R, Khabar KS. ARED Organism: expansion of ARED reveals AU-rich element cluster variations between human and mouse. Nucleic Acids Res. 2008;36:D137–40. doi: 10.1093/nar/gkm959. [DOI] [PMC free article] [PubMed] [Google Scholar]
- 39.Hollams EM, Giles KM, Thomson AM, Leedman PJ. mRNA stability and the control of gene expression: implications for human disease. Neurochem Res. 2002;27:957–80. doi: 10.1023/a:1020992418511. [DOI] [PubMed] [Google Scholar]
- 40.Denkert C, Weichert W, Pest S, et al. Overexpression of the embryonic-lethal abnormal vision-like protein HuR in ovarian carcinoma is a prognostic factor and is associated with increased cyclooxygenase 2 expression. Cancer Res. 2004;64:189–95. doi: 10.1158/0008-5472.can-03-1987. [DOI] [PubMed] [Google Scholar]
- 41.Caput D, Beutler B, Hartog K, Thayer R, Brown-Shimer S, Cerami A. Identification of a common nucleotide sequence in the 3′-untranslated region of mRNA molecules specifying inflammatory mediators. Proc Natl Acad Sci U S A. 1986;83:1670–4. doi: 10.1073/pnas.83.6.1670. [DOI] [PMC free article] [PubMed] [Google Scholar]
- 42.Shaw G, Kamen R. A conserved AU sequence from the 3′ untranslated region of GM-CSF mRNA mediates selective mRNA degradation. Cell. 1986;46:659–67. doi: 10.1016/0092-8674(86)90341-7. [DOI] [PubMed] [Google Scholar]
- 43.Audic Y, Hartley R. Post-transcriptional regulation in cancer. Biol Cell. 2004;96:479–98. doi: 10.1016/j.biolcel.2004.05.002. [DOI] [PubMed] [Google Scholar]
- 44.Bevilacqua A, Ceriani M, Capaccioli S, Nicolin A. Post-transcriptional regulation of gene expression by degradation of messenger RNAs. J Cell Physiol. 2003;195:356–72. doi: 10.1002/jcp.10272. [DOI] [PubMed] [Google Scholar]
- 45.Mukhopadhyay D, Houchen CW, Kennedy S, Dieckgraefe BK, Anant S. Coupled mRNA stabilization and translational silencing of cyclooxygenase-2 by a novel RNA binding protein, CUGBP2. Mol Cell. 2003;11:113–26. doi: 10.1016/s1097-2765(03)00012-1. [DOI] [PubMed] [Google Scholar]
- 46.Fan X, Steitz J. Overexpression of HuR, a nuclear-cytoplasmic shuttling protein, increases the in vivo stability of ARE-containing mRNAs. EMBO J. 1998;17:3448–60. doi: 10.1093/emboj/17.12.3448. [DOI] [PMC free article] [PubMed] [Google Scholar]
- 47.Erkinheimo T, Lassus H, Sivula A, et al. Cytoplasmic HuR expression correlates with poor outcome and with cyclooxygenase 2 expression in serous ovarian carcinoma. Cancer Res. 2003;63:7591–4. [PubMed] [Google Scholar]
- 48.Heinonen M, Bono P, Narko K, et al. Cytoplasmic HuR expression is a prognostic factor in invasive ductal breast carcinoma. Cancer Res. 2005;65:2157–61. doi: 10.1158/0008-5472.CAN-04-3765. [DOI] [PubMed] [Google Scholar]
- 49.D'Abaco G, Whitehead R, Burgess A. Synergy between Apc min and an activated ras mutation is sufficient to induce colon carcinomas. Mol Cell Biol. 1996;16:884–91. doi: 10.1128/mcb.16.3.884. [DOI] [PMC free article] [PubMed] [Google Scholar]
- 50.Irizarry R, Hobbs B, Collin F, et al. Exploration, normalization, and summaries of high density oligonucleotide array probe level data. Biostatistics. 2003;4:249–64. doi: 10.1093/biostatistics/4.2.249. [DOI] [PubMed] [Google Scholar]
- 51.Storey J, Tibshirani R. Statistical significance for genomewide studies. Proc Natl Acad Sci U S A. 2003;100:9440–5. doi: 10.1073/pnas.1530509100. [DOI] [PMC free article] [PubMed] [Google Scholar]
- 52.Schefe J, Lehmann K, Buschmann I, Unger T, Funke-Kaiser H. Quantitative real-time RT-PCR data analysis: current concepts and the novel “gene expression's CT difference” formula. J Mol Med. 2006;84:901–10. doi: 10.1007/s00109-006-0097-6. [DOI] [PubMed] [Google Scholar]
- 53.Rubie C, Kempf K, Hans J, et al. Housekeeping gene variability in normal and cancerous colorectal, pancreatic, esophageal, gastric and hepatic tissues. Mol Cell Probes. 2005;19:101–9. doi: 10.1016/j.mcp.2004.10.001. [DOI] [PubMed] [Google Scholar]
- 54.DuBois R, Awad J, Morrow J, Roberts L, Bishop P. Regulation of eicosanoid production and mitogenesis in rat intestinal epithelial cells by transforming growth factor-α and phorbol ester. J Clin Invest. 1994;93:493–8. doi: 10.1172/JCI116998. [DOI] [PMC free article] [PubMed] [Google Scholar]
- 55.Bakheet T, Frevel M, Williams B, Greer W, Khabar K. ARED: human AU-rich element-containing mRNA database reveals an unexpectedly diverse functional repertoire of encoded proteins. Nucleic Acids Res. 2001;29:246–54. doi: 10.1093/nar/29.1.246. [DOI] [PMC free article] [PubMed] [Google Scholar]
- 56.Khabar K, Bakheet T, Williams B. AU-rich transient response transcripts in the human genome: expressed sequence tag clustering and gene discovery approach. Genomics. 2005;85:165–75. doi: 10.1016/j.ygeno.2004.10.004. [DOI] [PubMed] [Google Scholar]
- 57.Zhang B, Kirov S, Snoddy J. WebGestalt: an integrated system for exploring gene sets in various biological contexts. Nucleic Acids Res. 2005;33:W741–8. doi: 10.1093/nar/gki475. [DOI] [PMC free article] [PubMed] [Google Scholar]
Associated Data
This section collects any data citations, data availability statements, or supplementary materials included in this article.
Supplementary Materials
Note: Supplementary data for this article are available at Molecular Cancer Research Online (http://mcr.aacrjournals.org/).