Abstract
The laser-Doppler vibrometer (LDV) is a research tool that can be used to quickly measure the sound-induced velocity of the tympanic membrane near the umbo (the inferior tip of the malleus) in live human subjects and patients. In this manuscript we demonstrate the LDV to be a sensitive and selective tool for the diagnosis and differentiation of various ossicular disorders in patients with intact tympanic membranes and aerated middle ears. Patients with partial or total ossicular interruption or malleus fixation are readily separated from normal-hearing subjects with the LDV. The combination of LDV measurements and air-bone gap can distinguish patients with fixed stapes from those with normal ears. LDV measurements can also help differentiate air-bone gaps produced by ossicular pathologies from those associated with pathologies of inner-ear sound conduction such as a superior semicircular canal dehiscence.
The key audiological tool for defining conductive hearing loss is the air-bone gap, which is the difference between air-conducted and bone-conducted hearing levels. The pathology associated with such gaps may, in certain cases, be readily observable during otoscopic examination, for example, cerumen impaction, perforations of the tympanic membrane (TM), acute otitis media, chronic otitis media, etc. However, the diagnosis of the precise pathology causing a conductive hearing loss in patients with an intact TM is difficult, and conclusive diagnosis is often only made at the time of exploratory middle ear surgery.
Although there are tools available for presurgical diagnosis of such disorders, they have imperfect selectivity and sensitivity. Tympanometry and acoustic-reflex testing, in conjunction with audiometry, are sensitive to different ossicular disorders (Jerger, 1975; Margolis & Shanks, 1985), for example (1) a normal tympanogram coupled with a lack of ipsilateral acoustic reflex and a significant air-bone gap that is either flat or upward sloping with increasing frequency is usually associated with stapes fixation. (2) A hypomobile tympanogram with a loss of reflex thresholds and a mild to moderate conductive loss is often associated with malleus fixation. (3) A hyper-mobile tympanogram with a loss of ipsilateral reflex and either a 50-dB flat or downward sloping conductive loss is usually associated with either a total or partial ossicular disarticulation.
A major problem with the above scheme is that standard single-frequency (226 Hz) tympanometry is relatively insensitive to ossicular disorders and many ears with fixed or interrupted ossicular chains are not reliably differentiated by this technique. The selectivity and sensitivity of tympanometry to ossicular disorders can be improved by measurements at multiple frequencies (Lily, 1984; Margolis & Goycollea, 1993; Zhao, et al., 2002), or by the use of wide-band energy reflectance (Feeney, Grant, & Marryott, 2003). The sensitivity and selectivity of these refined techniques in the diagnosis of ossicular disorders are areas of continuing study.
One source of variability in tympanometry and reflectance measurements is that they are acoustic-based techniques that use measures of the sound pressure produced by stereotypical stimuli to estimate the mobility of the entire TM. This dependence on the mobility of the entire TM means that sections of the TM that surround the ossicular attachment can have a significant influence on the measurement results and even mask alterations in the motion of the ossicular system. For example, the high mobility of a thin, dimeric TM would mask an ossicular fixation. The laser-Doppler vibrometer (LDV), which can directly measure the motion at the input of the ossicular chain (Goode, Ball, & Nishihara, 1993; Goode, Ball, Nishihara, & Nakamura, 1996; Huber, et al., 2001; Whittemore, Merchant, Poon, & Rosowski, 2004), is immune to such masking effects, and is hypothetically a superior indicator of different types of ossicular pathology (Huber, et al., 2001; Rosowski, Mehta, & Meerchant, 2003). The rest of this article will describe tests of the diagnostic selectivity and sensitivity of the LDV in various conductive disorders. We will first summarize LDV measurements in normal ears, and then describe the results of LDV measurements from a series of patients with conductive hearing loss that arose from known ossicular pathologies. Lastly, we will discuss the utility of the LDV in diagnosing superior semicircular canal dehiscence, an inner-ear cause of conductive hearing loss.
Methods
Instrumentation and Procedures
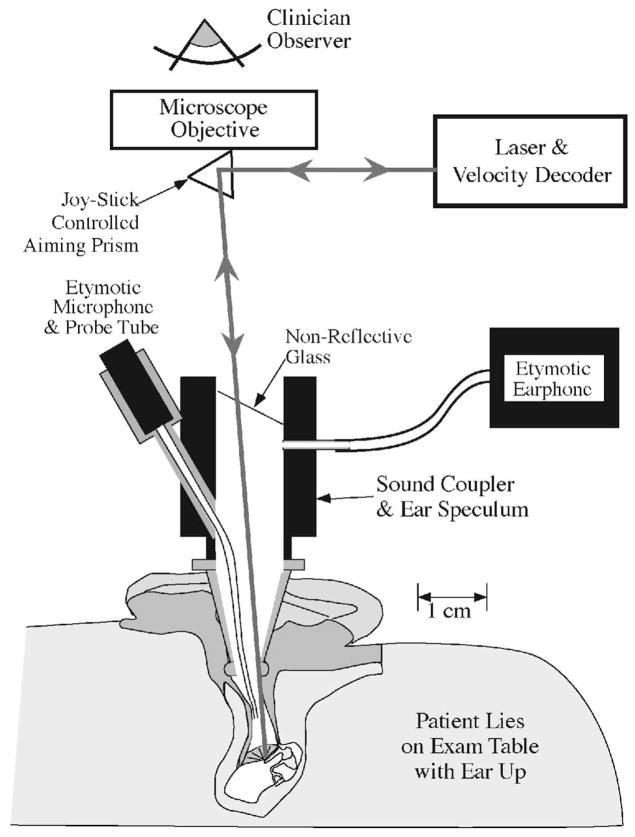
The measurement protocol and the procedures for the recruitment of subjects were approved by the Institutional Review Board of the Massachusetts Eye and Ear Infirmary. Measurements were made in clinic patients with conductive or mixed hearing loss, as well as in research subjects with either normal hearing or sensorineural hearing loss. The technique is fast, noninvasive, and patients do not find the measurements uncomfortable. The patients-subjects laid on their back on an examination table with the study ear up. The clinician examined the TM with the aid of a speculum and an operating microscope. After ensuring the canal was clear of cerumen and other obstructions, a glass-backed sound coupler (Polytec PI) with an attached earphone and probe microphone (Etymotic® ER3 and ER7, respectively) was attached to the speculum. The microphone probe was a nylon tube whose tip came within 2 to 5 mm of the central part of the tympanum. The beam of a Polytec HLV-1000 LDV, mounted on the microscope, was focused through the glass onto the TM via a joystick-controlled aiming prism (Fig. 1). Laser-Doppler vibrometry works by comparing the frequency of the outgoing light with the frequency of reflected light from the moving surface, where the frequency of the reflected light is modulated by the velocity of the reflecting object. The accuracy of the comparison of the outgoing and reflected light depends on the amplitude of the reflected light that returns to the velocity decoder. A too-small amplitude of reflected light leads to increased noise in the velocity estimate.
Fig. 1.
Laser Doppler vibrometry methods (after Whittemore, Merchant, Poon, & Rosowski, 2004). The patient lies supine on an examination table with the ear turned up. A speculum and operating microscope are used to examine the ear and observe the umbo of the malleus. A glass-backed sound coupler with attached microphone and earphone is attached to the speculum and the beam of the laser is focused through the glass onto the TM with the aid of a joystick-controlled prism. The light reflected from the TM travels back to the laser’s velocity decoder via the same optical path. A comparison of the frequencies of the transmitted and reflected light allows computation of the velocity of oscillation of the sound-driven TM.
The point of the laser’s focus was a location near the umbo within the “light reflex ” (Fig. 2). The light reflex corresponds to the portion of the TM that is orthogonal to the light path down the ear canal, and is a position from which significant laser light will be reflected back up the ear canal to the detector in the laser decoder. The location of the light reflex varies between and within individual ears as the relative position of the speculum and the TM varies with repeated measurement. This variability in focus location has consequences to the repeatability of LDV measurements. In some laboratories that perform LDV measurements in human patients and subjects, the variability in natural reflection is reduced by the placement of small reflective beads or mirrors at the patients’ or subjects’ umbo (Dalhoff, Turcanu, Zenner, & Gummer, 2007; Goode, et al., 1993, 1996; Huber, et al., 2001; Rodriguez Jorge, Zenner, Hemmert, Burkhardt, & Gummer, 1997). We decided, however, that the utility of the LDV measurment would be proportional to its ease of use and opted not to complicate the methods by the placement and retrieval of reflectors. Our methods then restrict our measurements to areas of natural reflection.
Fig. 2.
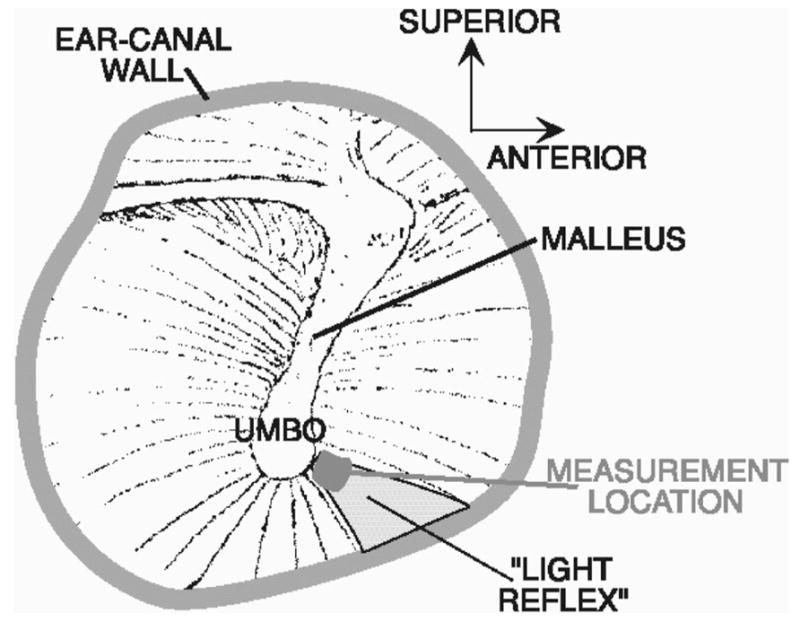
Focusing the laser in the bright “light-reflex” area near the umbo of the malleus in a right ear.
The synthesis and control of the sound stimulus as well as the response measurement was performed by a personal computer with a signal generation and analysis card (a DSP-16, Arial Corp.) and software (SysId, SysId Industries). The sound stimulus consisted of nine harmonically related tones (300, 500, 700, 1000, 1500, 2000, 3000, 4000, and 6000 Hz) that were presented simultaneously. The percept was of a somewhat discordant musical chord. The tone complex was 1 sec in duration and could be varied in level from 50 to 90 dB SPL, though to maximize signal to noise, the measurements were usually made at maximum stimulus level. The voltage output of the LDV velocity decoder and the probe tube microphone within the ear canal were digitized by the computer simultaneously with stimulus presentation. Fourier analysis was used to define the components of the response spectra at harmonics of 100 Hz. The measurement sequence was repeated multiple times (3 to 10) until three to five measurements with good signal to noise were obtained. The measurements were fast; generally, 5 to 10 min elapsed between the time the patient lay on the table and the completion of measurements in both ears.
The signal to noise ratio was quickly estimated for each individual measurement (Whittemore, et al., 2004) by comparing the measured spectral components at stimulus frequencies (300, 500, 700, etc.) to the component magnitudes at the in-between frequencies (100, 200, 400, 600, etc.). This near instantaneous estimation of noise level was essential. As noted previously, the noise in the LDV’s velocity output varies inversely with the strength of the reflected light returning to the velocity decoder. Small relative motions between the microscope and the patient can lead to significant variations in reflected light and associated noise. Also, even in cases of optimum reflection, our techniques yield a lower limit of velocity detection of about 0.003 mm/sec (−50 dB re 1 mm/sec). In general, we only show data in which the signal to noise ratio is greater than or equal to 20 dB.
The final outcome measures from the LDV and microphone measurements were the ratios of the measured magnitudes of the TM velocity near the umbo and the ear-canal sound pressure at each stimulus frequency, and the difference in response phase angle between the velocity and sound pressure. We call these respective quantities the magnitude and the angle of the umbo-velocity transfer function, HU. For ease of comparison with air-bone gap measurements in dB, we display a dB value of the transfer-function magnitude, where dB(HU) = 20 log 10 (HU).
Patient and Subject Selection
Measurements were made in over 300 subjects and patients recruited from the staff and patients at the Massachusetts Eye and Ear Infirmary. Patients were recruited from the Otology and Audiology clinics. All patients or subjects were more than 18 years of age, and our oldest subject was 80 years old. From this population we defined 56 subjects with at least one audiologically normal ear, with air and bone thresholds no greater than 20 dB HL at all test frequencies. (This definition of normal ears allowed air-bone gaps that were 15 dB or smaller.) In subjects who had two normal ears, we randomly selected one ear for inclusion in the normal group, so as not to bias the normal statistics toward the subjects with two normal ears (Whittemore, et al., 2004). This normal group ranged in age from 20 to 60 years old. We also defined a group of 47 patients-subjects ears with pure sensorineural loss (air and bone thresholds greater than 20 dB HL at more than one frequency with air-bone gaps no larger than 15 dB at any one frequency). This sensorineural group ranged in age from 25 to 80 years old (Whittemore, et al., 2004).
Over 100 patients presented with conductive or mixed hearing losses with intact TMs and suspected ossicular disorders, and were candidates for exploratory middle ear surgery. Of the patients in this group, 57 were confirmed to have stapes fixation during subsequent surgery, 16 were confirmed to have a total or partial interruption of the ossicular chain, and 5 were confirmed to have a fixed malleus. In the first 30 of these patients, the surgeon was kept blind of the outcome of the LDV tests; however, a significant fraction of the later surgical diagnoses were made with knowledge of our measurement results.
Results
LDV Measurements in Subjects with Normal Hearing
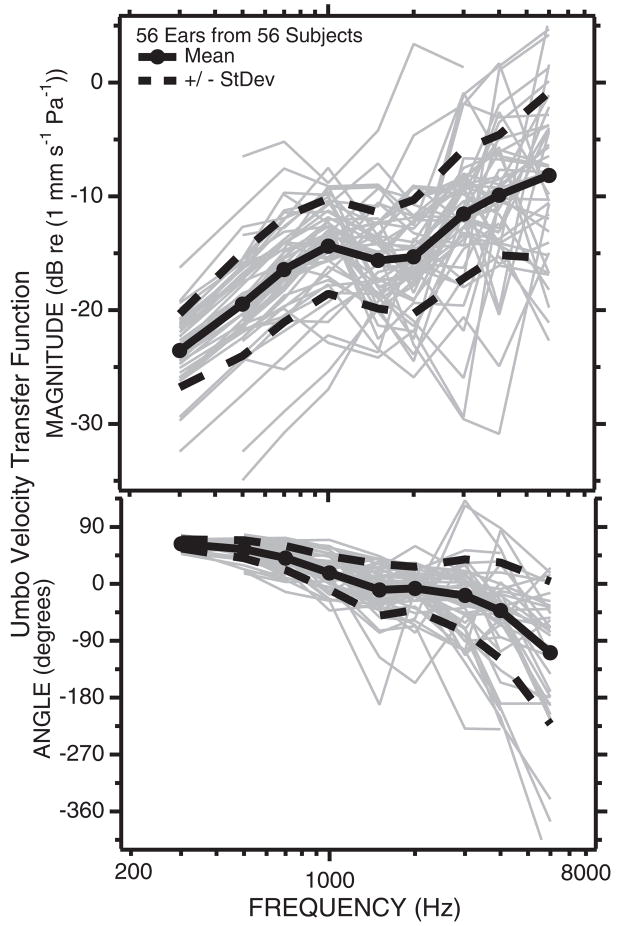
LDV determined umbo-velocity transfer functions in ears from 56 normal-hearing subjects (Fig. 3) show a wide range of variability with a magnitude range at any one frequency of a little larger than an order of magnitude (20 dB), and an angle range that increases with stimulus frequency, from ±10 degrees at 300 Hz to ±180 degrees (a range of a full cycle) at 6000 Hz. The mean and the mean ± 1 standard deviation of the dB values of the velocity magnitude are shown as the thick solid and dashed lines; the standard deviation has a magnitude of about 6 dB (a factor of 2). The mean and the mean ± 1 standard deviation of the velocity angles are similarly indicated by thick solid and dashed lines.
Fig. 3.
The umbo-velocity transfer function in 56 normally hearing ears. The gray lines are individual measurements of the dB magnitude (upper panel) and angle in degrees (lower panel) of a transfer function from one normally hearing ear in 56 subjects with at least one normal ear. Also illustrated are the means (filled circles and solid black lines) ± the standard deviations (dashed black lines) for the population. The ±6 dB standard deviation range in magnitude suggest that 66% of normal ears fall into a velocity range of the mean ± 6 dB. The standard deviation of the phase angle depends on stimulus frequency and increases as frequency increases (after Whittemore, Merchant, Poon, & Rosowski, 2004).
At frequencies of 700 Hz and below the umbo-velocity transfer function suggests the ear is stiffness dominated; the magnitude of the transfer function is proportional to frequency and the phase angle is 45 to 90 degrees (the phase of the velocity leads the phase of the sound pressure by 45 to 90 degrees). The transfer-function magnitude shows a peak and an angle of zero at 1000 Hz, consistent with a middle ear resonance near that frequency. At frequencies above 2000 Hz, the umbo-velocity transfer function increases in magnitude and the phase becomes more negative. The high-frequency increase in transfer-function magnitude is not generally seen in animal or temporal-bone measurements of umbo velocity (Whittemore, et al., 2004), but is consistent with measurements of the sound-induced velocity at locations near the umbo (Decraemer, Khanna, & Funnell, 1989).
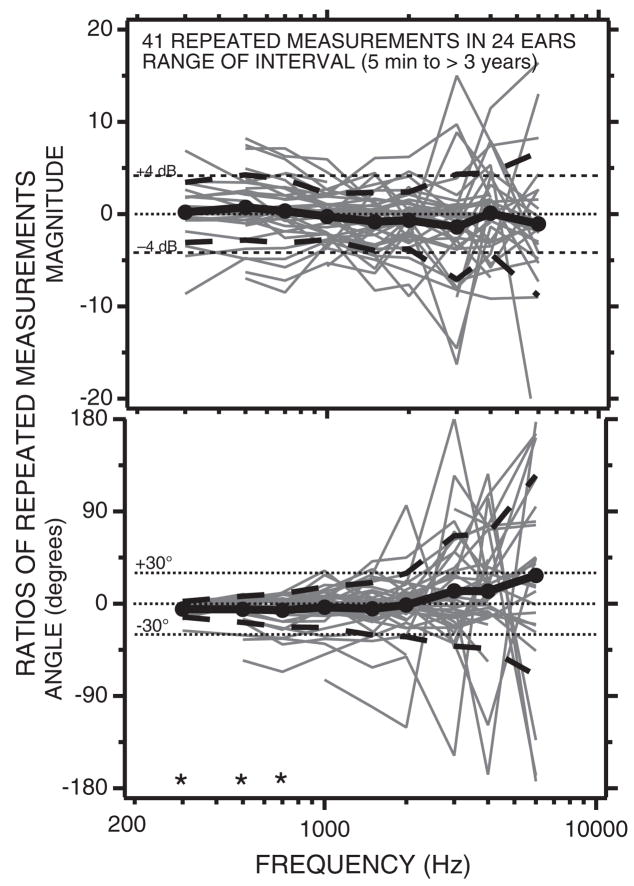
Whittemore, et al. (2004) evaluated whether the relatively large (20 dB range) variability we observed in the umbo-velocity measurements of Figure 3 resulted from variations within or between subjects, by making repeated LDV measurements in selected subjects. Whittemore, et al. found several degrees of variation in repeated measurements: (1) measurements made within seconds of the initial measurement without allowing the subject to move and while maintaining the position of the speculum in the ear canal and the position of the microscope relative to the ear were essentially identical, with changes in magnitude that were generally less than 1 dB and angles within a few degrees of the original measurement. (2) Measurements made after removing the speculum, moving the microscope, and allowing the subject to move her or his head resulted in wider (±2 to 4 dB) variations (Fig. 4) that were similar in magnitude whether the interval between measurements was a few minutes or several years. These longer-term repeated measurements are summarized in Figure 4, which shows the dB change in umbo-velocity transfer-function magnitude and the change in angle observed in 41 repeated measurements collected from 24 ears. All the 24 ears were measured at least twice and one ear was measured five times; in each case the initial measurement made was used as the standard for comparison. In general, the short- and long-term repeated measurements were repeatable within 4 dB in magnitude and ±30 degrees in angle, with the largest variations in magnitude and angle observed at frequencies above 2000 Hz.
Fig. 4.
The magnitude (in dB) and angle of 41 ratios of repeated and initial LDV measurements made in 24 ears. A magnitude of 0 dB and an angle of 0 are indicative of perfect repeatability. The filled circles and the thick solid black lines illustrate the mean magnitude and angle of the 41 repetitions. The thick black dashed lines are ±1 standard deviation around the mean. The mean magnitudes are not significantly different from 0 dB. The mean angles at 300, 500, and 700 (labeled with *) were shown by one-tailed Student t test to be significantly different from 0 at the p < 5% level. (After Whittemore, Merchant, Poon, & Rosowski, 2004.)
As discussed above, one likely source of variation in the repeated measurements of Figure 4, which were made after removing the ear speculum and allowing the subject to move about for minutes or days before remeasurement, are small differences in the placement of the focal spot of the laser near the umbo. The light reflex is not a fixed anatomical location, but depends on the precise position of the subject relative to the microscope’s light source. Therefore, the location of the reflex varies with the position of the head relative to the microscope as well as variations in the placement of the speculum in the ear canal. Decreamer, Khanna, and Funnell demonstrated that sound-induced displacements of TM locations near the umbo can differ in their response to sound and that these differences are larger with higher-frequency sound stimulation.
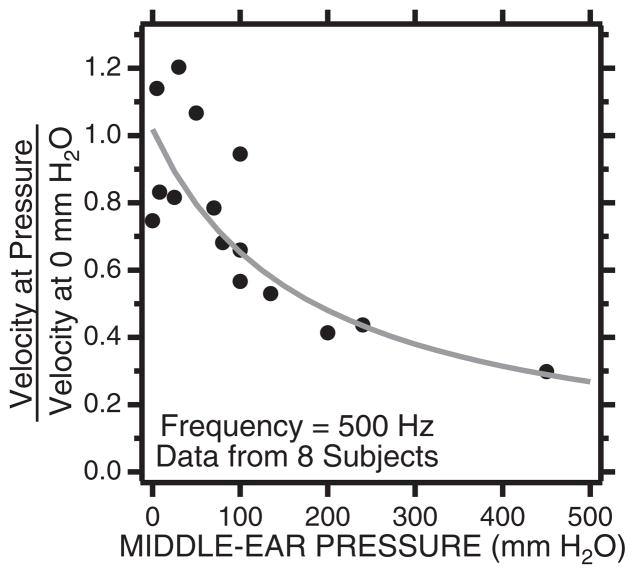
A second source of potential variation is nonzero middle ear static pressure, which can stiffen the TM and reduce the middle ear’s response to low-frequency sound (Wever & Lawrence, 1954). Whittemore, et al. (2004) investigated this possibility in eight subjects, in which tympanometry was used to measure middle ear static pressure after the subjects were asked to either (a) perform Valsalva maneuvers that resulted in increased middle ear static pressures, or (b) swallow to equalize middle ear pressure with ambient pressure. Tympanometry was performed both before and after the LDV measurement and we only show measurements in which the pressure did not change while the velocity measurement was made. One subject, an avid amateur SCUBA diver, was able to produce middle ear pressures as large as 400 mm H2O (about 400 daPa) after a Valsalva. Middle ear pressures that were greater than 100 mm H2O always led to decreases in the umbo velocity produced by stimulus frequencies less than 1000 Hz (Whittemore, et al., 2004). The effect of these pressure changes on the velocity measured at 500 Hz is summarized in Figure 5.
Fig. 5.
The ratio of velocity measured with nonzero middle ear pressure and the velocity measured with 0 middle ear pressure. The stimulus is a 500 Hz tone. The velocity ratio decreases as a hyperbolic function with pressure as is predicted by a middle ear compliance that is inversely proportional to static pressure. A ratio of 0.3 is equivalent to a 10 dB reduction in velocity.
Our usual broadband stimuli of 70 to 90 dB SPL and 1 sec duration surpass the threshold of the acoustic-reflex threshold in normal ears (Feeney & Keefe, 2001; Feeney, Keefe, & Sanford, 2004; Stach & Jerger, 1984; Wilson, 1981; Wilson & McBride, 1978). Whittemore, et al. (2004) investigated the possible contribution of reflex activation to the measured umbo velocity by making measurements with stimulus levels that varied from about 60 to 90 dB SPL. The results of such measurements are consistent with essentially linear growth of umbo velocity with stimulus sound pressure and suggest that the contribution of the acoustic reflex to our measurements is negligible.
Whittemore, et al. (2004) also investigated whether there was any correlation between umbo-velocity transfer functions and hearing threshold in the normal subject population. The only significant correlation (p ≈ 1%) observed was between the measured magnitude of the transfer functions at 2000 Hz and the bone-conduction threshold at 1000 Hz. However, even at this significance level, the correlation between audiometry and umbo velocity only explained about 14% of the variation in the measured velocities. Somewhat more significant (p ≈ 0.1%) correlations were observed between the transfer-function magnitudes at 1500 and 2000 Hz and the air-bone gap at 500 and 1000 Hz. (Our definition of normal ears allowed air-bone gaps that were 15 dB or smaller.) However, these correlations explained less than 25% of the variance in the umbo-velocity measurements. Whittemore, et al. (2004) concluded that some small fraction of the variance observed in umbo-velocity measurements in normally hearing ears may be related to the presence of small air-bone gaps.
LDV in Ears with Sensorineural Hearing Loss
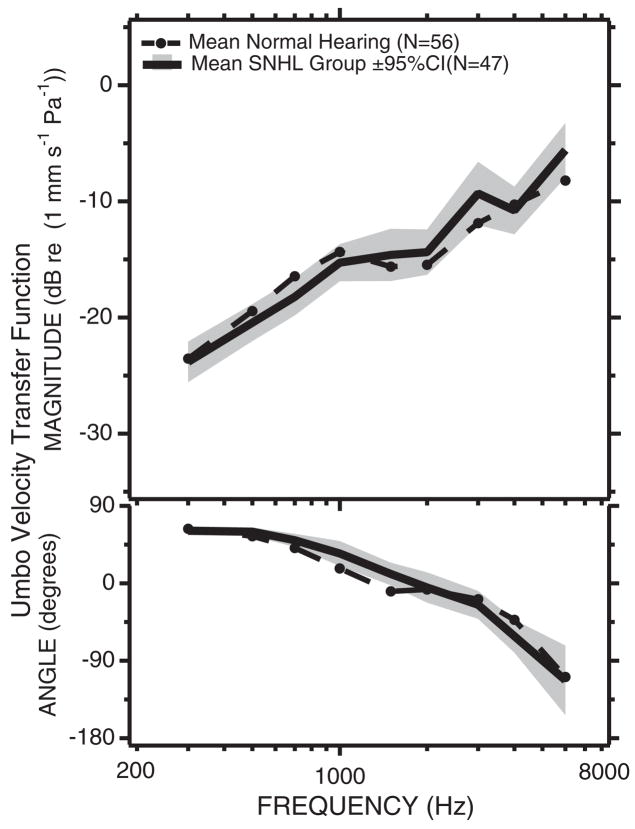
Several authors (Goode, et al., 1993, 1996; Rodriguez Jorge, et al., 1997) have suggested that umbo velocity might be sensitive to sensorineural hearing loss. To address this question Whittemore, et al. (2004) measured the umbo-velocity transfer function in a collection of 47 ears, ranging in age from 25 to 80 years, with sensorineural hearing loss. No significant differences were observed between the magnitudes of the transfer function in the normal-hearing and sensorineural-hearing-loss groups (Fig. 6). Small differences were observed in the angle of the transfer function measured in the two groups, but these differences were less than the variations within each group.
Fig. 6.
Comparisons of the mean and 95% confidence limits of the mean of the umbo-velocity transfer function measured in 56 ears with normal hearing and 47 ears with sensorineural hearing loss. The dB values of the magnitudes are illustrated in the upper panel. The comparison of the angles is in the lower panel (after Whittemore, Merchant, Poon, & Rosowski, 2004). The differences observed in magnitude are not significant at the 5% level. The differences in angle at 1000 and 1500 Hz are significant at the p < 5%.
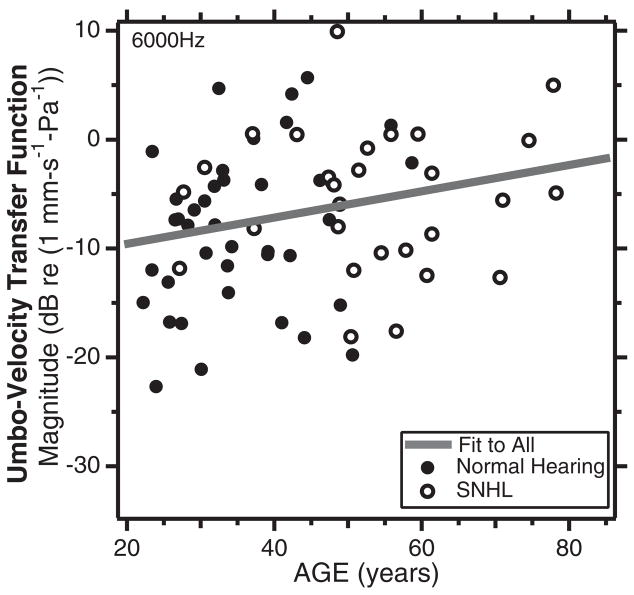
Unlike the normal-hearing group, the sensorineural hearing loss group has a large number of subjects over 50 years in age. The similar velocities measured in the ears with normal hearing and sensori-neural hearing loss (Fig. 6) allowed Whittemore, et al. (2004) to combine the two groups and investigate the effects of age on umbo velocity. Correlation and regression analysis between the magnitude of the umbo-velocity transfer function and age were non-significant, except for the correlation between transfer-function magnitude at 6000 Hz and age of the subject with p < 5% (Fig. 7). Although statistically significant, the correlation explained less than 6% of the variance in the population and the regression slope suggested only a small increase in umbo velocity at 6000 Hz with age (about 1 dB every 7.7 years).
Fig. 7.
A plot of the magnitude of the umbo-velocity transfer function at 6000 Hz vs. age in normal hearing ears (the filled circles) and ears with sensorineural hearing loss (the open circles). The correlation between the velocities and age (R = 0.24) is significant at the p = 5% level. The slope of the regression line suggests an increase in velocity of 1 dB with every 7.7 years of age (After Whittemore, Merchant, Poon, & Rosowski, 2004).
Audiometry in Ears with Ossicular Disorders and Intact TMs
The LDV was used to measure the umbo-velocity transfer function in 78 ears with ossicular disorders that were identified at the time of exploratory surgery. These patients had intact TMs and aerated middle ears. The air-bone gap measurements of Figure 8 and the LDV measurements of Figure 9 were made before surgical exploration. Of the 78 ears, 57 were identified with fixed stapes, 5 ears had fixed malleii and 16 were confirmed to have either partial or complete interruptions of the ossicular chain, including fractures of the manubrium and the malleus neck, and resorption of the long process of the incus.
Fig. 8.
Air-bone gaps measured in patients with surgically confirmed ossicular disorders. Measurements in individual ears are illustrated with thin gray lines. The mean at each frequency is shown by the symbols and thick black lines. The bars represent the standard deviation. The plotting format is similar to an audiogram with larger gaps and poorer hearing plotted below the origin. A, The air-bone gap in 57 ears with stapes fixation. B, The air-bone gap in five ears with fixed malleus. C, The air-bone gap in 16 ears with either partial or total interruption of the ossicular chain. The points labeled by an * where shown by one-tailed Student t test to be significantly different (p < 5%) from zero.
Fig. 9.
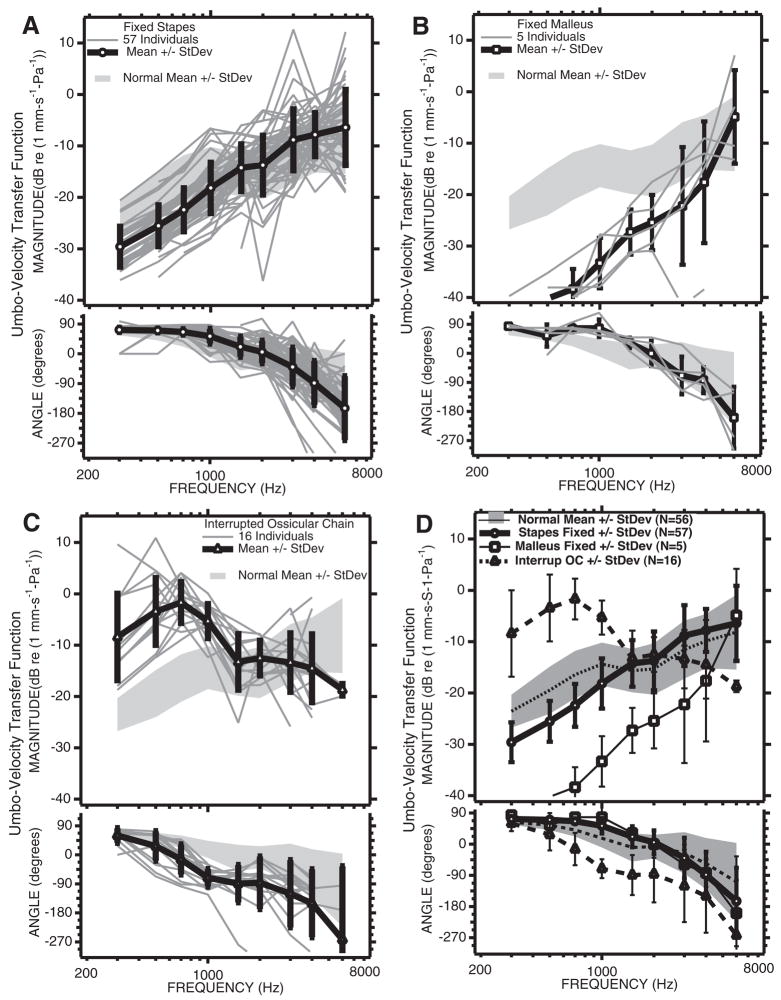
Comparisons of the individuals and means and standard deviations of the LDV measurements from the three groups of patients with ossicular disorders with the mean and standard deviation of the normal population. A, LDV Measurements from 57 ears with surgically confirmed fixed stapes. B, LDV measurements from five ears with fixed malleus. C, LDV measurements from 16 ears with partial or total ossicular interruption. D, Comparisons of the means and standard deviations from the three pathological groups with the mean and standard deviation of the normal group.
The 57 ears with fixed stapes on average had air-bone gaps at varied frequencies that ranged from 48.5 to 16.5 dB (Fig. 8A). Most of the individuals showed gaps that were largest at lowest frequencies and decreased in magnitude as frequency increased to 2000 Hz. A few ears however, showed relatively flat air-bone gaps of 40 to 50 dB. On average, the gap was largest at the lowest frequencies (48.5 dB at 250 Hz), with the smallest air-bone gap at 2000 Hz (16.5 dB). The smaller gaps observed at 2000 Hz are likely a reflection of Carhart’s notch (Carhart, 1952), a decreased sensitivity to bone-conducted stimuli that is related to conductive impairment. The standard deviation of the fixed-stapes group was about 12 dB regardless of frequency. One-tailed Student t tests showed the gaps with fixed stapes were statistically different from zero at the p < 1% or better level at 250, 500, 1000, and 4000 Hz.
The five ears with surgically confirmed fixed mallei had a pattern and amount of hearing loss that was similar to the fixed-stapes group, with average air-bone gaps that ranged from 40.8 dB at 250 Hz to 7.5 at 2000 Hz (Fig. 8B). The individual ears all showed larger gaps at the lower frequencies. The standard deviations at each frequency were a little smaller than that of the fixed-stapes population (about 8 dB) except at 2000 Hz where deep Carhart-like notches in the bone-conduction scores of two ears caused negative air-bone gaps that contributed to a standard deviation of nearly 25 dB. The average and individual gaps at lower frequencies were less variable in the fixed-mallei group than in the fixed-stapes group: The average gaps between 250 and 1000 Hz were about 35 dB. One-tailed Student t tests showed the gaps with fixed malleus were statistically different from zero at the p < 2.5% or better level at 250, 500, and 1000 Hz, but the gaps at higher frequencies were not different from zero.
The 16 ears with partial or total interruptions of the ossicular chain showed the largest variations in air-bone gap. These differences result from large variations in the individual patterns of conductive loss, including ears with the largest gaps at high frequencies, ears with the largest gaps at low frequencies, and ears with relatively flat 40 to 50 dB air-bone gaps. On average, the gap was between 27 and 40 dB with the largest gap at the highest frequency (4000 Hz). The standard deviations at each frequency ranged from 25 dB at the lower frequencies to 12 dB at 4000 Hz. Some of this variation was caused by the variation in the degree of ossicular interruption. Ears with 50 to 70 dB air-bone gaps at all frequencies were associated with total ossicular interruptions, whereas ears with the largest gaps at the higher frequencies had a partial interruption sometimes characterized as a “fibrous union”. One-tailed Student t tests showed that only the gaps measured at 2000 and 4000 Hz were statistically different from zero (p < 5%).
LDV Measurements in Ears with Ossicular Disorders and Intact TMs
The LDV measurements made before surgery in the three ossicular disorder groups are illustrated in Figure 9. The magnitude and angle of the umbo-velocity transfer function in the fixed-stapes group (Figs. 9A, D) are similar in variation and range to that observed in normal ears (Fig. 3). On average, however, the magnitude of umbo velocity in the fixed-stapes group is about 6 dB smaller than the average in normal ears at frequencies of 1000 Hz and below (Fig. 9D). This difference in magnitude is statistically significant at p < 0.1% in the same low-frequency range and less significant (p < 2%) at 3000 and 4000 Hz. The average angles measured with fixed stapes are also a few degrees larger than in the normal group at 1500 Hz and lower (where those differences are significant at the p < 0.1% level). These low-frequency differences in magnitude and angle are consistent with a small increase in the stiffness of the TM-ossicular system with stapes fixation.
Larger differences from the normal-ear data are seen in the 5 fixed-malleus ears in which the velocities measured at the lowest frequencies are 15 to 25 dB lower than those measured in normal ears (Figs. 9B, D). Larger differences are also visible between the angles of the fixed-malleus and normal groups at 700 and 1000 Hz, with the fixed-malleus group mean angles being larger by nearly 30 to 45 degrees. The standard deviation of the velocity magnitudes measured in the fixed-malleus group are about 5 dB at frequencies of 1500 Hz and lower, but very large at higher frequencies where one of the ears has a velocity magnitude that is more than 20 dB smaller than normal and the other ears show velocities that are more nearly normal in magnitude. The differences in magnitude between the fixed malleus and the normal means are statistically significant (p < 5% or smaller) at frequencies of 4000 Hz and less (p < 0.1% at frequencies of 1000 and lower), and the angles in the fixed-malleus group are significantly different from normal (p < 5%) at 300, 700, 1000 and 1500 Hz. The low-frequency decreases in magnitude and increase in angle relative to normal are consistent with malleus fixation producing a large (an order of magnitude) increase in the stiffness of the tympano-ossicular system.
The 16 ears of the ossicular-interruption group also show large differences from normal velocity at low frequencies, but of opposite direction: The magnitudes are significantly (p < 0.1%) higher than normal at frequencies of 1000 Hz and lower, and the angles are significantly (p < 0.1%) decreased relative to normal at frequencies of 500 to 4000 Hz (Figs. 9C, D). Together, these changes suggest a significant decrease in the stiffness of the auditory system after ossicular interruption. Ossicular interruption produced the largest increases in umbo-velocity magnitude (16 dB on average) at 700 Hz, and the largest decrease in average angle (almost 90 degrees) at 1000 Hz and higher frequencies.
The means and standard deviations of the velocities of the three conductive-hearing loss groups are compared with those of the normals in Figure 9D. This comparison reinforces the observation that the largest differences between the three pathological and the normal magnitudes occur at frequencies of 1000 Hz and lower. The 5 to 6 dB differences in magnitude between the stapes-fixed and normal populations are statistically significant (p < 0.1%) at frequencies less than 1500 Hz. The other pathologies also are associated with significant differences in mean velocity from normal (p < 0.1%) over a similar frequency range. The magnitudes of the three pathologies are also significantly different from each other (p < 0.1%) at frequencies of 1000 Hz and less. The fixed-malleus mean magnitudes are at least 10 dB smaller than the fixed-stapes means at frequencies less than 1500 Hz and the ossicular-interrupted mean magnitudes are 20 dB larger than the fixed-stapes mean at frequencies of 700 Hz and lower. The differences in mean magnitude of the three groups decrease at higher frequencies. The bottom panel of Figure 9D compares the mean angles and standard deviations of the four groups. The differences between the normal and ossicular-fixed groups are largest at 1000 Hz, whereas the mean angle of the ossicular-interruption group shows a delay of at least 45 degrees relative to the other groups at frequencies between 700 and 4000 Hz.
Comparison of Audiometry and LDV Measurements in Ears with Ossicular Pathology and Intact TMs
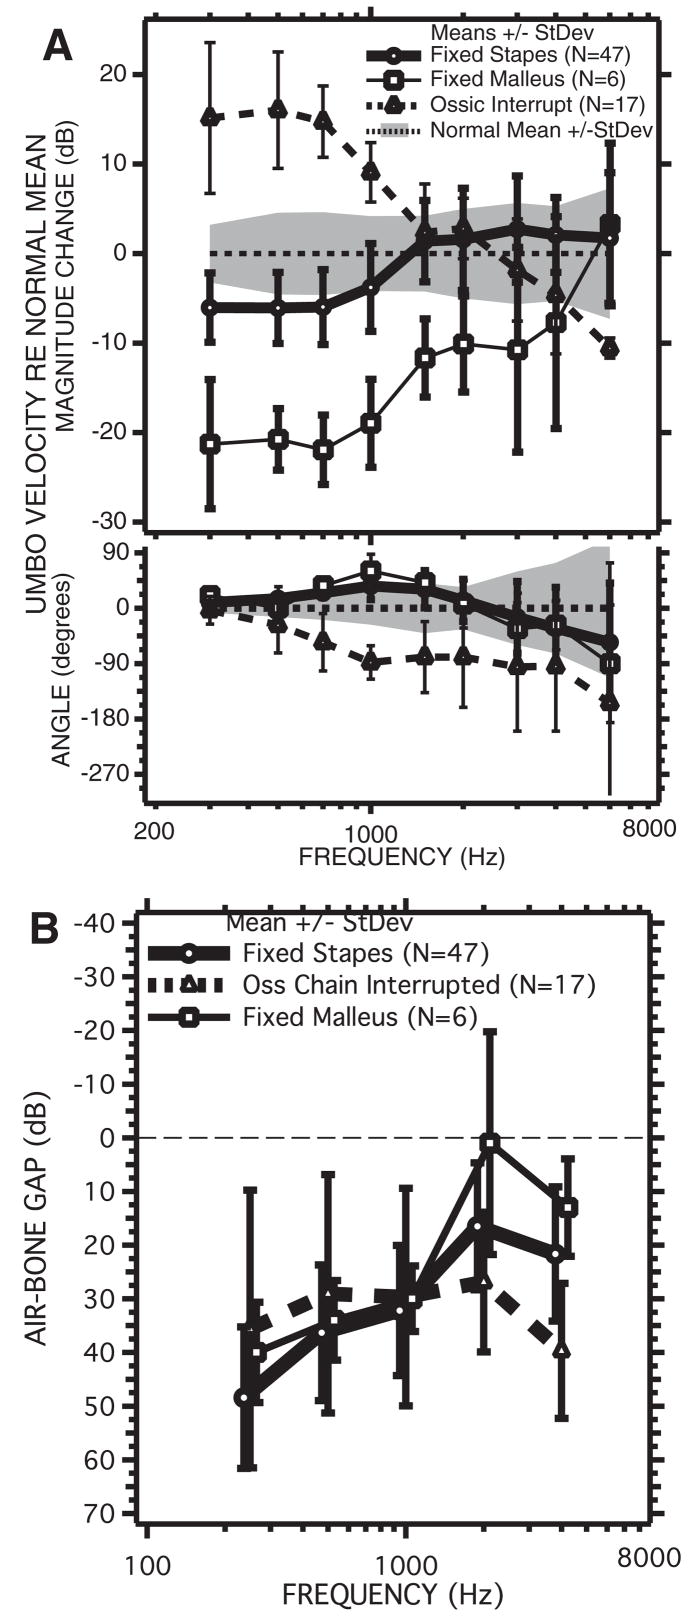
How do the air-bone gaps observed in the three types of ossicular disorders compare with the observed changes in the umbo-velocity transfer function? Figure 10 allows direct comparison of the pathology-associated changes in the means of the transfer functions (Fig. 10A) and the mean air-bone gaps from each of the three pathologies (Fig. 10B). As previously noted, the low-frequency magnitudes of the mean transfer functions for the three pathologies are clearly separable, though there is significant overlap between the standard deviations of the normal and fixed-stapes populations. On the other hand, the mean air-bone gaps measured in the three populations overlap greatly. The gaps in the fixed-malleus and fixed-stapes groups are statistically indistinguishable except at 250 Hz where one-tailed Student t tests suggest that the probability the two populations are the same is less than 5% (p = 4.5%). The gaps in the interrupted ossicular chain group are statistically separable from the fixed-malleus group at 4000 Hz (p < 0.1%) and the fixed-stapes group at 2000 (p < 1%) and 4000 Hz (p < 0.1%).
Fig. 10.
The mean changes in umbo-velocity transfer function and air-bone gap associated with the three ossicular pathologies: fixed-stapes (circles), fixed-malleus (squares), and ossicular-interruption (triangles). A, The mean changes in velocity relative to the mean normal velocity magnitude and phase for the three conditions. The shaded areas represent the range covered by ±1 standard deviation around the normal mean. The bars represent ±1 standard deviation around the means of the magnitude and angles for the three pathologies. There is a clear separation of velocity magnitudes in the three pathologies at frequencies less than 1500 kHz. B, The mean air-bone gaps ± 1 standard deviations for the three ossicular pathologies. The standard deviations of the air-bone gaps, at frequencies of 1000 Hz and less, overlap in the three pathologies.
Figure 10A suggests that ears with ossicular interruptions or fixed mallei are readily separated from normal by measurements of umbo velocity at frequencies of 1000 Hz and lower, but that there is significant overlap between the fixed-stapes and normal groups. A potential method of separating fixed-stapes ears from normal is to combine the results of audiometry, specifically the air-bone gap, with the LDV measurements of umbo velocity. The existence of the air-bone gap with an intact TM and aerated middle ear is suggestive of an ossicular disorder (though as we will see later other pathologies can lead to air-bone gaps). Once it is clear that the ear has a conductive hearing loss, velocity measurements may help discriminate the cause of the hearing loss. Such a scheme is similar to the combination of audiometry and tympanometry described by others (e.g. Jerger, 1975; Zwislocki & Feldman, 1970) that was summarized in the introduction of this article. Figure 11 formalizes such a combination of air-bone gap and LDV measurements.
Fig. 11.
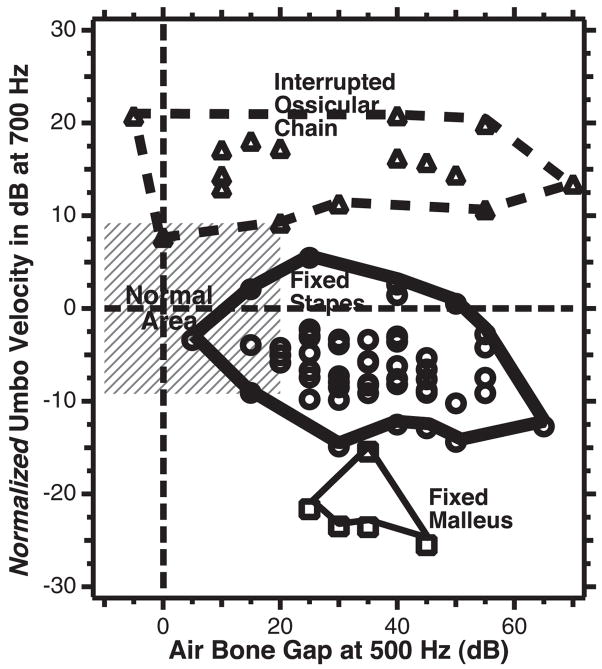
A plot of normalized umbo velocity (the difference in umbo-velocity transfer-function magnitude from the mean normal value) at 700 Hz on the ordinate scale vs. the air-bone gap at 500 Hz for each of the individual ears in the three groups of ossicular disorders: Fixed-stapes ear data are shown as circles, fixed malleus as squares, and ossicular interruption as triangles. The thin dashed horizontal line marks the contour associated with mean normal umbo velocity. The thin dashed vertical line demarcates the contour associated with a 0 dB air-bone gap. The gray area outlines the region of air-bone gap less than 20 dB and an umbo velocity that is within two standard deviations of normal. The thicker lines are used to circumscribe the results from the three ossicular disorders.
Figure 11 is a plot of the magnitudes of the umbo-velocity transfer function measured at 700 Hz, which are normalized by the mean normal transfer-function magnitude, versus the measured air-bone gap at 500 Hz for each individual ear in our ossicular-disorders group. We have chosen the velocity magnitude at 700 Hz as an indicator of the transfer function, because Figure 10A shows a combination of large differences in normalized magnitude and smaller standard deviations in all three groups at that frequency. The 500 Hz air-bone gap was chosen for similar reasons (Fig. 10B). The outlines around the data ranges from the three conductive pathologies suggest good separation of the three pathologies in the plot space.
The data in Figure 11 show a small cluster of the five fixed-malleus cases with air-bone gaps that range from 20 to 45 dB and normalized umbo velocities of −15 to −25 dB. The 57 fixed-stapes data points show larger ranges of air-bone gaps (5 to 65 dB) and normalized velocities 5 to −16 dB; this larger range is greatly influenced by the increased number of ears in this group. The 16 ossicular interruption cases show a broad range of air-bone gap at 500 Hz (−5 to 70 dB) but a more restricted range of normalized velocity (7 to 22 dB); the wider range of gaps is likely associated with the variations between ears with partial and total ossicular interruptions.
Figure 11 demonstrates a clear separation of the 16 ears with ossicular interruption from the other two pathologies, based solely on the normalized umbo velocity, where all of the ears with ossicular interruptions have a normalized umbo velocity >6.5 dB and all of the ossicular fixations have a normalized umbo-velocity magnitude of <6.5 dB. This separation is consistent with a binomial test of perfect selectivity (no false positives) and perfect sensitivity (no false negatives). The display also suggests a good but less than perfect separation of the two ossicular fixations, where all of the fixed-malleus ears have a normalized umbo velocity at 700 Hz of <−14 dB (perfect sensitivity); however, 2 of the 57 fixed-stapes ear also meet this criterion (a selectivity of 96.5%, two false positives out of 57 fixed-stapes cases). Confidence in the suggested sensitivity and selectivity for the discrimination of fixed-malleus versus fixed stapes is, of course, limited by the small number of fixed-malleus cases we have observed.
LDV in the Diagnosis of Superior-Canal Dehiscence (SCD)
A SCD is a break in the bony wall separating the superior-semicircular canal from the cranial cavity (Minor, Solomon, Zinreich, & Zee, 1998). Minor (2000, 2005), Minor, et al. (2001, 2003), and Minor, et al. (1998) first described a group of patients who presented to the clinic with sound or static pressure-induced vertigo, oscillopsia, and unsteadiness. These patients had a sound- or pressure-induced nystagmus consistent with stimulation of the superior semicircular canal (Cremer, Minor, Carey, & Della Santina, 2000; Minor, et al., 2001). High-resolution computed tomography (CT) scans of the temporal bone formatted to show the superior canal indicated a gap in the bone overlaying the canal. It was later determined that a fraction of later confirmed SCD patients come to the clinic because of hearing loss (Minor, et al., 2003; Mikulec, et al., 2004). The hearing loss often takes the form of a hypersensitivity to low-frequency bone-conducted sound and a decrease in sensitivity to air-conducted sound (Minor, et al., 2003; Mikulec, et al., 2004), which together combine to produce air-bone gaps as large as 50 dB at 250 Hz that decrease in magnitude as frequency increases. Mikulec, Poe, and McKenna (2005), Limb, Carey, Srireddy, and Minor (2006), and Merchant, Rosowski, and McKenna (2007) have demonstrated complete or partial closure of such air-bone gaps after surgical repair of the dehiscence.
Figure 12 shows individual and average audiograms from 29 ears from 22 patients seen at our clinic that were later diagnosed with SCD. The diagnosis was made using a constellation of tests including, audiometry, vestibular testing, measurements of vestibular-evoked myogenic potentials, stapedial-reflex testing, high-resolution CT imaging, and LDV. About one-third (8 of 22) of these patients had no vestibular symptoms, but were found to have an air-bone gap with measurable stapedial reflex thresholds, and supersensitive VEMP thresholds (Brantberg, et al., 2001; Brantberg, Löfqvist, & Fransson, 2004; Mikulec, et al., 2004). All 29 ears had positively identified dehiscence of the superior canal on CT scans. Nineteen of the 29 ears (66%) had air-bone gaps that were 20 dB or larger at one or more frequencies.
Fig. 12.
Audiometric results from 29 ears of 22 patients diagnosed with SCD. A, Mean and individual air-conduction audiograms. B, Mean and individual bone-conduction audiograms. C, Mean and individual air-bone gaps. Only 66% of the ears had air-bone gaps that were 20 dB or larger at one or more frequencies. Because of the limitations in test equipment, bone thresholds lower than −10 dB could not be measured.
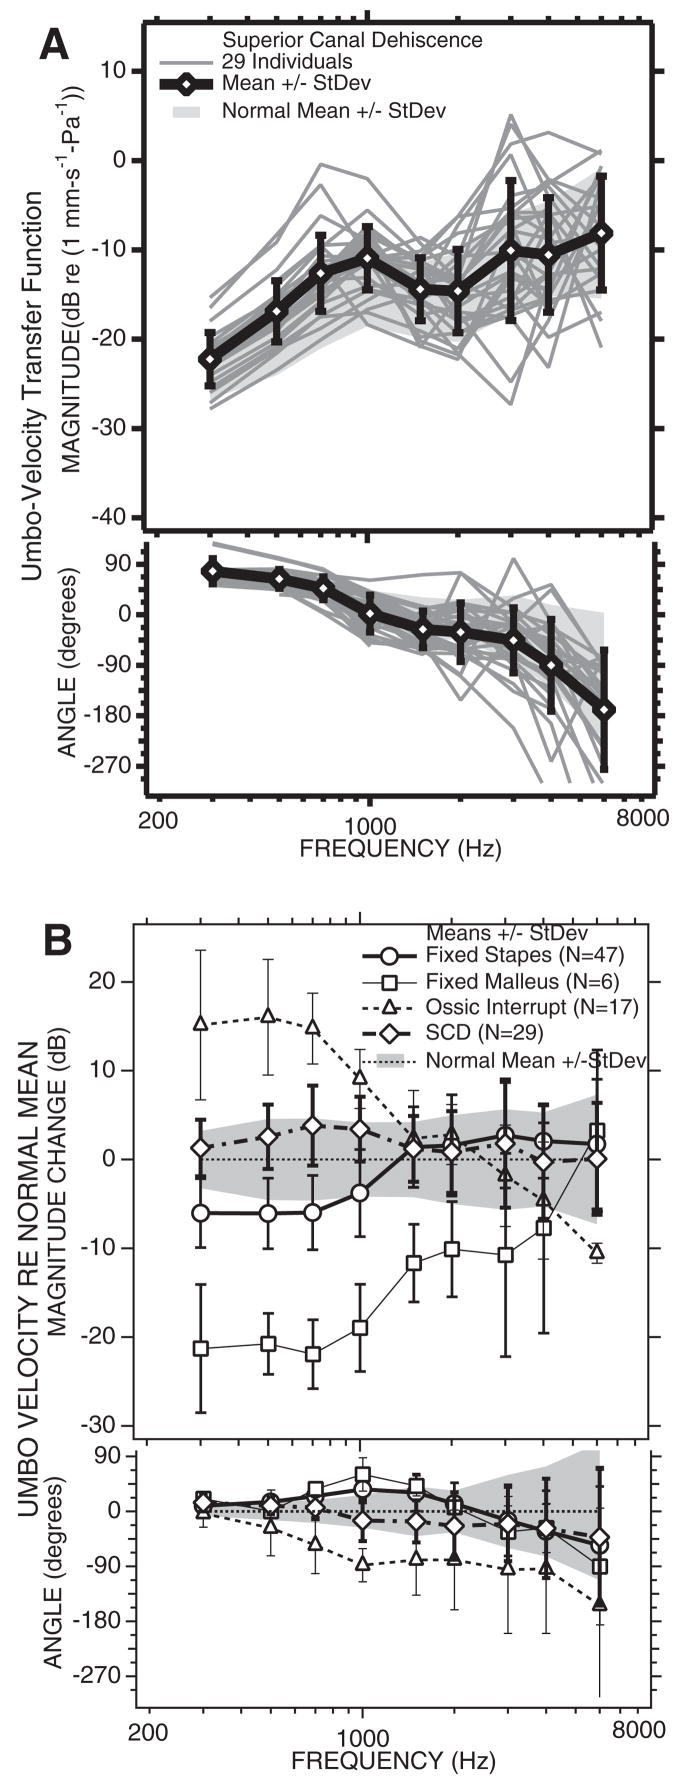
The results from LDV measurements in this population are summarized in Figure 13, where Figure 13A illustrates the individual measurements of umbo-velocity transfer function and compares the mean and standard deviation of the SCD cases with the range of the normal mean ± 1 standard deviation. There is much overlap of the ranges of the mean ± 1 standard deviation of the normal and SCD population, but in general the mean SCD transfer-function magnitude is a few dB larger than the mean normal magnitude at frequencies of 3000 Hz and below, whereas the two means are similar at higher frequencies. The mean angle of the transfer function is somewhat larger in the SCD population at frequencies of 700 Hz and lower and more negative than normal at higher frequencies. The differences between the mean SCD and normal LDV data are better compared in Figure 13B, which compares the differences between the mean of the SCD and normal mean data, along with the differences between the measured LDV means of the three ossicular disorders plotted in Figure 10B. In general, the LDV data from the SCD ears look like high-normal responses or mild cases of ossicular interruption, with a small increase in the magnitude of the umbo-velocity transfer function at frequencies of 700 Hz and lower and a more negative angle in the middle frequencies. The differences between the SCD and normal magnitude are significant at 500, 700, and 1000 Hz (p < 5%). The mean difference between transfer-function angles measured in the SCD and normal groups are statistically different at frequencies of 300, 500, 1000, and 2000 Hz (p < 5%).
Fig. 13.
LDV results from 29 ears with SCD. A, The umbo-velocity transfer-function magnitude (upper panel) and angle (lower panel). The mean is plotted as open diamond and thick lines. The cross bars represent ±1 standard deviation. The gray-shaded region is the normal mean ±1 standard deviation. B, The mean difference in umbo velocity from normal in: 29 ears with SCD, the line with longer dashes and open diamonds; 47 ears with fixed stapes, the open circles, and solid lines; 5 ears with fixed malleus, the squares, and the thinner solid line; 17 ears with ossicular interruption, the triangles, and the dashed line. The bars represent ±1 standard deviation.
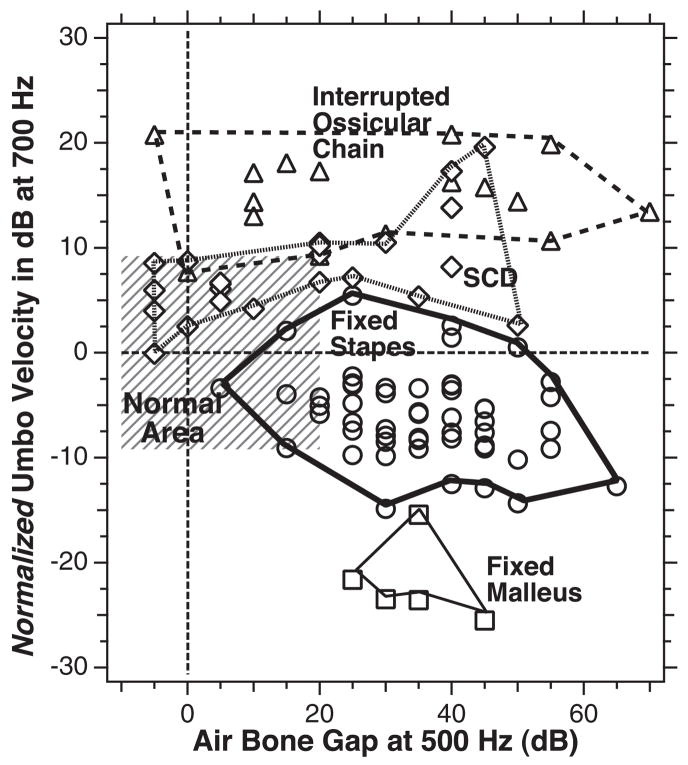
Figure 14 compares the normalized LDV magnitude at 700 Hz to the air-bone gap at 500 Hz for all of the individual SCD and ossicular disorder ears. In general, the SCD ears fall between the data from ears with fixed stapes and interrupted-ossicular chains. The high percentage of SCD ears that fall within the gray box of the normal area is partly because of the fact that only two-third of these ears exhibited any conductive hearing loss. Also, although a majority of the no conductive-loss ears had umbo-velocity magnitudes that were higher than normal, all fell within two standard deviations of normal. Larger increases in umbo-velocity were seen in some of the SCD ears with larger air-bone gaps, but the ear with the largest gap (50 dB) had an umbo-velocity magnitude that equaled the magnitude of the normal population.
Fig. 14.
Twenty-nine cases with SCD can generally be separated from stapes fixation in the velocity vs. air-bone gap plane. A criterion velocity level of greater than or equal to the mean normal velocity will wrongly identify 10% of the fixed-stapes cases as SCD and miss one (4%) of the SCD cases.
The existence of a low-frequency air-bone gap in some SCD patients has been mistaken for evidence of stapes fixation and has lead to unnecessary ear surgery being performed (Minor 2000, 2005; Mikulec, et al., 2004; Merchant, et al., 2007). The data of Figure 14 suggest that LDV measurements can help separate stapes fixation from SCD, but not perfectly. For example, a velocity criterion of normal umbo velocity (0 dB on the ordinate in Fig. 14) would segregate all but one of the SCD patients from the fixed-stapes data (a sensitivity of 25/26 = 96%) while falsely identifying 4 of the 57 fixed-stapes cases (a selectivity of 53/57 = 93%). The use of the LDV as a screening tool would decrease the need for CT scanning to differentiate stapes fixation from SCD. Of course other diagnostic information such as hypersensitive bone-conduction scores, the presence of measurable stapedial-reflexes, and increased magnitude and hyperthreshold sensitivity of vestibular-evoked myogenic potentials can also help separate stapes fixation from SCD (Brantberg, et al., 2001, 2004; Mikulec, et al., 2004).
Discussion and Summary
LDV Measurements in Ears without Conductive Impairment
The LDV measurements in normal-hearing ears and ears with pure sensorineural hearing loss (Whittemore, et al., 2004) support the following conclusions: (1) umbo velocity can be measured quickly and noninvasively in most ears with no discomfort. (2) Interindividual variations are about an order of magnitude (±10 dB) around the population mean. (3) The measured sound-induced velocity is reproducible from month to month. (4) The velocity is affected by middle ear static pressure. (5) The velocity transfer function is independent of sound levels between 60 and 90 dB SPL. (6) A small part of the variance in umbo-velocity transfer function may be related to subclinical air-bone gaps of less than 20 dB. (7) There is little effect of sensorineural hearing loss on the measured transfer function. (8) Generally, LDV measurements in ears with normal hearing or pure sensorineural loss are not correlated with age, though umbo-velocity at 6000 Hz seems to increase in magnitude at a rate of 1 dB every 7 years between the ages of 20 and 80 years.
LDV Measurements in Ears with Ossicular Disorders
Ears with conductive hearing loss related to ossicular pathologies present with pathology dependent alterations in the umbo-velocity transfer function (Huber, et al., 2001; Rosowski, et al., 2003).
At frequencies of 1000 Hz and lower, stapes fixation is associated with a small (6 dB on average) decrease in the magnitude of the sound-induced umbo velocity and a small increase in the phase angle of the umbo-velocity transfer function. These changes are consistent with a stiffening of the middle ear. The difference from velocity in normal ears is statistically significant, but the difference is small and there is significant overlap between the distributions of velocities at all frequencies in normal or fixed-stapes ears (Fig. 10). The small size of the fixed-stapes-associated decrease in umbo velocity, when compared with the 20 to 50 dB air-bone gaps is consistent with a significant amount of flexibility in the incudo-mallelar and incudo-stapedial joints (Nakajima, Ravicz, Merchant, Peake, & Rosowski, 2005; Rosowski, Merchant, & Nakajima, 2004a). This flexibility would allow the umbo and malleus to move with sound when sound-induced stapes motion is greatly reduced by otosclerosis or similar pathologies.
Partial or total ossicular interruptions produce a large (10 to 20 dB) and significant increase in the magnitude of the umbo-velocity transfer function at frequencies below 1500 Hz, probably as a result of a significant reduction of the cochlear and annular-ligament load on the umbo and TM (Møller, 1965; Rosowski, et al., 2004a; Zwislocki, 1962). The increased low-frequency velocity is generally separable from normal, in that there is little overlap between the distribution of velocity in normal ears and ears with ossicular interruptions (Fig. 10A). The increased velocity is also separable from the velocities measured when the stapes is fixed allowing easy discrimination of these two pathologies (Fig. 11). At higher frequencies, the magnitude of the umbo-velocity transfer function falls as frequency increases and the phase of the velocity falls. Similar variations in high-frequency middle ear mechanics have been observed in animals with interrupted ossicular chains (e.g. Allen, 1986; Lynch, 1981; Møller, 1965; Peake, Rosowski, & Lynch, 1992; Puria & Allen, 1998; Rosowski, Ravicz, & Songer, 2006).
Fixations of the malleus produce large decreases in the magnitude of the motion of the umbo at frequencies <2000 Hz. These decreases are coupled with significant increases in the phase of the umbo velocity in this low-frequency range and are also consistent with an increase in stiffness of the middle ear, though the increased umbo stiffness is larger than the stiffening produced by stapes fixation. The magnitude of the decrease in umbo velocity produced by malleus fixation is more similar to the air-bone gap in these cases (Figs. 10, 11), although the gaps are usually larger in magnitude. This mismatch is also suggestive of some flexibility in the manubrium (Funnell, Khanna, & Decraemer, 1992; Nakajima, et al., 2005; Rosowski, et al., 2004a) but could also reflect changes in the mode of motion of the umbo to which our measurement techniques are not sensitive (Decraemer, et al., 1989; Decraemer, Khanna, & Funnell, 1991).
LDV Measurements in Ears with Superior Semicircular Canal Dehiscence and Other “Third-Window” Lesions of the Inner Ear
A dehiscence of the superior semicircular canal (SCD) is thought to introduce a third window (in addition to the oval and round windows) into the bony inner-ear capsule (Minor, 2003, 2005; Rosowski, Songer, Nakajima, Brinsko, & Merchant, 2004b; Songer & Rosowski, 2006a,b). Such a new window placed on the vestibular side of the inner ear diverts air-conducted sound energy that enters the inner ear away from the cochlea (Rosowski, et al., 2004b; Songer & Rosowski, 2005, 2006a,b), where the diversion of sound energy through an open dehiscence has been directly observed in animal and temporal-bone models of SCD (Chien, Ravicz, Rosowski, & Merchant, 2007; Rosowski, et al., 2004b, Songer, 2006). Animal and computer models have also demonstrated that SCD can also induce a hypersensitivity to low-frequency bone-conducted sound (Rosowski, et al., 2004b; Songer, 2006; Songer, Brinsko, & Rosowski, 2004). The effects of a third window in the vestibular side of the inner ear are not restricted to the superior canal. A dehiscence in any of the three canals or a “window” produced by a large vestibular aqueduct could have similar effects on hearing (Merchant, et al., in press).
One hypothetical consequence of the introduction of a third window in the inner ear is a decrease in the inner-ear load on the middle ear (a decreased cochlear impedance). Such a decrease is consistent with observations of an increase in sound-induced ossicular motion after dehiscence in animals (Songer & Rosowski, 2006a), temporal bones (Chien, et al., 2007), as well as live patients (Fig. 13). Indeed, the changes in umbo-velocity transfer function produced by introduction of an SCD into a temporal-bone model compare well with the differences in sound-induced umbo velocity between normal-hearing subjects and patients with SCD (Chien, et al., 2007).
A potential pitfall for the otologist is the similarity of the low-frequency air-bone gap produced by SCD to the gap in patients who present with stapes fixation (Minor, 2000; Mikulec, et al., 2004). There have even been reports of a “Carhart’s notch” in patients with a later confirmed SCD (Mikulec, et al., 2004; Limb, et al., 2006). The diagnosis can be particularly confusing in the subset of the SCD population (about a one-third in our population) who has no overt vestibular symptoms. A correct diagnosis can be made in these patients by looking for hypersensitivity to bone-conducted sounds, the presence of the ipsilateral stapedial reflex despite the conductive loss, and calling for further testing (VEMP, LDV where available, or CT) to help differentiate the etiology of low-frequency air-bone gaps.
Future Directions
Our future work on laser-Doppler vibrometry includes: (1) an assessment of sound-induced umbo velocity in children with normal ears and ears with ossicular pathologies. Measurements in children will also allow further investigation of the effects of enlarged vestibular aqueduct syndrome on middle ear function and possible air-bone gap (Jackler & De La Cruz, 1989; Merchant, et al., in press; Valvassori & Clemis, 1978). (2) More investigations of third-window and potential third-window disorders associated with conductive hearing loss such as, dehiscence of other vestibular canals, enlarged vestibular aqueduct, Paget’s disease (Khetarpal & Schuknecht, 1990; Monsell, et al., 1995) and known genetic disorders associated with cochlear dysplasias and conductive hearing loss, for example, DFN3 (Cremers, Snik, Huygen, Joosten, & Cremers, 2002). Measurements in such patients will allow further elaboration and testing of the third-window model of inner-ear dependent air-bone gap. (3) Investigations of the utility of the LDV in determining why some tympanoplastic procedures fail. (4) Although the LDV is presently a research tool, with no commercially available clinically-approved system, Polytec PI has shown some interest in getting Food and Drug Administration approval for clinical testing. Such approval would allow billing patients for LDV testing and would open up the possibility of real clinical use of LDV.
Summary
Laser-Doppler vibrometry is a research tool that we have demonstrated to be a sensitive and specific tool for the diagnosis and differentiation of various ossicular disorders in patients with intact TMs and aerated middle ears. The LDV can also help differentiate the air-bone gap produced by ossicular fixations from air-bone gaps associated with inner-ear malformations such as a vestibular canal dehiscence.
Acknowledgments
This work would not have been possible without the aid of our numerous and diverse colleagues. Our otology colleagues, including Drs. Joseph Nadol, Michael McKenna, Steven Rauch, Dennis Poe, Robert Jyung, Daniel Lee, Jennifer Smullen, and Ronald DeVencia, who referred and helped recruit their patients for this work. Our audiology colleagues, notably Sharon Kujawa, Barbara Herrmann, Chris Halpin, and Ellen O’Neil, as well as others, did all of the auditory testing and contributed to the analysis of the audiometric data. A series of clinical and research fellows performed many of the LDV measurements in our patients and subjects, including Kenneth Whittemore, Ritvik Mehta, and Wade Chien. Our coworkers within the Eaton-Peabody Laboratory, notably Jocelyn Songer, Bill Peake, Mike Ravicz, Kelly Brinsko, Melissa Wood, and Becki Poon, assisted in innumerable material and intellectual matters. Jean Rosowski also contributed useful comments and insights.
This work was supported by the National Institute of Health: R01 DC 004798 (to S.N.M. and J.J.R.) and T32 DC 000020 (to H.H.N.) as well as donations from Lakshmi Mittal, Monte and Anne Wallace, and an anonymous donor.
References
- Allen JB. Measurements of eardrum acoustic impedance. In: Allen JB, Hall JL, Hubbard A, Neely ST, Tubis A, editors. Peripheral auditory mechanisms. New York: Springer-Verlag; 1986. pp. 44–51. [Google Scholar]
- Brantberg K, Bergenius J, Mendel L, Witt H, Tribukait A, Ygge J. Symptoms, findings and treatment in patients with dehiscence of the superior semicircular canal. Acta Otolaryngologica. 2001;121:68–75. doi: 10.1080/000164801300006308. [DOI] [PubMed] [Google Scholar]
- Brantberg K, Löfqvist L, Fransson PA. Large vestibular evoked myogenic potentials in response to bone-conducted sound in patients with superior canal dehiscence syndrome. Audiology and Neuro-Otology. 2004;9:173–182. doi: 10.1159/000077268. [DOI] [PubMed] [Google Scholar]
- Carhart R. Bone conduction advances following fenestration surgery. Transactions of the American Academy of Opthamology and Otolaryngology. 1952;56:621–629. [PubMed] [Google Scholar]
- Chien W, Ravicz ME, Rosowski JJ, Merchant SN. Measurements of human middle- and inner-ear mechanics with dehiscence of the superior semicircular canal. Otology & Neurotology. 2007;28:250–257. doi: 10.1097/01.mao.0000244370.47320.9a. [DOI] [PMC free article] [PubMed] [Google Scholar]
- Cremer PD, Minor LB, Carey JP, Della Santina CC. Eye movements in patients with superior canal dehiscence syndrome align with the abnormal canal. Neurology. 2000;55:1833–1841. doi: 10.1212/wnl.55.12.1833. [DOI] [PubMed] [Google Scholar]
- Cremers CWRJ, Snik AFM, Huygen PLM, Joosten FBM, Cremers FPM. X-linked mixed deafness syndrome with congenital fixation of the stapedial footplate and perilymphatic gusher (DFN3) In: Cremers CWRJ, Smith RJH, editors. Genetic hearing impairment: its clinical presentation. Basel: Karger; 2002. pp. 161–167. [DOI] [PubMed] [Google Scholar]
- Dalhoff E, Turcanu D, Zenner HP, Gummer AW. Distortion product otoacoustic emissions measured as vibration on the eardrum of human subjects. Proceedings of the National Academy of Science. 2007;104:1546–1551. doi: 10.1073/pnas.0610185103. [DOI] [PMC free article] [PubMed] [Google Scholar]
- Decraemer WF, Khanna SM, Funnell WRJ. Interferometric measurement of the amplitude and phase of tympanic membrane vibrations in cat. Hearing Research. 1989;38:1–18. doi: 10.1016/0378-5955(89)90123-8. [DOI] [PubMed] [Google Scholar]
- Decraemer WF, Khanna SM, Funnell WRJ. Malleus vibration mode changes with frequency. Hearing Research. 1991;54:305–318. doi: 10.1016/0378-5955(91)90124-r. [DOI] [PubMed] [Google Scholar]
- Feeney MP, Grant IL, Marryott LP. Wideband energy reflectance in adults with middle-ear disorders. Journal of Speech, Language and Hearing Research. 2003;46:901–911. doi: 10.1044/1092-4388(2003/070). [DOI] [PubMed] [Google Scholar]
- Feeney MP, Keefe DH. Estimating the acoustic reflex threshold from wideband measures of reflectance, admittance and power. Ear and Hearing. 2001;22:316–332. doi: 10.1097/00003446-200108000-00006. [DOI] [PubMed] [Google Scholar]
- Feeney MP, Keefe DH, Sanford CA. Wideband reflectance measures of the ipsilateral acoustic stapedius reflex threshold. Ear and Hearing. 2004;25:421–430. doi: 10.1097/01.aud.0000145110.60657.73. [DOI] [PubMed] [Google Scholar]
- Funnell WR, Khanna SM, Decraemer WF. On the degree of rigidity of the manubrium in a finite-element model of the cat eardrum. Journal of the Acoustical Society of America. 1992;91:2082–2090. doi: 10.1121/1.403694. [DOI] [PubMed] [Google Scholar]
- Goode RL, Ball G, Nishihara S. Measurement of umbo vibration in human subjects- methods and possible clinical applications. American Journal of Otology. 1993;14:247–251. [PubMed] [Google Scholar]
- Goode RL, Ball G, Nishihara S, Nakamura K. Laser Doppler vibrometer (LDV) a new clinical tool for the otologist. American Journal of Otology. 1996;17:813–822. [PubMed] [Google Scholar]
- Huber AM, Schwab C, Linder T, Stoeckli SJ, Ferrazzinin M, Dillier N, et al. Evaluation of eardrum laser Doppler interferometry as a diagnostic tool. The Laryngoscope. 2001;111:501–507. doi: 10.1097/00005537-200103000-00022. [DOI] [PubMed] [Google Scholar]
- Jackler RK, De La Cruz A. The large vestibular aqueduct syndrome. Laryngoscope. 1989;99:1238–1243. doi: 10.1288/00005537-198912000-00006. [DOI] [PubMed] [Google Scholar]
- Jerger J. Diagnostic use of impedance measures. In: Jerger J, editor. Clinical impedance audiometry. New York: American Electromedics Corporation; 1975. pp. 149–174. [Google Scholar]
- Khetarpal U, Schuknecht HF. In search of pathologic correlates for hearing loss and vertigo in Paget’s disease: a clinical and histopathologic study of 26 temporal bones. Annals of Otology, Rhinology and Laryngology. 1990;99(Supplement 145):1–16. [PubMed] [Google Scholar]
- Lilly DJ. Multiple frequency, multiple component tympanometry: new approaches to an old diagnostic problem. Ear and Hearing. 1984;5:300–308. [PubMed] [Google Scholar]
- Limb CJ, Carey JP, Srireddy S, Minor LB. Auditory function in patients with surgically treated superior semicircular canal dehiscence. Otology & Neurotology. 2006;27:969–980. doi: 10.1097/01.mao.0000235376.70492.8e. [DOI] [PubMed] [Google Scholar]
- Lynch TJ., III . Doctoral thesis. Massachusetts Institute of Technology; 1981. Signal processing by the cat middle ear: admittance and transmission, measurements and models. [Google Scholar]
- Margolis RH, Goycoolea HG. Multifrequency tympanometry in normal adults. Ear and Hearing. 1993;14:408–413. doi: 10.1097/00003446-199312000-00006. [DOI] [PubMed] [Google Scholar]
- Margolis RH, Shanks JE. Tympanometry. In: Katz J, editor. Handbook of clinical audiology. Baltimore: Williams & Wilkens; 1985. pp. 438–475. [Google Scholar]
- Merchant SN, Nakajima HH, Halpin C, Nadol JB, Jr, Lee DJ, Innis WP, et al. Clinical investigation and mechanism of air-bone gaps in large vestibular aqueduct syndrome. Annals of Otology Rhinology and Laryngology. doi: 10.1177/000348940711600709. in press. [DOI] [PMC free article] [PubMed] [Google Scholar]
- Merchant SN, Rosowski JJ, McKenna MJ. Superior semicircular canal dehiscence mimicking otosclerotic hearing loss. Advances in Otorhinolaryngology. 2007;65:137–145. doi: 10.1159/000098790. [DOI] [PMC free article] [PubMed] [Google Scholar]
- Mikulec AA, McKenna MJ, Ramsey MJ, Rosowski JJ, Herrmann BS, Rauch SD, et al. Superior semicircular canal dehiscence presenting as conductive hearing loss without vertigo. Otology & Neurotology. 2004;25:121–129. doi: 10.1097/00129492-200403000-00007. [DOI] [PubMed] [Google Scholar]
- Mikulec AA, Poe DS, McKenna MJ. Operative management of superior semicircular canal dehiscence. Laryngoscope. 2005;115:501–507. doi: 10.1097/01.mlg.0000157844.48036.e7. [DOI] [PubMed] [Google Scholar]
- Minor LB. Superior canal dehiscence syndrome. American Journal of Otology. 2000;21:9–19. [PubMed] [Google Scholar]
- Minor LB. Clinical manifestations of superior semicircular canal dehiscence. The Laryngoscope. 2005;115:1717–1727. doi: 10.1097/01.mlg.0000178324.55729.b7. [DOI] [PubMed] [Google Scholar]
- Minor LB, Carey JP, Cremer PD, Lustig LR, Streubel SO, Ruckenstein MJ. Dehiscence of bone overlying the superior canal as a cause of apparent conductive hearing loss. Otology & Neurotology. 2003;24:270–278. doi: 10.1097/00129492-200303000-00023. [DOI] [PubMed] [Google Scholar]
- Minor LB, Cremer PD, Carey JP, Della Santina CC, Streubel SO, Weg N. Symptoms and signs in superior canal dehiscence syndrome. Annals of the New York Academy of Science. 2001;942:259–273. doi: 10.1111/j.1749-6632.2001.tb03751.x. [DOI] [PubMed] [Google Scholar]
- Minor LB, Solomon D, Zinreich JS, Zee DS. Sound- and/or pressure-induces vertigo due to bone dehiscence of the superior semicircular canal. Archives of Otolaryngology, Head and Neck Surgery. 1998;124:249–258. doi: 10.1001/archotol.124.3.249. [DOI] [PubMed] [Google Scholar]
- Møller AR. Experimental study of the acoustic impedance of the middle ear and its transmission properties. Acta Otolaryngologica. 1965;60:129–149. doi: 10.3109/00016486509126996. [DOI] [PubMed] [Google Scholar]
- Monsell EM, Cody DD, Bone HG, Divine GW, Windham JP, Jacobson GP, et al. Hearing loss in Paget’s disease of bone: the relationship between pure-tone thresholds and mineral density of the cochlear capsule. Hearing Research. 1995;83:114–120. doi: 10.1016/0378-5955(94)00196-w. [DOI] [PubMed] [Google Scholar]
- Nakajima HH, Ravicz ME, Merchant SN, Peake WT, Rosowski JJ. Experimental ossicular fixations and the middle-ear’s response to sound: evidence for a flexible ossicular chain. Hearing Research. 2005;204:60–77. doi: 10.1016/j.heares.2005.01.002. [DOI] [PubMed] [Google Scholar]
- Peake WT, Rosowski JJ, Lynch TJ., III Middle-ear transmission: Acoustic vs. ossicular coupling in cat and human. Hearing Research. 1992;57:245–268. doi: 10.1016/0378-5955(92)90155-g. [DOI] [PubMed] [Google Scholar]
- Puria S, Allen JB. Measurements and model of the cat middle ear: evidence of tympanic membrane acoustic delay. The Journal of the Acoustical Society of America. 1998;104:3463–3481. doi: 10.1121/1.423930. [DOI] [PubMed] [Google Scholar]
- Rodriguez Jorge J, Zenner HP, Hemmert W, Burkhardt C, Gummer AW. Laservibrometrie: ein mittelohr- und Kochelaanalysator zur nichtinvasiven Untersuchung von Mittel-und Innenohrfunktionsstörungen. Hals Nasen Ohren. 1997;45:997–1007. doi: 10.1007/s001060050185. [DOI] [PubMed] [Google Scholar]
- Rosowski JJ, Mehta RP, Merchant SN. Diagnostic utility of laser-Doppler vibrometry in conductive hearing loss with normal tympanic membrane. Otology & Neurotology. 2003;24:165–175. doi: 10.1097/00129492-200303000-00008. [DOI] [PMC free article] [PubMed] [Google Scholar]
- Rosowski JJ, Merchant SN, Nakajima HH. The use of laser-Doppler vibrometry in human middle-ear research: the effects of alterations in middle-ear load. In: Gyo K, Wada H, Hato N, Koike T, editors. Middle-ear mechanics in research and otology. Singapore: World Scientific; 2004a. pp. 234–241. [Google Scholar]
- Rosowski JJ, Ravicz ME, Songer JE. Structures that contribute to middle-ear admittance in chinchilla. Journal of Comparative Physiology A Sensory, Neural, and Behavioral Physiology. 2006;192:1287–1311. doi: 10.1007/s00359-006-0159-9. [DOI] [PMC free article] [PubMed] [Google Scholar]
- Rosowski JJ, Songer JE, Nakajima HH, Brinsko KM, Merchant SN. Clinical, experimental, and theoretical investigations of the effect of superior canal dehiscence on hearing mechanisms. Otology & Neurotology. 2004b;25:323–332. doi: 10.1097/00129492-200405000-00021. [DOI] [PubMed] [Google Scholar]
- Songer JE. Doctoral thesis in Speech and Hearing Bioscience and Technology. Division of Health Sciences and Technology, Massachusetts Institute of Technology; Cambridge, MA: 2006. Superior canal dehiscence: auditory mechanisms. [Google Scholar]
- Songer JE, Brinsko KM, Rosowski JJ. Superior semicircular canal dehiscence and bone conduction in chinchilla. In: Gyo K, Wada H, Hato N, Koike T, editors. Middle-ear mechanics in research and otology. Singapore: World Scientific; 2004. pp. 234–241. [Google Scholar]
- Songer JE, Rosowski JJ. The effect of superior canal dehiscence on cochlear potential in response to air-conducted stimuli in chinchilla. Hearing Research. 2005;210:53–62. doi: 10.1016/j.heares.2005.07.003. [DOI] [PMC free article] [PubMed] [Google Scholar]
- Songer JE, Rosowski JJ. The effect of superior-canal opening on middle-ear input admittance and air-conducted stapes velocity in chinchilla. The Journal of the Acoustical Society of America. 2006a;120:258–269. doi: 10.1121/1.2204356. [DOI] [PMC free article] [PubMed] [Google Scholar]
- Songer JE, Rosowski JJ. Superior semicircular canal dehiscence: mechanisms of air-conducted hearing. In: Nuttall AL, Ren T, Gillespie P, Grosh K, deBoer E, editors. Auditory mechanics, processes and models. New Jersey: World Scientific; 2006b. pp. 113–114. [Google Scholar]
- Stach BA, Jerger JF. Acoustic reflex averaging. Ear and Hearing. 1984;5:289–296. doi: 10.1097/00003446-198409000-00005. [DOI] [PubMed] [Google Scholar]
- Valvassori GE, Clemis D. The large vestibular aqueduct syndrome. Laryngoscope. 1978;88:723–728. doi: 10.1002/lary.1978.88.5.723. [DOI] [PubMed] [Google Scholar]
- Wever EG, Lawrence M. Physiological acoustics. Princeton: Princeton University Press; 1954. [Google Scholar]
- Whittemore KR, Merchant SN, Poon BB, Rosowski JJ. A normative study of tympanic membrane motion in humans using a laser Doppler vibrometer (LDV) Hearing Research. 2004;187:85–104. doi: 10.1016/s0378-5955(03)00332-0. [DOI] [PubMed] [Google Scholar]
- Wilson RH. The effects of aging on the magnitude of the acoustic reflex. Journal of Speech and Hearing Research. 1981;24:406–414. doi: 10.1044/jshr.2403.406. [DOI] [PubMed] [Google Scholar]
- Wilson RH, McBride LM. Threshold and growth of the acoustic reflex. The Journal of the Acoustical Society of America. 1978;63:147–154. doi: 10.1121/1.381706. [DOI] [PubMed] [Google Scholar]
- Zhao F, Wada H, Koike T, Ohyama K, Kawase T, Stephens D. Middle ear dynamic characteristics in patients with otosclerosis. Ear and Hearing. 2002;23:150–158. doi: 10.1097/00003446-200204000-00007. [DOI] [PubMed] [Google Scholar]
- Zwislocki J. Analysis of the middle-ear function. Part I: Input impedance. The Journal of the Acoustical Society of America. 1962;34:1514–1523. [Google Scholar]
- Zwislocki J, Feldman AS. Acoustic impedance in pathological ears. American Speech and Hearing Association Monograph. 1970;15:1–42. [PubMed] [Google Scholar]


