

Abstract
Apart from regulating sleep and wakefulness, the circadian system may play an important role in other biological processes, including pathways involved in tumorigenesis. Two genetic association studies recently conducted by our lab have demonstrated that a missense mutation in neuronal PAS domain protein 2 (NPAS2), a core circadian gene and transcriptional regulator, is significantly associated with risk of breast cancer and non-Hodgkin’s lymphoma. Our current functional analyses provide the first in vitro evidence further demonstrating that cells with RNA interference-mediated depletion of NPAS2 fail to exhibit the expected cell cycle delay in response to mutagen treatment. DNA repair capacity, as measured by the comet assay, is also impaired. Moreover, a pathway-based PCR expression array of genes important for DNA damage signaling demonstrated that knockdown of NPAS2 significantly represses the expression of several cell cycle and DNA repair genes. Thus, NPAS2 may play a role in tumorigenesis by affecting expression of cancer-related genes, and could be considered a novel tumor suppressor.
Keywords: NPAS2, Circadian Gene, Cell Cycle, Apoptosis and DNA Repair
Introduction
Mounting evidence that the circadian clock may function as a tumor suppressor at the systemic, cellular, and molecular levels through its involvement in cell proliferation, apoptosis, cell cycle control, and DNA damage response increasingly suggests a novel role for circadian rhythm and circadian genes in tumorigenesis (1, 2). Our recent genetic association studies have demonstrated that a missense mutation (Ala394Thr) in neuronal PAS domain protein 2 (NPAS2), a core circadian gene and transcriptional regulator (3, 4), is a biomarker for individuals’ susceptibility to two human cancer types, breast cancer and non-Hodgkin’s lymphoma (5, 6). While these molecular epidemiological findings are the first evidence that NPAS2 might be involved in tumorigenesis, little is known about the underlying mechanisms.
NPAS2, the largest circadian gene, encodes for a member of the basic helix-loop-helix-PAS class of transcription factors that forms heterodimers with BMAL1 and is involved in the regulation of biological rhythms (7, 8). The NPAS2:BMAL1 heterodimer is part of the positive circadian feedback loop and may bind to E-box sequences in the promoter regions of target circadian genes, thereby activating their expression and regulating circadian rhythm (9, 10). In addition to regulating other circadian genes, NPAS2:BMAL1 heterodimers have been shown to affect expression of the proto-oncogene c-MYC (11). This finding implies potential involvement of NPAS2 in tumorigenesis that has not been fully explored.
In order to investigate the functional role of NPAS2 in cancer-related biological pathways, we performed RNAi-mediated knockdown of NPAS2 in vitro followed by a variety of functional assays related to DNA damage response. The findings, while preliminary, will further our understanding of the role of NPAS2 in tumorigenesis, and provide an important first step in elucidating the mechanisms by which this gene may be involved in cancer-related processes. In addition, these findings will aid in directing future studies concerning the impact of the circadian system on carcinogenesis.
Results
Expression of NPAS2 in the cancer cell lines MCF-7and HCT-15
It is now clear that molecular clocks reside not only in a central pacemaker, but also in peripheral tissues, even in immortalized cells (12, 13). Previous evidence suggests that circadian genes, including NPAS2, show detectable circadian mRNA expression in all tissues except testis (14). Before beginning our study we confirmed the presence of measurable levels of NPAS2 expression in MCF-7 and HCT-15 cells using quantitative reverse transcription PCR (qRT-PCR), as well as the presence of NPAS2 protein in MCF-7 cells by Western blot (data not shown). We then transfected the cells with small interfering RNA (siRNA) oligos targeting NPAS2 along with a scrambled negative siRNA oligo with no known homology to the human genome (mock siRNA). NPAS2 knockdown relative to mock treated cells was quantitatively determined by qRT-PCR prior to each assay, and only those populations with greater than 70% reduction were used in subsequent analyses.
NPAS2 knockdown affects expression of cancer-related genes
We performed a pathway-based PCR expression array (SuperArray Bioscience) to determine the impact of NPAS2 silencing in MCF-7 cells on the expression profile of 84 genes with established roles in DNA damage signaling. Consistent with NPAS2’s role as a transcriptional enhancer, 74 genes (91.4%) were down-regulated, and 22 genes (27.2%) were down-regulated by 2-fold or more compared to cells with normal NPAS2 levels. Only 7 genes demonstrated increased expression (8.6%), none of which were significantly different than reference (Figure 1). We compared gene expression in NPAS2-knockdown cells with that of cells with normal NPAS2 expression using the Student’s t-test. At the nominal p-value of 0.05, 27 genes were significantly down-regulated, while only 4.2 (84 * 0.05) would be expected to be significant by chance alone. However, the magnitude of many of these changes was small, and therefore may not be biologically relevant. As such, we considered a gene to have significantly altered expression only if it displayed greater than 2-fold up- or down-regulation, and had a p-value less than 0.05. Seven genes with a variety of functional roles fit this criteria for significant down-regulation, including genes important for cell cycle checkpoint control (FANCG), damaged DNA binding (DMC1, DDB1, MSH2), double-strand break repair (PRKDC), cell cycle arrest (MAPK12), and mismatch repair (EXO1) (Table 1). In order to further confirm these findings, and to determine whether the observed response was specific to MCF-7 cells, we repeated the NPAS2 knockdown experiment and PCR expression array using a colorectal adenocarcinoma cell line (HCT-15). Using the nominal p-value of 0.05, eight genes were significantly down-regulated, and again, no genes were significantly up-regulated. While no genes fit the original significance criteria of fold change greater than 2 and p<0.05, the three genes most significantly altered according to the t-test alone were also identified as significant in MCF-7 cells. Given that none of the DNA damage responsive genes included in the array were altered by 2-fold or more following NPAS2 knockdown in the HCT-15 cells, we performed the subsequent functional analyses on MCF-7 cells only.
Figure 1.

3D profile of expression differences among genes related to the DNA-damage response pathway following NPAS2 silencing in MCF-7 cells as measured by pathway specific PCR array (SuperArray). 22 of the 81 genes measured (27.2%), had greater than 2-fold reduced expression and 73 (91.4%) were down-regulated. Of the 7 genes with increased expression, none was greater than 1.31 fold. The data are a result of 2 replicates from 2 independent experiments.
Table 1.
Genes with p-value less than 0.05 (HCT-15), or greater than 2-fold changes in expression and a p-value less than 0.05 (MCF-7) following NPAS2 knockdown, as determined by DNA damage repair PCR expression array. Fold change is defined as the ratio of 2−ΔCt values for NPAS2-reduced samples to negative control samples, and are presented as-1/[fold difference], since all significant genes are down-regulated. P-values are for the Student’s t-test comparing gene expression in NPAS2-knockdown cells with expression in cells with normal NPAS2 levels. Genes that were significantly down-regulated in MCF-7 cells and had a p-value less than 0.05 in HCT-15 cells appear in bold. All comparisons are based on the average of duplicate experiments.
| Symbol | Ref Seq | Fold Down-Regulation | p-value
(t-test) |
Functional Group | |
|---|---|---|---|---|---|
| MCF-7-[ | FANCG | NM_004629 | −2.18 | 0.0001 | cell cycle checkpoint |
| EXO1 | NM_130398 | −2.24 | 0.0058 | mis match repair | |
| PRKDC | NM_006904 | −2.71 | 0.0061 | double-strand break repair | |
| DDB1 | NM_001923 | −2.15 | 0.0068 | damaged DNA binding | |
| DMC1 | NM_007068 | −2.78 | 0.0140 | damaged DNA binding | |
| MAPK12 | NM_002969 | −2.25 | 0.0155 | cell cycle arrest | |
| MSH2 | NM_000251 | −2.03 | 0.0248 | damaged DNA binding | |
|
|
|||||
| HCT-15-[ | DMC1 | NM_007068 | −1.39 | 0.0008 | damaged DNA binding |
| MSH2 | NM_000251 | −1.40 | 0.0092 | damaged DNA binding | |
| EXO1 | NM_130398 | −1.31 | 0.0111 | mis match repair | |
| CRY1 | NM_004075 | −1.25 | 0.0335 | DNA repair | |
| PCNA | NM_182649 | −1.66 | 0.0347 | DNA repair | |
| RAD5 1 | NM_002875 | −1.40 | 0.0372 | damaged DNA binding | |
| UNG | NM_003362 | −1.09 | 0.0379 | base-excision repair | |
| RAD 1 | NM_002853 | −1.74 | 0.0467 | cell cycle checkpoint | |
Reduced NPAS2 expression affects cell cycle checkpoints
We performed flow cytometric analyses to determine the effect of NPAS2 silencing on cell cycle progression in response to exposure to the chemical mutagen methyl methanesulfonate (MMS). MCF-7 cells were transfected with either NPAS2-targeting or scrambled negative siRNA. Forty-eight hours after transfection, cells were treated with either 0.015% MMS or PBS for 1 hour, washed, and then left under normal conditions for an additional 24 hours. Harvested cells were then analyzed by flow cytometry and cell phases were determined. As expected, the cell phase distribution of the cell population with normal NPAS2 expression was significantly different among those treated with PBS compared to MMS (χ22=13.777; p= 0.001) (Figure 2). Mutagen-treated cells with normal NPAS2 expression were more likely to be in G1 or G2 phase, corresponding to the major cell-cycle checkpoints for DNA damage repair, while the number of cells in S phase was significantly reduced. However, among cells with reduced NPAS2 expression, there was no significant difference between cells treated with PBS and those treated with MMS ((χ22 = 3.830; p=0.147), indicating an aberrant response to DNA damage. Furthermore, there was a significant difference in the cell cycle distribution of normal and NPAS2 knockdown populations among cells not treated with mutagen ((χ22= 6.096; p=0.0475). This difference was even more pronounced among mutagen-treated cells ((χ22 = 10.109; p=0.006).
Figure 2.

Reduced NPAS2 expression leads to changes in cell cycle distribution among mutagen treated and mock treated MCF-7 cells. Cells were either treated with scrambled negative or NPAS2-targeting siRNA oligos, and either 0.015% (v/v) MMS or PBS. Cell cycle distribution was determined 24 hours after MMS/PBS treatment and 72 hours after siRNA treatment. Data was collected on an average of 47,060 cells per sample (range 40,335 to 50,609), and cell phases were determined by the software using the Watson pragmatic algorithm. The cell phase distributions were: 44% G1, 35% S and 21% G2/M for cells treated with siRNA-/MMS- (A); 51% G1, 20% S and 29% G2/M for cells treated with siRNA+/MMS- (B); 61% G1, 13% S and 26% G2/M for cells treated with siRNA-/MMS+ (C); and 47% G1, 32% S and 22% G2/M for cells treated with siRNA+/MMS+ † (D). The cell phase distribution was significantly different between treatments siRNA-/MMS- and siRNA-/MMS+ (χ22=13.777; p= 0.001), but not between siRNA+/MMS- and siRNA+/MMS+ (χ22 = 3.830; p=0.147), indicating an improper response to mutagen treatment among cells with reduced NPAS2 expression. Normal cells respond to mutagen treatment with a significant G1/G2 delay, as expected, while NPAS2 knockdown cells do not display a significant change in cell cycle distribution (E).
†Percentages may not sum to 100 due to rounding.
Reduced NPAS2 expression affects DNA repair capacity
The alkaline single-cell gel electrophoresis assay (comet assay) was used to assess differences in DNA damage accumulation and repair capacity between cells with normal NPAS2 expression and those with reduced NPAS2 expression in MCF-7 cells. After the siRNA and MMS/PBS treatments mentioned above, cells were washed in PBS, then incubated in normal medium for 3 hours, followed by comet assay analysis. The mean Olive tail moment was determined for 50 cells from each of the four treatment groups (+/- siRNA and +/- MMS) and all pairwise comparisons were examined using Fisher’s PLSD (Figure 3). Longer “tails” associated with an individual cell correspond to greater accumulation of damage, as the head consists of intact DNA, while the tail material is comprised of damaged DNA. Among the samples not treated with mutagen, the difference in tail moment between cells with reduced and normal NPAS2 expression was not significant (p=0.668), indicating that without inducing damage, there is no difference in repair. However, among the mutagen-treated populations, cells with reduced NPAS2 had significantly longer mean tail moments (p=0.002), suggesting decreased DNA repair capacity compared to cells with normal NPAS2 expression. All other comparisons were significant, as expected.
Figure 3.
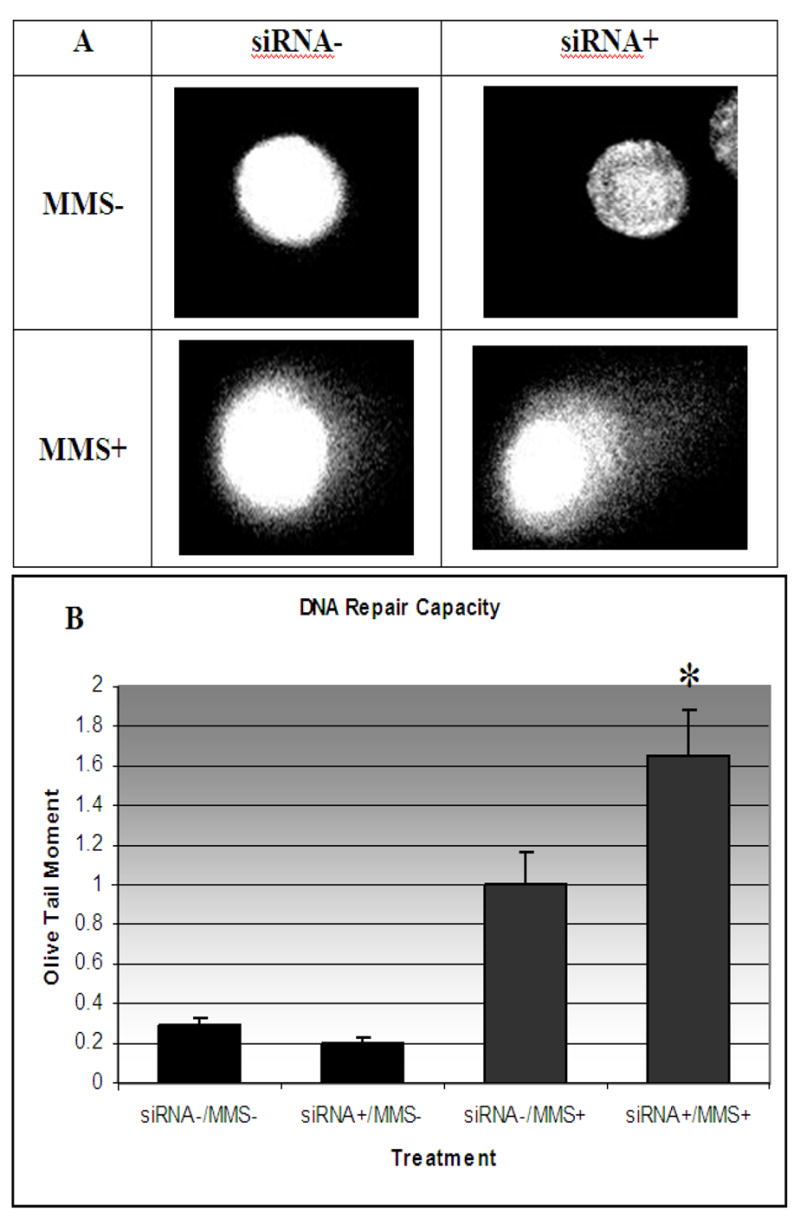
DNA damage repair capacity assessed by the Comet Assay. (A) Representative cell images from each of the four treatments. Mean Olive tail moment (B) determined from 50 cells from each of the four treatment groups was 0.292±0.037 for siRNA-/MMS-, 1.003±0.164 for siRNA-/MMS+, 0.204±0.026 for siRNA+/MMS-, and 1.654±0.235 for siRNA+/MMS+. All pairwise comparisons were examined using Fisher’s PLSD. Among the samples not treated with mutagen, the difference in tail moment between cells with reduced and normal NPAS2 expression was not significant (p=0.668), indicating that without inducing damage, there is no difference in repair. However, among the mutagen-treated populations, cells with reduced NPAS2 had a significantly longer mean tail moment (p=0.0018) as depicted in Figure 4B, indicating decreased DNA repair capacity compared to cells with normal NPAS2 expression. As expected, all other comparisons were significant (p<0.001).
Impact of reduced NPAS2 expression on apoptosis and cell viability
A similar protocol was employed to assess differences in cell viability and apoptotic response to mutagen exposure between cells with normal NPAS2 expression and those with reduced levels of NPAS2. MCF-7 cells were treated as described in the cell cycle experiment, with the exception that cells were harvested 48 hours after MMS or PBS treatment to allow additional time for the initiation of the apoptotic response. Percentages were then determined for early apoptotic, live, and dead cells for each treatment population. For the cell viability comparison, siRNA+ samples were compared to siRNA- samples for each MMS or PBS treatment. For the apoptosis comparison, MMS treated cells were compared to PBS treated cells in each of the siRNA treatment groups. In both mutagen treated and non-treated populations, cells with reduced NPAS2 expression were significantly less viable than normal cells (p=0.001, and p=0.003, respectively), indicating that NPAS2 knockdown alone was sufficient to elicit increased vulnerability to cell death (Figure 4). However, in both NPAS2 knockdown and normal cells, treatment with MMS resulted in significantly increased levels of apoptosis (p=0.037, and p=0.027, respectively), suggesting that NPAS2 may not directly hinder the apoptotic process.
Figure 4.

Representative flow cytometry results for each of the 4 treatments (A). Live cells are found in the lower left quadrant, early apoptotic cells are in the lower right quadrant, and necrotic cells occupy the upper area. Cells were stained with PI (y axis) along with Annexin V (x axis) and 10,000 cells were counted. Cells were then categorized as live, dead, apoptotic, or ambiguous. (B): Percentage of live cells for each treatment from 2 independent experiments. In both mutagen treated and non-treated populations, cells with reduced NPAS2 expression were significantly less viable (p=0.001, and p=0.003, respectively). (C): Percentage of the total population undergoing early apoptosis for each treatment from 2 independent experiments. Comparisons are between MMS and PBS treated cell populations in each siRNA treatment group, and asterisks denote significant differences (p<0.05). Both normal and NPAS2 knockdown cells exhibit increased apoptosis following mutagen exposure (p=0.027, and p=0.037, respectively), suggesting that NPAS2 itself does not directly hinder the apoptotic response.
Discussion
It has been suggested that the disruption of circadian rhythm may have broad consequences at the molecular level, as previous evidence has shown that 2–10% of all mammalian genes display circadian oscillation (15, 16). The results presented here contribute to increasing evidence suggesting an important role for NPAS2 in transcriptional regulation, but the full extent to which it is involved in disease-related pathways remains to be elucidated (4). While previous reports have suggested that NPAS2 may directly regulate other genes in the circadian regulatory system (9, 10), our current study demonstrates that genes involved in cancer-related biological pathways are also influenced by NPAS2, which could explain the observed functional impact of NPAS2 knockdown on cell cycle progression and DNA repair capacity, as well as the epidemiologic evidence suggesting an association between polymorphisms in NPAS2 and cancer risk (5, 6). In addition to previous studies demonstrating the importance of another circadian gene, PER2, in tumor suppression (17, 18), our findings further highlight the relevance of the circadian system to carcinogenesis, pointing to an area that is perhaps understudied in the field of cancer research (19).
Although it is not clear whether any of the genes identified in the PCR expression array are regulated by NPAS2 directly, it is of note that of the eight functional gene groups represented in the array (apoptosis, cell cycle arrest, cell cycle checkpoint, double-strand break repair, damaged DNA binding, base-excision repair, mismatch repair, and other genes related to DNA repair) only the apoptotic pathway did not have a single gene significantly affected by NPAS2 knockdown in either cell type. This is consistent with the functional findings which suggest that NPAS2 silencing decreases cell viability, results in aberrant cell cycle response to DNA damage, and decreases DNA damage repair capacity, but does not alter the apoptotic response. It is also of note that the array results imply a significantly more prominent role for NPAS2 in breast cancer cell lines, compared to cells derived from colorectal cancer. While expression of some genes in the array was impacted by NPAS2 knockdown in the HCT-15 cells, the effect was much less profound than that observed in MCF-7 cells, and none reached our significance criteria of p<0.05 and greater than 2-fold expression change. These data suggest that the role of NPAS2 may vary according to cancer type, and as such, the results presented here, while relevant to breast cancer, may not necessarily translate uniformly across other cancer types.
An important limitation of our methodology is that cells were only transiently transfected with siRNA oligos, and therefore silencing of NPAS2 could not be stably induced and successfully transfected cells could not be exclusively selected. As a result, we could not assess the long-term effects of reduced NPAS2 expression on cell viability or other relevant pathways, nor could we achieve 100% silencing of NPAS2. However, since the reduction in NPAS2 expression was quantified prior to each assay, this does not affect the interpretation of the results presented here, but it does provide an avenue for further research. In addition, these findings provide only indirect support for the role of NPAS2 as a transcriptional regulator of cancer-related genes. More direct evidence is needed in order to determine whether the genes implicated here are directly targeted by NPAS2, or whether their expression is altered indirectly via some other mechanism. This could be achieved via ChIP-on-chip assay utilizing NPAS2-specific antibodies and a targeted or whole-genome promoter array.
Together, our observations indicate important functional consequences of the circadian gene NPAS2 on DNA damage response, a key pathway related to tumorigenesis. Although epidemiologic evidence has linked NPAS2 with a variety of disorders, including winter depression (20) and autistic disorder (21), as well as cancer (5, 6), this is the first functional evidence demonstrating a broad role for NPAS2 in tumorigenesis. While this study does not definitively address all of the questions relevant to the relationship between NPAS2 and carcinogenesis, we do believe that it is an important first step in elucidating the mechanisms by which this gene may be involved in tumorigenesis. These findings lend further support to the view that circadian genes may serve as a novel group of tumor suppressor genes and provide a molecular basis for the epidemiologic observations that disruption of circadian rhythm is a risk factor for the development of several cancer types (22–24).
Materials and methods
Cell culture and treatments
Human breast adenocarcinoma cells (MCF-7) and colorectal adenocarcinoma cells (HCT-15) were obtained from American Type Culture Collection (Manassas, VA). MCF-7 cells were maintained in Dulbecco’s modified Eagle medium (Invitrogen, Carlsbad, CA) supplemented with 10% fetal bovine serum (FBS, Invitrogen) and 0.01 mg/ml bovine insulin (Sigma-Aldrich, St. Louis, MO). HCT-15 cells were maintained in RPMI-1640 medium (Invitrogen) supplemented with 10% FBS. For comparisons between cells treated with scrambled negative and NPAS2-targeting siRNA oligos, cells for each treatment were harvested from the same colony at the same time. In addition, all experiments were run in parallel to control for the effects of time and cyclic gene expression.
siRNA transfections
siRNA oligos targeting NPAS2 (Duplex 1:Sense: GGGUGCCUCGGGCCUUAAUACCAGT, Antisense: ACUGGUAUUAAGGCCCGAGGCACCCAC, Duplex 2: Sense: CCCAGGGUCCAAAGCCAAUGAGAAG Antisense: CUUCUCAUUGGCUUUGGACCCUGGGUU Duplex 3: Sense: GGCACACUCUAUAGCCAUACUGGAC Antisense: GUCCAGUAUGGCUAUAGAGUGUGCCCA), a scrambled-sequence negative control siRNA with no known homology to the human genome to control for the effects of transfection, a positive control targeting the constitutively expressed housekeeping gene HPRT, and a fluorescent labeled transfection efficiency control were chemically synthesized by Integrated DNA Technologies (Coralville, IA). Each was diluted in Opti-Mem I reduced serum medium (Invitrogen) and complexed with Lipofectamine 2000 transfection reagent (Invitrogen) prior to transfection, per the manufacturer’s instructions. Each oligo was added to a 12 well culture dish followed by approximately 100,000 cells suspended in normal growth medium, for a final siRNA concentration of 10nM (reverse transfection). After 48 hours, cells were either harvested for quantitative, real-time reverse transcription PCR (qRT-PCR), or incubated with either phosphate buffered saline (PBS), pH 7.4 (neg. control), or 0.015% (v/v) methyl methanesulfonate (MMS, mutagenic agent) for use in subsequent assays. Cells transfected with the fluorescent oligo were visualized by fluorescence microscopy using an FITC filter. 50 randomly selected cells were assessed for oligo uptake, and greater than 90% were found to be successfully transfected.
Real-time RT-PCR and western blot
RNA was isolated from both MCF-7 and HCT-15 using the RNA Mini Kit (Qiagen, Valencia, CA), with on-column DNA digestion, according to the manufacturer’s instructions for mammalian cells. Quantitative, real-time reverse transcription PCR (qRT-PCR) conditions were prepared using the Quantitect one-step kit (Qiagen) according to the manufacturer’s protocol. Primers for 18s rRNA and NPAS2 were designed in-house and chemically synthesized by IDT (18s: 5′-ATCAACTTTCGATGGTAGTCG-3′ and 5′-TCCTTGGATGTGGTAGCCG-3′, NPAS2: 5′-TCTGGATCACAGAGCACCTC-3′ and 5′-CAGGAGCTCCAGGTCATCA-3′). Standard duplicated qRT-PCRs with disassociation curves were performed on a Stratagene MX3000P instrument (Stratagene). RNA quantity was normalized to 18s rRNA, and changes in RNA expression were quantified according to the 2−ΔΔCt method. To detect NPAS2 protein expression in MCF-7, we also performed a standard western blot using lysate of MCF-7 and rabbit polyclonal anti-NPAS2 (sc- 28708, Santa Cruz).
Pathway-specific expression array
Once NPAS2 knockdown was confirmed, (greater than two-fold reduction by qRT-PCR), the human DNA damage signaling RT2 profiler PCR array (SuperArray Bioscience) was used to assess the impact of NPAS2 reduction on the expression of 84 genes with known roles in DNA damage response. Synthesis of complementary DNA, real-time PCR, and statistical analyses were performed according to the manufacturer’s instructions, and the data shown represent the average of two replicates. Cycle thresholds were determined for each PCR product, with amplification curves occurring later then cycle 35 considered failed or unexpressed. Five housekeeping genes were included as RNA-content controls, and the three with the lowest standard deviations across replicates were used in the analysis (for MCF-7: B2M, GAPDH, and ACTB, for HCT-15: B2M, GAPDH, and HPRT1). The average difference in cycle threshold between the first and second replicates for these genes in the siRNA+ and siRNA- samples was 0.0 and 0.1 cycles respectively for MCF-7, and 0.0, and 0.4 for HCT-15, indicating excellent stability and reproducibility. In addition, a genomic DNA control primer set was included in each PCR run which can detect the presence of DNA contamination in each sample. The Ct for this product is compared to the average of the housekeeping genes, with a ΔCt value less than 4 indicating contamination. No sample came close to reaching this cutoff, and the average across all samples was 9.5 cycles (range 7.5 to 10.3) for MCF-7. No genomic DNA was detected in the HCT-15 samples (CT>35). All samples also passed additional QC for reverse transcription and PCR efficiency provided by the manufacturer. Finally, three genes with failed PCR amplification in 1+ replicate were removed from the MCF-7 analysis.
Cell cycle, cell viability, and apoptosis assays
For cell cycle analysis, cells were transfected with siRNA duplex 1 or negative control and incubated under normal conditions for 48 hours (37°C, 5% CO2). Cells were then treated for 1 hour with either MMS or PBS, washed and left overnight, and then harvested for analysis. Cells were incubated with propidium iodide (PI) stain and analyzed by flow cytometry using a fluorescence-activated cell sorter (FACS) flow cytometer (Becton Dickinson, San Jose, CA) according to methods previously described. Greater than 40,000 cells were counted, and data was analyzed using the FlowJo flow cytometry analysis software (Tree Star, Inc., Ashland, OR). Cell phases were determined by the software using the Watson pragmatic algorithm.19 For apoptosis and cell viability analyses, cells were stained with PI along with Annexin V using reagents in the Vybrant Apoptosis Assay Kit #2 (Invitrogen), according to the manufacturer’s protocol. 10,000 cells were counted, and each was categorized as live, dead, apoptotic, or ambiguous using the FlowJo flow cytometry analysis software (Tree Star, Inc). Cells that could not be definitively called by the software were excluded from the analysis, and percentages were calculated using the remaining population. All data are the result of 2 independent experiments.
DNA damage assay
DNA damage was assessed using the alkaline single-cell gel electrophoresis assay (comet assay). After the siRNA and MMS/PBS treatments mentioned above, cells were washed in PBS, then incubated in normal medium for 3 hours. Cells were then harvested and mixed with low-melting agarose and fixed onto slides. The cells were then lysed and DNA was denatured using an alkaline (pH > 14) solution at 4°C. Slides were then placed on a horizontal electrophoresis device which allows damaged and/or broken DNA to migrate away from the nucleus. Slides were then stained with ethidium bromide, visualized by fluorescence microscopy, and analyzed using the Komet 5 comet assay analysis software which quantitatively determines the extent of DNA damage in each sample using the mean Olive tail moment calculation as previously described (25).
Statistical analysis
All statistical analyses were performed using the SAS statistical software (SAS Institute, Cary, NC), unless otherwise noted. Differences in cell cycle progression for cells treated with scrambled negative siRNA and NPAS2-targeting siRNA were determined using the Pearson chi-square test comparing the percentage of the total cell population in each phase of the cell cycle for both cell populations. Differences in apoptotic response were determined by the Student’s t-test comparing the percentage of early apoptotic cells in each cell population. Cell viability was also determined by t-test of the percentage of live cells, and in both instances tests for equality of variance were not significant and pooled variances were used. Data was collected on 10,000 cells per sample and the data shown are based on duplicate experiments. Statistical analysis of DNA damage repair capacity was performed using the Komet 5 comet assay analysis software. Differences in DNA repair were determined for all pairwise associations of the four treatment groups (siRNA +/− and MMS +/−) using Fisher’s PLSD for the mean Olive tail moment. Gene expression differences in the PCR expression array were determined using the 2−ΔΔCt method as described above. If the gene was down-regulated, fold expression change was defined as −1/(fold difference). For example, if the fold difference (2−ΔΔCt) of a gene was 0.5, this would be expressed as a two-fold down-regulation, or a fold change of −2.
Acknowledgments
We are grateful to Chunhui Yi for assistance with antibody screening and Western blot. We also thank the flow cytometry core at Yale University for assistance with cell cycle and apoptosis assays. This work was supported by the US National Institutes of Health (grants CA122676, CA110937, and CA108369).
References
- 1.Filipski E, King VM, Li X, Granda TG, Mormont MC, Liu X, et al. Host circadian clock as a control point in tumor progression. J Natl Cancer Inst. 2002;94:690–697. doi: 10.1093/jnci/94.9.690. [DOI] [PubMed] [Google Scholar]
- 2.Fu L, Lee CC. The circadian clock: pacemaker and tumour suppressor. Nat Rev Cancer. 2003;3:350–361. doi: 10.1038/nrc1072. [DOI] [PubMed] [Google Scholar]
- 3.Reick M, Garcia JA, Dudley C, McKnight SL. NPAS2: an analog of clock operative in the mammalian forebrain. Science. 2001;293:506–509. doi: 10.1126/science.1060699. [DOI] [PubMed] [Google Scholar]
- 4.Dioum EM, Rutter J, Tuckerman JR, Gonzalez G, Gilles-Gonzalez MA, McKnight SL. NPAS2: a gas-responsive transcription factor. Science (New York, NY) 2002;298:2385–2387. doi: 10.1126/science.1078456. [DOI] [PubMed] [Google Scholar]
- 5.Zhu Y, Leaderer D, Guss C, Brown HN, Zhang Y, Boyle P, et al. Ala394Thr polymorphism in the clock gene NPAS2: a circadian modifier for the risk of non-Hodgkin’s lymphoma. Int J Cancer. 2007;120:432–435. doi: 10.1002/ijc.22321. [DOI] [PMC free article] [PubMed] [Google Scholar]
- 6.Zhu Y, Stevens RG, Leaderer D, Hoffman A, Holford T, Zhang Y, et al. Non-synonymous polymorphisms in the circadian gene NPAS2 and breast cancer risk. Breast Cancer Res Treat. 2007 doi: 10.1007/s10549-007-9565-0. [DOI] [PMC free article] [PubMed] [Google Scholar]
- 7.Vitaterna MH, King DP, Chang AM, Kornhauser JM, Lowrey PL, McDonald JD, et al. Mutagenesis and mapping of a mouse gene, Clock, essential for circadian behavior. Science. 1994;264:719–725. doi: 10.1126/science.8171325. [DOI] [PMC free article] [PubMed] [Google Scholar]
- 8.Bunger MK, Wilsbacher LD, Moran SM, Clendenin C, Radcliffe LA, Hogenesch JB, et al. Mop3 is an essential component of the master circadian pacemaker in mammals. Cell. 2000;103:1009–1017. doi: 10.1016/s0092-8674(00)00205-1. [DOI] [PMC free article] [PubMed] [Google Scholar]
- 9.Asher G, Schibler U. A CLOCK-less clock. Trends in cell biology. 2006;16:547–549. doi: 10.1016/j.tcb.2006.09.005. [DOI] [PubMed] [Google Scholar]
- 10.DeBruyne JP, Weaver DR, Reppert SM. CLOCK and NPAS2 have overlapping roles in the suprachiasmatic circadian clock. Nature neuroscience. 2007;10:543–545. doi: 10.1038/nn1884. [DOI] [PMC free article] [PubMed] [Google Scholar]
- 11.Fu L, Pelicano H, Liu J, Huang P, Lee C. The circadian gene Period2 plays an important role in tumor suppression and DNA damage response in vivo. Cell. 2002;111:41–50. doi: 10.1016/s0092-8674(02)00961-3. [DOI] [PubMed] [Google Scholar]
- 12.Reppert SM, Weaver DR. Coordination of circadian timing in mammals. Nature. 2002;418:935–941. doi: 10.1038/nature00965. [DOI] [PubMed] [Google Scholar]
- 13.Schibler U, Sassone-Corsi P. A web of circadian pacemakers. Cell. 2002;111:919–922. doi: 10.1016/s0092-8674(02)01225-4. [DOI] [PubMed] [Google Scholar]
- 14.Yamamoto T, Nakahata Y, Soma H, Akashi M, Mamine T, Takumi T. Transcriptional oscillation of canonical clock genes in mouse peripheral tissues. BMC Mol Biol. 2004;5:18. doi: 10.1186/1471-2199-5-18. [DOI] [PMC free article] [PubMed] [Google Scholar]
- 15.Storch KF, Lipan O, Leykin I, Viswanathan N, Davis FC, Wong WH, et al. Extensive and divergent circadian gene expression in liver and heart. Nature. 2002;417:78–83. doi: 10.1038/nature744. [DOI] [PubMed] [Google Scholar]
- 16.Lowrey PL, Takahashi JS. Mammalian circadian biology: elucidating genome-wide levels of temporal organization. Annu Rev Genomics Hum Genet. 2004;5:407–441. doi: 10.1146/annurev.genom.5.061903.175925. [DOI] [PMC free article] [PubMed] [Google Scholar]
- 17.Lee CC. Tumor suppression by the mammalian Period genes. Cancer Causes Control. 2006;17:525–530. doi: 10.1007/s10552-005-9003-8. [DOI] [PubMed] [Google Scholar]
- 18.Hua H, Wang Y, Wan C, Liu Y, Zhu B, Yang C, et al. Circadian gene mPer2 overexpression induces cancer cell apoptosis. Cancer Sci. 2006;97:589–596. doi: 10.1111/j.1349-7006.2006.00225.x. [DOI] [PMC free article] [PubMed] [Google Scholar]
- 19.Ross K. Circadian rhythms play role in cancer research. J Natl Cancer Inst. 2006;98:806–807. doi: 10.1093/jnci/djj269. [DOI] [PubMed] [Google Scholar]
- 20.Partonen T, Treutlein J, Alpman A, Frank J, Johansson C, Depner M, et al. Three circadian clock genes Per2, Arntl, and Npas2 contribute to winter depression. Annals of Medicine. 2007;39:229–238. doi: 10.1080/07853890701278795. [DOI] [PubMed] [Google Scholar]
- 21.Nicholas B, Rudrasingham V, Nash S, Kirov G, Owen MJ, Wimpory DC. Association of Per1 and Npas2 with autistic disorder: support for the clock genes/social timing hypothesis. Molecular psychiatry. 2007;12:581–592. doi: 10.1038/sj.mp.4001953. [DOI] [PubMed] [Google Scholar]
- 22.Bullough JD, Rea MS, Figueiro MG. Of mice and women: light as a circadian stimulus in breast cancer research. Cancer Causes Control. 2006;17:375–383. doi: 10.1007/s10552-005-0574-1. [DOI] [PubMed] [Google Scholar]
- 23.Davis S, Mirick DK. Circadian disruption, shift work and the risk of cancer: a summary of the evidence and studies in Seattle. Cancer Causes Control. 2006;17:539–545. doi: 10.1007/s10552-005-9010-9. [DOI] [PubMed] [Google Scholar]
- 24.Stevens RG. Artificial lighting in the industrialized world: circadian disruption and breast cancer. Cancer Causes Control. 2006;17:501–507. doi: 10.1007/s10552-005-9001-x. [DOI] [PubMed] [Google Scholar]
- 25.Olive PL, Banath JP, Durand RE. Heterogeneity in radiation-induced DNA damage and repair in tumor and normal cells measured using the “comet” assay. Radiat Res. 1990;122:86–94. [PubMed] [Google Scholar]