Summary
The current study examined whether modest concentrations of MDMA could increase the survival and/or neurite outgrowth of fetal midbrain dopamine (DA) neurons in vitro since increased DA neurite outgrowth has been previously observed in vivo from prenatal exposure. MDMA concentrations in fetal brain were quantified to determine relevant in vivo concentrations to employ in vitro. A dose-response study in vitro demonstrated that MDMA, at concentrations observed in vivo, resulted in increased, DA-specific, neuron survival. Higher doses resulted in nonspecific neurotoxicity. MDMA application immediately after culture establishment resulted in greater survival than delayed application, however both were superior to control. MDMA significantly increased the expression of the slc6a3 gene (dopamine transporter; DAT) in culture. Co-application of the DAT reuptake inhibitor methylphenidate (MPH) with MDMA attenuated this effect. Progressive reductions in MPH concentrations restored the MDMA-induced survival effect. This suggests that MDMA’s action at DAT mediates the survival effect. Neurite density per neuron was unaffected by MDMA in vitro suggesting that MDMA promotes DA neuron survival but not neurite outgrowth in culture. Finally, animals prenatally exposed to MDMA and examined on postnatal day 35 showed an increase in tyrosine hydroxylase-positive (TH+) neurons in the substantia nigra but not in the ventral tegmental area. These data suggest that during development, MDMA can increase the survival of DA neurons through its action at its transporter. Understanding how MDMA increases DA neuron survival may provide insight into normal DA neuron loss during development.
Keywords: MDMA, Culture, Drug Abuse, Substantia Nigra, Ventral Tegmental Area
Introduction
The widely abused club-drug 3,4-methylenedioxymethamphetamine (MDMA or ‘ecstasy’) is a substituted amphetamine that binds with high affinity to the dopamine and serotonin transporters (DAT and SERT, respectively; for a review see (Green et al., 2003)). MDMA has been shown to reduce the phenotypic expression of 5-HT throughout the adult brain (Colado and Green, 1995). Some consider this loss of phenotype evidence for MDMA-induced serotonin neurotoxicity in adults (McCann and Ricaurte, 1991; Ricaurte et al., 1988b; Ricaurte et al., 1988a) while others are more skeptical (for reviews see (Baumann et al., 2007; Helton et al., 1993).
In contrast, rats prenatally exposed to MDMA exhibit few discernible changes in serotonin (5-HT) neurochemistry when examined postnatally at various ages (Galineau et al., 2005; Koprich et al., 2003; Srivastava and Crippen, 1993; St Omer et al., 1991). However, prenatal MDMA increased the mesocortical dopaminergic innervation of prefrontal cortex by more than 4-fold (Koprich et al., 2003). Significant increases in TH+ neuropil density in the striatum and the nucleus accumbens were also evident. These changes were accompanied by reduced dopamine (DA) turnover which resulted in significantly lower levels of DA metabolites. These findings implied that MDMA acts on the developing fetus to increase DA neuron differentiation, survival and/or promote neurite outgrowth into target structures (Koprich et al., 2003).
The mechanisms underlying MDMA’s ability to increase fetal dopaminergic neurite density are currently unknown. The effect could be a direct result of MDMA acting on developing DA neurons via its actions at DAT, or an indirect result of maternal factors impinging upon fetal development, such as peripheral alterations in hormones, growth factors or vascular perfusion in response to MDMA administration. In the present series of experiments we utilized primary mesencephalic cell culture to determine whether direct application of MDMA could specifically promote DA neuron survival and neurite outgrowth. Use of this in vitro approach allowed us to evaluate MDMA’s effect on midbrain DA neurons, independent of maternal, placental or fetal factors.
Methods
Experimental Overview
Experiment 1: Determination of Fetal Brain MDMA Levels
We have previously determined that 4 days in vitro (DIV, equivalent to E14-E18) is an optimal cell culture interval for determining the effectiveness of trophic compounds in primary mesencephalic cultures (Collier et al., 2003). Therefore, to add external validity to this in vitro MDMA model, it was imperative to determine the levels of MDMA achieved in fetal brains as a result of repeated MDMA administration from E14-E18. By incorporating these fetal brain MDMA concentrations into our in vitro model, we can more closely parallel our in vivo model (Koprich et al., 2003). We previously quantified levels of MDMA in fetal brains following a single 15-mg/kg injection to the dam on E14 only (Campbell et al., 2006). However, since MDMA can inhibit its own metabolism in the liver (Ramamoorthy et al., 2002), subsequent MDMA injections to the pregnant dam should result in accumulating MDMA levels in the fetal brain over successive days through E18. We therefore needed to determine the range of fetal brain MDMA levels achieved at both E14 and E18 to determine an effective range of concentrations to use in culture that were equivalent to levels observed in actual fetal brains to achieve parity. The results of the current experiment, along with our previous published work (Campbell et al., 2006), would provide us with a realistic range of drug levels to utilize in cultures derived from E14 embryos and grown for 4 DIV (E18 equivalent).
Pregnant rat dams were administered racemic MDMA (NIDA Research Drug Supply System, Bethesda MD) via subcutaneous (s.c.) injection (15 mg/kg 2× per day) beginning on E14. This is the same dosing regimen that dams received in the previously published study that demonstrated increases in DA fiber density from prenatal MDMA and based upon interspecies scaling is equivalent to human dosing ranges (Campbell et al., 2006; Koprich et al., 2003; Ricaurte et al., 2000). On E18, dams were randomly assigned to one of 9 post-drug administration time points. Each dam then received a final 15 mg/kg s.c. injection of racemic MDMA on E18 (designated time zero). In order to eliminate the influence of anesthetics on MDMA distribution, unanesthetized dams were decapitated at 0 min, 30 min, 60 min, 90 min, 2 hr, 4 hr, 6 hr, or 8 hr post-injection. Fetal brains were collected and quantified for MDMA according to our previously published high performance liquid chromatography (HPLC) protocol (Campbell et al., 2006). Typically, quantitation of compounds in tissues are normalized based upon protein quantitation, but such a standardization will not provide drug molarity per unit volume of tissue. Therefore, determinations of MDMA molarity in fetal brain were based upon quantified levels of MDMA and estimation of fetal brain volume. Brain weights were converted to volumetric estimates based upon brain pycnometric (the determination of volume by displacement) studies that consistently calculate brain density to be near 1μg/μl (DiResta et al., 1990; DiResta et al., 1991). All subsequent in vitro studies included at least a single concentration that fell within the range of in vivo fetal brain levels.
Experiment 2: MDMA Dose Response Study
Primary mesencephalic cultures were allowed to attach to the substrate for 1 hr and then exposed to different concentrations of racemic MDMA (ranging from 0.75 μM to 750 μM) in hormone supplemented serum free medium (HSSF) for a period of 96 hr without a media change. A media change to replenish MDMA was not necessary because its metabolism occurs only via liver conjugation, and it is stable in biological fluids for several months (Clauwaert et al., 2001). After fixing and immunostaining for TH, cultures were quantified for TH+ neuron survival.
A separate set of cultures were subjected to the MTT assay which is a relative measure of cell viability in culture. These cultures were also exposed after attachment to different concentrations of racemic MDMA (ranging from 0.7 5 μM to 750 μM) in hormone supplemented serum free medium (HSSF) for a period of 96 hr without a media change. Cultures were then processed for cell viability via the MTT assay (see General Methods).
Experiment 3: “Early” vs. “Late” MDMA Exposure
Previous studies have revealed that the mesencephalic dissection and dissociation procedure itself can trigger the death of TH+ neurons (Marchionini et al., 2003; Sortwell, 2003). In order to determine if MDMA effects on the survival of TH+ neurons were a result of early intervention after plating, the effect of “early” vs “late” MDMA exposure was evaluated. Cultures were subjected to one of four conditions: CTRL: HSSF media for 96hr, EARLY: MDMA media during the first 48 hr followed by control media for 48 hr, LATE: control media for 48 hr followed by MDMA media during the final 48 hr or MDMA: MDMA media throughout the entire 96 hr incubation. In all MDMA-containing treatments the MDMA concentration that resulted in the greatest survival of TH+ neurons (37.5 μM) as determined in Experiment 1, was utilized. A media change was conducted in all four conditions at 48 hr. All cultures were then fixed and immunostained at 96 hours to evaluate TH+ neuron survival.
Experiment 4: Changes in slc6a3 Gene Expression in Response to MDMA
Since the main bdingin site for MDMA’s action on dopamine neurons in the dopamine transporter (DAT), we endeavored to determine whether MDMA exposure altered the levels of the slc6a3 gene which encodes DAT. Cultures were incubated for 96 hours in HSSF medium with or without the addition of 37.5 μM MDMA. “Sentinel” wells of these cultures were also fixed, stained for TH and counted to ensure that the MDMA-induced increase in DA neuron survival was evident. Cultures were then subjected to qPCR to whether MDMA exposure altered the expression level of the slc6a3 gene.
Experiment 5: Methylphenidate Antagonism Studies
Methylphenidate (MPH) is a stimulant with a relatively high affinity for DAT. It was utilized to determine if it could attenuate the MDMA survival effect on TH+ neurons observed in the previous experiments. MPH has approximately a 100-fold greater affinity for DAT in striatum than does MDMA based upon scatchard analyses (Battaglia et al., 1988; Schweri et al., 1985). In the first part of this experiment, MPH was added to cultures at an initial concentration of 2 μM which is approximately 10-fold higher than its estimated Kd of 235 nM (Schweri et al., 1985) to ensure its ability to outcompete MDMA at DAT. Cultures were subjected to one of four conditions: CON: control media, MDMA: MDMA media, MDMA/MPH: MDMA + MPH media or MPH: MPH media. All MDMA treatments were at 37.5 μM. After 96 hrs of incubation, all cultures were fixed and immunostained to evaluate TH+ neuron survival. In the second part of Experiment 5, MPH concentrations were progressively reduced to determine whether the MDMA-induced survival effect on TH+ neurons returned when MDMA could outcompete MPH for DAT occupancy. All cultures were then fixed and immunostained at 96 hours to evaluate TH+ neuron survival.
Experiment 6: Effects of MDMA and Methylphenidate on TH+ Neurite Outgrowth
Additional mesencephalic cultures were examined for the impact of MDMA and/or MPH on density of TH+ neurites. Cultures were exposed to the same 4 conditions as outlined in Experiment 5: CON, MDMA, MDMA/MPH or MPH. All cultures were then fixed and immunostained at 96 hours to evaluate TH+ neurite density and neuron survival utilizing modified stereologic sampling strategies for culture (Peterson and Jones, 1993).
Experiment 7: Consequences of Prenatal MDMA Exposure on SN DA neuron numbers at P35
Pregnant rats were exposed to MDMA from E14-20 following our previously published protocol and sacrificed at P35. The age P35 was chosen because it was determined that it was the earliest age that sufficient numbers of high quality sections through the midbrain could be attained for stereologic determination. This age allowed us to examine, at the earliest practical time point, whether numbers of DA neurons were increased, and also whether such changes were long lasting in response to prenatal MDMA exposure. Male offspring were sacrificed at P35 and the tissue subjected to TH immunohistochemistry as in the previous study (Koprich et al 2003). DA cell bodies of the substantia nigra (SN) and ventral tegmental area (VTA) were quantified using unbiased stereology.
General Methods
Animals
Timed-pregnant Sprague–Dawley (SD) rats (Zivic–Miller) were received in E8 (day of conception = E0) and were placed on a 12 h light/dark cycle (6AM lights on) in a temperature (21 ± 2 °C) and humidity (40–50%) controlled room. Subjects were individually housed and given free access to food and water. The animal facility was accredited by the Association for the Assessment and Accreditation of Laboratory Animal Care and complied with all Federal animal care and use guidelines. Protocols were all approved by the Institutional Animal Care and Use Committee of the University of Cincinnati.
Mesencephalic dissection and dissociation
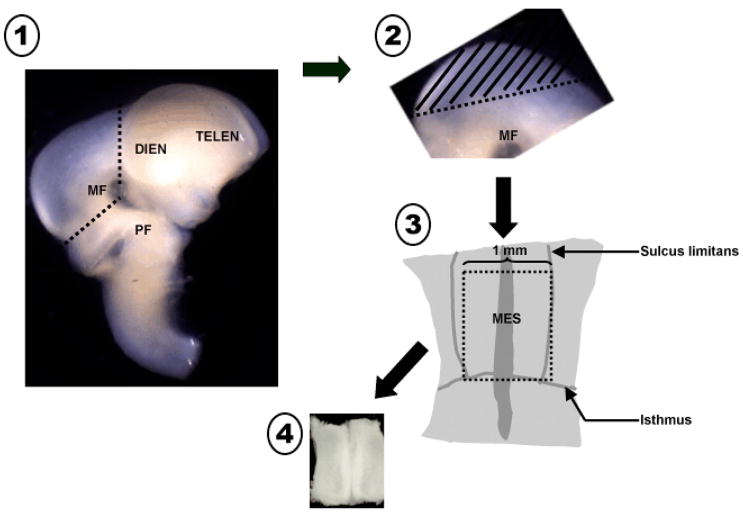
Pregnant rat dams were anesthetized on E14 and fetuses excised as previously described (Koprich et al., 2003). The ventral mesencephalon from fetal donors were isolated under a dissecting scope and pooled in sterile, cold Ca2+/Mg2+-free buffer (CMF: 90% sterile water; 10% 10X Dulbecco’s phosphate buffered saline, 1% fungizone, 0.1% 50mg/ml gentamicin, 0.5% 20% glucose). The ventral portion of the mesencephalic flexure (MF) was isolated from each fetal brain with the isthmus, the sulcus limitans and the rostral limit of the flexure serving as boundaries (fig. 1). This dissected portion of the ventral mesencephalon (VM) is free of serotonergic and noradrenergic neurons, and typically yields at least 10% TH+ neurons. The pooled tissue was thoroughly rinsed with CMF. The tissue was then incubated in a 0.125% trypsin solution at 37°C degrees for 10 minutes, rinsed again with CMF and then triturated with a trypsin inactivating solution to dissociate the cells into a homogeneous suspension. Cell viability was quantified by adding Trypan blue to a sample of the cell suspension and cells that excluded the dye were counted using a hemocytometer. The concentration was then adjusted to 3000 cells/μl with HSSF media (90% Dulbecco’s Modified Eagle Medium, 1% albumin, Apo-transferrin, and 3μM sodium selenite solution; 20nM progesterone, 1% insulin, 1% 30nM L-Thyroxine, 1% fungizone 0.5% L-Glutamine; 0.025% gentamycin) with a final glucose concentration of 17.5 mM. Each dissection and dissociation experiment used 3 dams with a cumulative average of 35 embryos per harvest, which typically yielded between 7 and 10 million cells. Each ventral mesencephalon dissected typically contributed approximately 200,000 cells to the total yield.
Figure 1.
Schematic diagram illustrating the microdissection technique to harvest ventral mesencephalic tissue. 1. Incisions are made at the rostral and caudal borders of the mesencephalic flexure to excise the mesencephalon. 2. The dorsal segment of the mesencephalon (tectum, //////) is removed and discarded. 3. The remaining ventral tegmental tissue is laid flat exposing the floor of the 4th ventricle. Incisions of appropriate length are made utilizing the isthmus and sulcus limitans as landmarks. 4. The isolated ventral mesencephalic tissue piece is collected and processed to single cell suspension. MF = mesencephalic flexure, PF = pontine flexure, DIEN = diencephalon, TELEN = telencephalon, MES = mesencephalon,----------- = incision line.
Cell Culture
Primary dissociated ventral mesencephalic cells were plated in 24-well poly-D lysine coated plates using a modification of the microisland technique (Marchionini et al., 2003; Takeshima et al., 1996). The microislands are dry plated in 10 μl aliquots of 3000 cells/μl which results in microislands of 30,000 cells/well. After plating the cultures were incubated at 37 °C for 1 hr to allow for settling and adhesion of cells. Wells are then flooded with HSSF media alone or with an appropriate experimental treatment for 96 hr (4 DIV) prior to being fixed and stained. It is important to note here that the microisland method results in cell adhesion within 1 hr, and all treatments began after this cell adhesion stage such that treatments should not result in changes in cell attachment.
Control wells were always present on all plates. Each condition was replicated in three to six wells on each plate depending upon the experimental plate layout. In addition, each experiment was reproduced on at least three separate occasions using separate fetal harvests. (The only exception was that the coverslip cultures in experiment 7 were a result of a single harvest. This was done because the results were already confirmed in triplicate experiment 5 and simply represented an alternate counting method to examine neurite density.) Replicate studies from different weeks were merged and statistical analyses were performed on treatments normalized as a percent of their own plate controls. Microislands that displayed any mechanical damage associated with aspiration or immunocytochemical processing were excluded from statistical analysis.
Due to the sensitivity of the MTT life assay, a modification of the dry plating microisland technique was used. Cells were suspended at a concentration of 1000 cells/ul in HSSF (control) media. The cell suspension was aliquoted at 200 ul per well which resulted in baseline population of 200,000 cells in each well. The cells were allowed to adhere to the plates for an hour prior to spiking the media with different concentrations of MDMA.
Immunostaining
After treatment periods, the media was removed and cells were rinsed in 37°C Tris buffered saline (TBS; pH 7.3), fixed in 4% paraformaldehyde in 0.1 M PO4 buffer for 30 min and rinsed in TBS again. Cells were then permeabilized with 0.25% Triton-X and TBS solution for 30 min, followed by incubation in primary mouse anti-tyrosine hydroxylase antibody (TH; 1:4000; MAB318, Chemicon, Temecula, CA) overnight at 4 degrees. To block for endogenous perioxidases, 1% goat serum was added to the TH solution. The cells were rinsed in TBS, and incubated in biotinylated goat-anti-mouse IgG antibody (1:400; AP124B, Chemicon, Temecula, CA) for 1 hr followed by the Vector ABC detection kit (PK6100; Vector Laboratories, Burlingame, CA). Cells were visualized with 0.5 mg/ml 3,3-diaminobenzidine (DAB) and 0.03% hydrogen peroxide in TBS.
MTT Cell Survival Assay
The MTT Assay Kit (#10009365, Cayman Chemicals, Ann Arbor, MI) determines the relative abundance of cells in culture by cellular conversion of MTT (3-(4,5-Dimethylthiazol-2-yl)-2,5-diphenyltetrazolium bromide) by NAD(P)H-oxidoreductases (Berridge et al., 2005). The assay was conducted as per the manufacturers instructions. Briefly, after 96hr of exposure to each condition in culture, 20ul of the MTT reagent was added and the cultures were mixed gently on an orbital shaker for 1 min. The cultures were returned to the incubator for 3 hr. The culture media was then aspirated and 200ul of the Crystal Dissolving Solution was added to each well. The plate was then placed in an orbital shaker for 20 minutes to allow full solubilization of the formazan product. The absorbance was then read at 570nm on a Thermo Multiskan Spectrum microplate reader. The greater the absorbance, the more cells were present in each well.
RNA Extraction
RNA from the cultures was isolated using the Qiagen QIAshredder (cat # 79654) and RNeasy Plus Mini kit (cat # 74134). The Qiagen protocol for purification of total RNA from animal cells was used, with the use of the QIAshredder homogenizer and addition of an extra wash with 500 μL buffer RPE to remove residual salts. Briefly, the protocol is as follows: Growth medium was aspirated from the macroislands, and wells were washed 2 times with 37°C TBS. The TBS was aspirated off and 600 μL of the lysis buffer RLT Plus containing β-ME was added to each well. The cell lysate was collected using a cell scraper and transferred to a QIAshredder spin column which was then spun to homogenize the lysate. An equal volume of 70% ethanol was added to the flowthrough, and this sample was applied to an RNeasy spin column. Following a brief spin to bind the RNA to the column, the column was washed with 700 μL buffer RW1 to remove proteins. The column was then washed 3 times with 500 μL buffer RPE to remove salts and contaminants. The RNA was eluted from the column by passing 30 μL RNase-free water through the column twice, resulting in 60 μL of eluate. The RNA was quantified using a nanodrop ND-1000 spectrophotometer (Nanodrop Technologies, Wilmington, DE).
qPCR
RNA from cultures was converted to cDNA using the ABI High-capacity cDNA archive kit (cat# 4322171) as per the protocol included in the kit. The RNA (concentration determined by nanodrop) was assumed to be converted 100% to cDNA. A Taqman® genomic expression assay for slc6a3 (dopamine transporter) was utilized (ABI Rn0056224_m1). 20 ng of cDNA was added to each 50 μL reaction mixture, which also contained forward and reverse primers, a probe sequence and Taqman® master mix. Additional reactions containing RNA only (no cDNA) were amplified to ensure no genomic contamination. qPCR reactions to control for cDNA quantities were run using the neural specific ribosomal protein L32 as an endogenous control. Forward (R) and reverse (L) primers as well as the probe (P) sequence were synthesized by ABI. The sequences were as follows: R: 5′AGCCAGAAAGGACGTTTTC, L: 5′CAGACGCACCATCGAAGTTA, P: 5′6FAM ACATTTGCCCTGAATGTGGT MGBNFQ. The Q-PCR reactions were run on an ABI 7500 real-time thermocycler using the following method: Step 1: Incubation at 50 °C for 2 minutes. Step 2: Incubation at 95 °C for 10 minutes. Step 3: Denaturation at 95 °C for 15 seconds followed by annealing-elongation at 60 °C for 1 minute followed by data collection. Step 3 was cycled 40 times for the qPCR run. Cycle thresholds were chosen during the linear phase of amplification using the AutoCT function.
Manual Cell Counting
Cell viability assays generally provide survival information regarding all cells in a given culture well. Such methods are effective for homogeneous cell populations. Since primary mesencephalic culture are generally 5–10% dopamine neurons, manual cell counting of immunohistochemically stained cells is needed.
Manual counts of immunocytochemically identified TH+ neurons in cell culture experiments were performed by an investigator blinded to experimental conditions using a 3×3 grid (9 fields) at 20x in the center of the microisland using an inverted microscope (Nikon Diaphot 300). Typical counts of TH+ neurons using this method are approximately 200–300 per microisland. This allowed for quantitation of the microisland in its densest and most uniform areas as described previously (Marchionini et al., 2003; Sortwell et al., 2000).
Stereology Assisted In Vitro Neuron and Neurite Counting
To examine TH+ neurite density (and secondarily neuron numbers in the same cultures), microisland cultures were plated on poly-D-lysine coated coverslips in 24 well culture plates. Cultures were exposed to control media (HSSF) or media containing MDMA, MPH, or MDMA and MPH together. After immunostaining for TH, the coverslips were mounted on glass slides using VectaMount AQ (Vector Laboratories, Burlingame, CA). This allowed for the use of a stereologic microscope system for estimating both TH+ neurite density and TH+ neuron numbers.
Cultures were quantified with Stereo Investigator software (MBF Bioscience). A standardized contour to define the counting area was used on all cultures and included approximately 80% of the microisland. The petrimetric (sine-wave) probe option was employed with a Merz radius of 50 μm, a grid size of 400×400 μm and a counting frame of 200×200 μm (fig. 2). An investigator blinded to the treatment groups quantified TH+ neurons within each counting frame following standard inclusion criteria, as well as any neurites that crossed the petrimetric probe within each counting frame.
Figure 2.
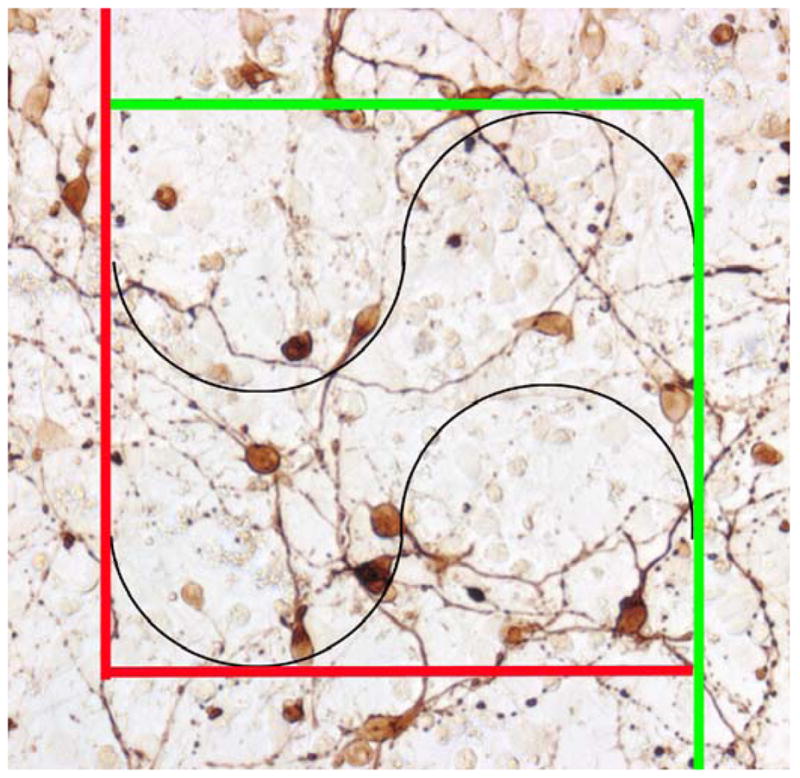
Example of the counting frame used to count both neurites and neurons in cover-slip mounted cultures from experiment 6 using the Stereo Investigator software. Any neuronal cell bodies within the counting frame our touching the green line were included while those outside the frame or touching the red line were excluded. Any neurite that crossed the black lines (Merz radius) within the counting frame was counted. If the same neurite crossed a black line more than once, each instance was counted.
Stereological Counts of DA neurons in the SN and VTA
Estimates of TH+ neuronal number within the substantia nigra (SN) and the ventral tegmental area (VTA) were performed in P35 rat brains following stereologic principles (West, 1993). Comparable sections were chosen from each experimental subject and matched for level by using standard landmarks (every sixth section was used). All samples were captured and analyzed from coded slides by a single blinded investigator. For each tissue section analyzed, section thickness was measured empirically. A guard zone of 2–4 μm was established on each section. The SN and VTA were outlined under a low magnification and approximately 10% of the outlined regions were analyzed using a random sampling design. The coefficients of error (CE) were calculated for each subject using the Gundersen correction and were all lower than 0.1. Digital images of TH-immunostained sections were visualized using an Olympus BX-60 microscope (Melville, NY) at 100× magnification using a CCD video camera (HV-C20, Hitachi, San Jose, CA) with a computer interface running Stereo Investigator 5.05 using the optical fractionator technique (Microbrightfield, Williston, VT).
Statistical Analyses
Studies utilized either a one or two-way ANOVA depending upon the experimental design. Post-hoc pairwise comparisons utilized the Holm-Sidak correction. For the gene expression study only, fold changes for the slc6a3 gene were normalized to L32 gene expression and calculated and subjected to t-test analysis using the Relative Expression Software Tool (REST-XL).
RESULTS
Experiment 1: Fetal Brain Levels of MDMA
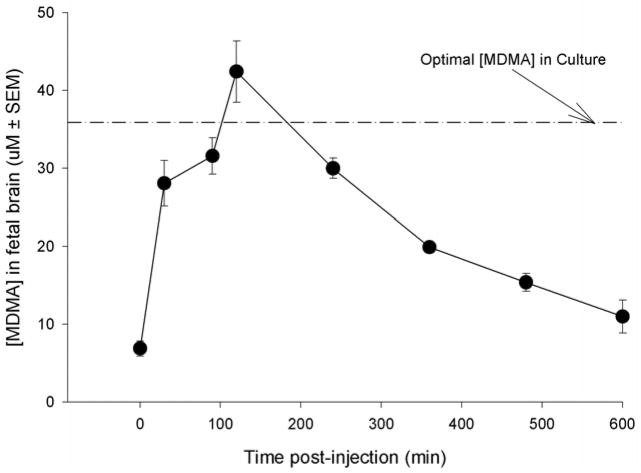
At time zero (tzero) on E18, MDMA concentration in brain was at 6.88 ± 0.648 μM as a result of the carryover from repeated exposure on prior days. By 30 min fetal brain MDMA levels had risen to 66.1% of the maximum recorded concentration (28.04 μ 2.92 μM). Through visual inspection of the concentration-time curve, MDMA levels reached an apparent maximum concentration (Cmax) of 42.41 ± 3.93 μM at 120 min post-injection (tmax). The rate of elimination (kelim) was determined to be 0.099 min−1 and the elimination half-life (t1/2) of 4.1 hr (fig. 3).
Figure 3.
The concentration of MDMA as a function of time in fetal brain after a 15 mg/kg s.c. injection of MDMA on E18 to the dam. The dam had been injected previously from E14 to E17 with 15 mg/kg MDMA (b.i.d). The dashed line represents the concentration of MDMA used in culture studies. Each time point represents three fetuses from a separate dam. These data demonstrate that the concentration of MDMA used for in vitro culture studies are within the physiologic range of a fetus exposed to a 15 mg/kg injection of MDMA to a drug-experienced dam.
In summary, the range of MDMA fetal brain concentrations in drug experienced animals receiving a single injection on E18 was 6.88 μM (tzero) to 42.41 μM (apparent Cmax). Our previously published study that examined the time-concentration relationship in drug-naive fetuses at E14 had an apparent Cmax of 24.89 μM (Campbell et al., 2006) which fell in the mid-range between the calculated values at tzero and tmax in the current study. Therefore, all subsequent studies in culture utilized at least a single MDMA concentration that fell within this in vivo range (37.5 μM, see results of experiment 2).
Experiment 2: MDMA Enhances TH+ Neuron Survival in Dose-Dependent Manner
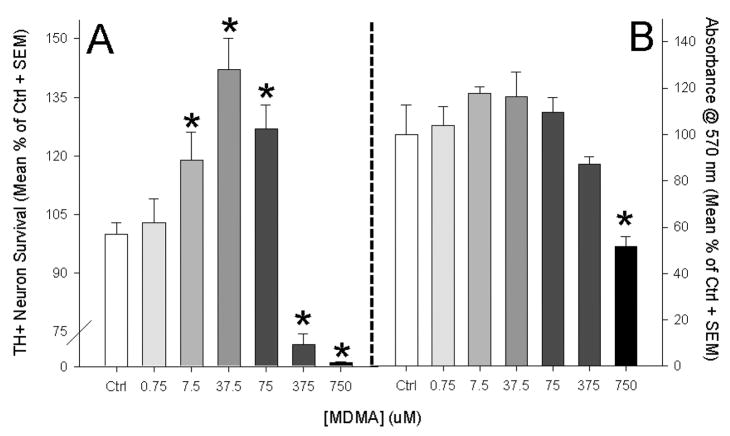
A dose response ranging from 0.75 μM to 750 μM was employed to determine MDMA’s effect on TH+ neuron survival (fig. 4a). An overall effect of treatment was evident F(6,102)=10.561, p<0.01. The lowest concentration of MDMA (0.75 μM) was not significantly different from HSSF-only control cultures. However, MDMA concentrations of 7.5 μM, 37.5 μM and 75 μM resulted in significant increases in TH+ neuron number as compared to control cultures as measured by post-hoc pairwise comparisons (Holm-Sidak, see figure 3a). The 750 μM condition produced non-specific toxicity that resulted in a complete loss of TH+ cells in culture as well as an observable reduction in unstained cells.
Figure 4.
Dose response curve for E14 midrain neurons over a 96 hr MDMA exposure in vitro. A: MDMA significantly enhanced TH+ neuron survival when incubated within a physiologically relevant range based upon our in vivo model. General toxicity was observed in concentrations higher than 75 μM. The greatest survival occurred in the 37.5 μM MDMA condition. B: MTT Assay: MDMA had no effect on general cell viability until 750 μM was applied which resulted in a significant reduction in cell survival. Together, these data demonstrate that MDMA’s ability to enhance cell survival is specific to DA neurons. (Graphs represent a merging of 4 repeated experiments; *= p<0.05 vs. control)
The MTT assay, which examines the sum viability of all cells present in the culture (not just TH+ neurons) also demonstrated an effect of drug treatment (F(6,105)=36.19, p<0.001). However, post-hoc analysis indicated that concentrations of MDMA ranging from 0.75 μM to 375 μM had no effect on total cell viability, whereas a concentrations of 750 μM resulted in a significant 48.2% reduction in cell viability (t=5.722, p<0.001). This suggested that doses sufficient to increase TH+ neuronal survival (7.5 to 75 μM) did not increase the survival of the total neuron population in culture. In addition, the highest dose (750 μM) resulted in both TH+ cell loss and reductions overall cell viability. Taken together these data indicated that MDMA’s ability to increase neuron survival was specific to TH+ neurons.
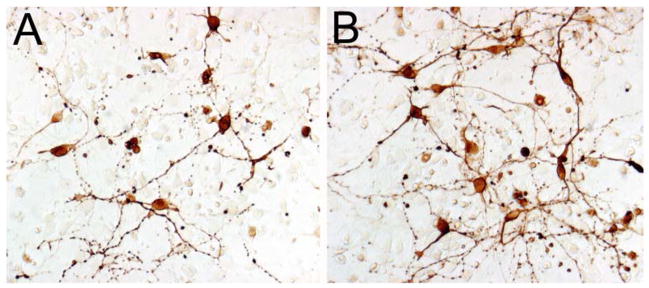
The condition containing 37.5 μM MDMA (fig. 4a,5) resulted in the greatest survival of TH+ neurons. Since this condition resulted in the greatest TH+ neuron survival and was within the putative in vivo range, this concentration was used as the standard MDMA treatment in the remaining culture experiments.
Figure 5.
Representative image of TH+ cultures after 4 DIV in the absence (A) or presence (B) of 37.5 μM MDMA. Scale bar in A = 20 μm.
Experiment 3: Early and Late MDMA Exposure Enhance TH+ Neuron Survival
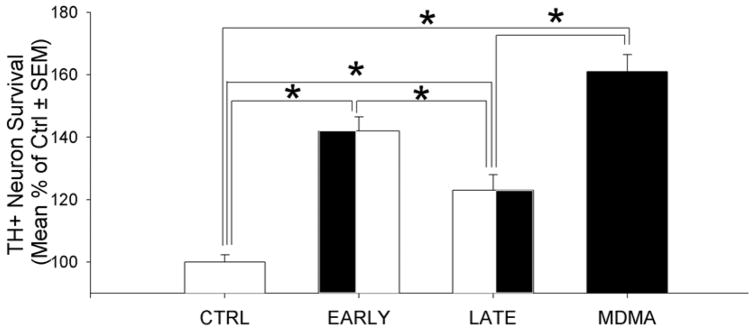
Using the optimal MDMA concentration from the prior experiment, MDMA exposure was assessed during the entire four day exposure (MDMA), the first two days (EARLY) and the last two days (LATE) and compared to control media alone (CTRL). An increase in TH+ neuron survival from MDMA treatment was observed (F(3,47)= 27.969, p<0.001). Post-hoc pairwise comparisons determined that the MDMA (61.3% increase), EARLY (42.1% increase) and LATE (23.6% increase) conditions all had significantly greater TH+ neuron survival than media alone (fig. 6). The MDMA condition had significantly greater survival than the LATE condition (t=5.381, p=0.001) and the EARLY condition (t=2.732, p=0.009). In addition, EARLY had significantly greater survival than LATE (t=18.525, p=0.011). In summary, MDMA over 4 DIV produced the greatest increase in survival over CTRL (61% increase). EARLY was the next most successful (42.1% increase) followed by LATE (23.6% increase).
Figure 6.
TH+ neuron survival after 4 days in vitro (DIV) when cultures were exposed to culture media only (CTRL), MDMA during the first 2 DIV (EARLY), MDMA during the last 2 DIV (LATE)or MDMA for the full 4 DIV (FULL). All MDMA conditions were significantly greater than the CTRL conditions. The EARLY and MDMA conditions were significantly better than the LATE condition at improving TH+ neuron survival, although the LATE condition was better than CTRL. (Post-hoc comparisons: *= p<0.05; graphs represent a merging of 3 repeated experiments)
Experiment 4: MDMA increases in slc6a3 Gene Expression in vitro
The sentry wells indicated that TH+ neuron survival in control wells was 24% less than in the MDMA condition. Therefore the fold change difference in the MDMA group was reduced by 24%. After adjusting for the increased TH+ neuron survival, MDMA increased the expression of slc6a3 in culture by an average of 3.7 fold in culture. Fold changes for the slc6a3 normalized by the endogenous control gene L32, were subjected to t-test analysis via REST-XL software. This difference was statistically significant (t=19.21, p<0.001).
Experiment 5: Methylphenidate antagonizes the MDMA induced Survival Effect
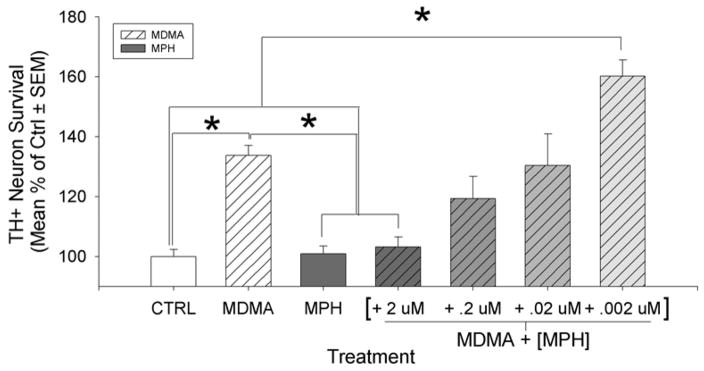
To further investigate the role of DAT in the MDMA-induced survival effect for cultured midbrain TH+ neurons, we attempted to outcompete MDMA at DAT using MPH. A two-way ANOVA was used to examine the survival of TH+ neurons in response to the presence or absence of MDMA (1st factor) in combination with the presence or absence of a saturating dose of MPH (2nd factor). A significant interaction between these factors was present (F(1,24)= 9.419, p=0.005; no main-effect significance). Post-hoc tests indicate that MDMA + MPH completely attenuated the MDMA-induced survival effect on TH+ neurons as compared to the MPH treatment (3% increase, t=1.514, n.s.). However, without MPH present, the previously observed increase in MDMA induced survival is still observable (38.7% increase, t=2.515, p<0.01). Finally, MPH had no effect by itself on TH+ neuron survival as compared to control (11.2% increase, t=0.513, n.s.). The interaction of the data indicates that MPH attenuates TH+ neuron survival when in the presence of MDMA, yet it has no effect in its absence.
MPH concentrations were decreased while MDMA levels were maintained in order to determine whether the MDMA-induced survival effect on TH+ neurons would return as MDMA levels could outcompete MPH at the DAT (see fig. 7). Overall, there was a significant effect of drug treatment between groups (F(6,53) = 2.739, p=0.022). Once again, MDMA increased TH+ neuron survival as compared to control conditions (39.8% increase, t=3.606 p<0.001). In addition, the presence of MPH by itself had no effect on neuron survival (2.6% increase, n.s.) MPH at the saturating dose (2 μM) in the presence of MDMA, once again attenuated the previously documented survival effect (8.7% increase, n.s.). As MPH levels were reduced in the MDMA media, the MDMA induced survival effect was partially reversed at an MPH level of 0.02 μM and below. These findings suggest that MPH and MDMA are competing at DAT, and that blockade of the site with MPH attenuates the survival effect. However, as MPH levels are reduced, MDMA can, via its action at DAT, result in increased TH+ neuron survival.
Figure 7.
A saturating level of MPH (2uM) alone in culture did not alter TH+ neuron survival but it completely attenuated the MDMA induced survival effect. As MPH levels were reduced in increments of 1:10, the MDMA survival effect returned when MPH was reduced to 0.002 μM. This implies that MPH was able to outcompete MDMA at the DAT at higher concentrations and block the survival effect of MDMA at the DAT. (Post-hoc comparisons: *= p<0.05; graphs represent a merging of 3 repeated experiments)
Experiment 6: MDMA increased TH+ Neuron Survival but did not alter TH+ Neurite Density per Neuron
Cultures grown on coverslips and mounted on glass slides were subjected to stereologic assessment of neuron survival and neurite density in response the presence or absence of MDMA and/or MPH. The number of TH+ neurons, the neurite density, and the ratio of neurites/neuron were then calculated and each subjected to a two-way ANOVA.
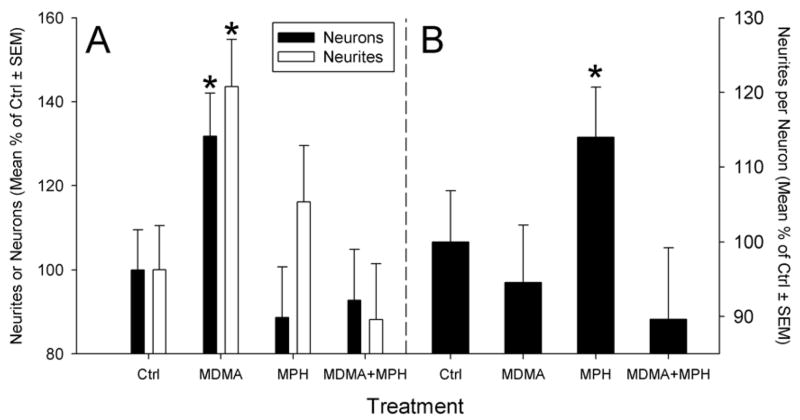
As seen in the prior MPH study, a significant interaction between MPH and MDMA (F(1,24)= 6.472, p=0.02) was present (fig. 8). The previously observed increase in MDMA induced survival was still observable (36.68% increase, t=2.12, p<0.01). Post-hoc tests indicate that in the presence of MPH, the MDMA-induced survival effect was completely attenuated as compared to MDMA alone (45% decrease as compared to MDMA alone, t=2.431, p=0.026). This attenuation by MPH + MDMA was also not significantly different from control (11% decrease, n.s.) suggesting again that MPH antagonizes the effects of MDMA. Finally, MPH had no effect by itself on TH+ neuron survival as compared to control (16.2% decrease, t=0.951, n.s.).
Figure 8.
Examination of neuron survival and neurite density in control cultures or cultures exposed to MDMA, MPH or MDMA+MPH. At first glance it appears the MDMA increases both TH+ neuron survival and neurite outgrowth in culture (A). However when the data for each well was calculated as a ratio of neurites per neuron, this finding was not evident (B). This suggests that in vitro exposure to MDMA increases TH+ neuron survival but does not increase the density of neurites expressed by each neuron. Interestingly, MPH appears to increase TH+ neurite density independent of neuron number. (*= p<0.05 vs. control; graphs represent a merging of 3 repeated experiments)
MDMA increased the calculated TH+ neurite density by 43.62% (t=2.825, p=0.01). In addition, MPH +MDMA attenuated the MDMA induced increase in neurite density to control levels (12% less than control, n.s.).
Finally, examination of the ratio of TH+ neurites per TH+ neuron within the cultures demonstrated that MDMA had no effect on neurite density per neuron (5.6% decrease, n.s.). Unexpectedly, MPH treatment alone increased the number of neurites per neuron by 28% (t=2.58, p=0.017). This suggests that MDMA in the current model system does not increase the numbers of neurites per neuron. In fact, it demonstrates that the increased TH+ neurite density in the cultures is simply a reflection of more TH+ neurons being present as a result of the MDMA treatment.
Experiment 7: Prenatal MDMA Increased SN but not VTA DA neuron Numbers at P35
The bilateral substantia nigra DA neuron populations of P35 control rats were estimated using the optical fractionator technique at 35663 ± 2101. The calculated population of DA neurons in the nigra of rats prenatally exposed to MDMA was 43847 ± 1894, 22% greater than controls (fig. 9, 10). This difference was statistically significant (F1,12=17.159, p=0.002). No differences were evident as a result of MDMA administration on VTA DA neuron population estimates (control: 20281 ± 1837 vs. MDMA: 21055 ± 1582).
Figure 9.
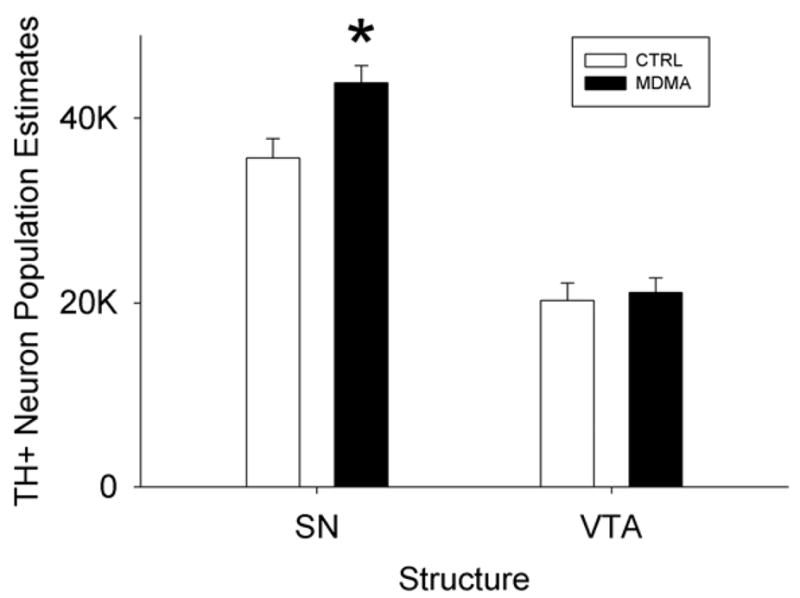
Stereologic estimates of TH+ neuron populations of the SN and the VTA in animals exposed to MDMA prenatally from E14-20 and examined at postnatal day 35. The population of TH+ neurons in the SN but not the VTA were significantly increased as a result of prenatal MDMA exposure. (*= p<0.05 vs. control; graphs represent a merging of 3 repeated experiments)
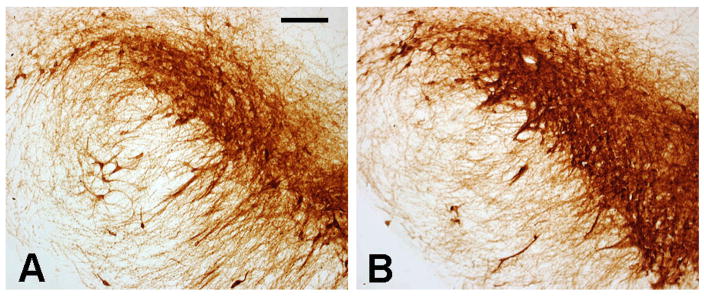
Figure 10.
Representative images of the TH+ neurons of the SN of P35 rats exposed to (A) vehicle (B) or MDMA from E14-20. Scale bar in A = 100 μm.
Discussion
These results are the first to demonstrate that concentrations of the substituted amphetamine MDMA achieved in vivo can increase the survival of ventral mesencephalic DA neurons in culture in a dose-dependent, and DA-specific manner. The results also demonstrate that MDMA is effective not only against the early wave of cell death in vitro, but also at later intervals, since delayed application of MDMA still significantly increased DA neuron survival. MDMA exposure significantly increased the expression of the slc6a3 gene which encodes for DAT as measured by qPCR. MPH antagonism of DAT in the presence of MDMA attenuated the increased survival of DA neurons suggesting that MDMA’s binding at DAT is a critical first step in this survival effect.
Historically, potential survival promoting factors have often been screened in suboptimal sparse culture conditions that may favor detection of a positive effect at the cost of exaggerating the biological significance of the effect. In the present experiments we specifically selected the microisland cell culture condition, in which cells are maintained at higher density, to more closely approximate cell density in vivo. Under these same cell culture conditions we have previously demonstrated that glial cell line-derived neurotrophic factor (GDNF) exposure for 96 hours yields a 40% increase in DA neuron survival (Collier et al., 2003). Similarly, our optimal concentration of MDMA (37.5 μM) produced an approximate 40% increase in DA neuron survival over the same interval suggesting that MDMA is of equivalent efficacy to 50 ng/ml GDNF in this model system.
It is important to emphasize the utility of employing in vivo MDMA concentrations for these in vitro studies. The parity between in vivo and in vitro MDMA concentrations can never be perfect. In vivo MDMA exposure results in compartmentalization and metabolism of the drug that would be difficult to model in vitro. In addition, whether or not these concentrations are reminiscent of MDMA levels in the fetal brains of humans is unknown. However, this is the first study to establish fetal brain concentrations of MDMA via maternal administration as an externally valid reference point for in vitro investigations of MDMA. The fact that MDMA concentrations outside the observed in vivo range either had no effect on DA neuron survival (low doses) or were non-specifically toxic (high doses) suggests that this type of molar approximation has value when creating an in vitro model. MDMA conditions within the demonstrated in vivo range increased the survival of DA neurons without increasing the survival of all cells in culture. High concentrations of MDMA (above 100μM) have been shown to be neurotoxic by others and have been used as evidence for its neurotoxic potential during abuse (Capela et al., 2006). We contend in vivo estimates of MDMA brain concentrations should be paired with in vitro culture studies to enable better interpretation and extrapolation of such findings.
Another important consideration for evaluating MDMA’s potential to increase neuronal survival is the variety of insults from which it may provide protection. During the first 48 hr in culture, mesencephalic cells may experience numerous insults including, detachment induced cell death (anoikis), excitotoxicity, oxidative stress and trophic factor withdrawal. In contrast, established mesencephalic cell cultures are likely to experience cell death mainly due to lack of appropriate environmental signals (Sortwell, 2003). Our results demonstrate that both early and late exposure to MDMA enhances DA neuron survival suggesting that MDMA is potentially protective against a wide range of toxic insults. Survival of DA neurons in the LATE condition was not as robust as in the EARLY or FULL conditions which were similar to each other. However, this may be explained by the inferred significant neuron loss in the LATE condition already occurred during the first 48 hr prior to MDMA application. Thus, there were fewer neurons remaining for MDMA to rescue by the time it was added, hence the blunted survival effect.
We demonstrated that MDMA increased the expression of the slc6a3 gene via qPCR by 3.7 fold after adjusting for increased neuron survival in the cultures. Amphetamine has been shown in some studies to increase surface expression of DAT on DA neurons (Ukairo et al., 2007) while some suggest the opposite (Sulzer et al., 2005; Wei et al., 2007). However, these findings are postulated to be a result of translocation of DAT between the cytosol and the membrane rather than a result of changes in gene expression (Ukairo et al., 2007). While we need to confirm that these changes in slc6a3 expression translate into greater expression of DAT protein, understanding why MDMA’s occupancy of DAT results in increased gene expression for DAT, and how this enhances DA neuron survival is a key goal of future studies. Future studies to fully elucidate the MDMA-induced alterations in genes associated with DAT trafficking may allow us to connect MDMA’s occupation of DAT with its ability to increase the survival of dopamine neurons.
Since substituted amphetamines like MDMA primarily act via activation of monoamine transporters, and since MDMA upregulates the expression of slc6a3, it is not a large conceptual leap to hypothesize that the MDMA induced survival effect is mediated by MDMA’s action at the DAT. In order to determine whether another compound with greater affinity for DAT could block the MDMA-induced survival effect, MPH, a competitive DAT inhibitor, was added to the cultures. Unlike MDMA, MPH did not enhance the survival of DA neurons. While both drugs increase extracellular DA levels, MPH inhibits the action of the DAT while amphetamine-like drugs, like MDMA, activate the DAT in the adult brain (Foster et al., 2006). This suggests that neither occupying the transporter nor increasing extracellular DA is sufficient to produce the observed survival effect. In addition, when MPH levels were reduced in competition studies where MDMA concentrations were maintained, the survival effect returned. This suggests that DAT is being expressed in the cultured cells, and that inhibition of MDMA binding by MPH inhibited the survival effect. These studies provide strong preliminary evidence that MDMA’s ability to increase DA neuron survival is initiated with its activation of DAT, but that occupation of DAT per se is not sufficient to trigger the survival-enhancing effect. Future studies utilizing more specific DAT antagonists, as well as siRNA to silence DAT may more conclusively answer this question.
Interestingly, while MPH had no effect on neuron survival by itself, it did appear to produce a modest, but significant enhancement of neurite outgrowth while yielding a similar level of DA neuron survival as observed in control conditions. One prior study demonstrated a lack of effect of MPH on neuron survival, as well as its ability to successfully block neurotoxins (Ludolph et al., 2006). However, this previous report did not observe increased neurite density as we have in the current study. The use of stereologic sampling methods to estimate neurite density in the microisland cultures may have increased our sensitivity to observe such differences in neurite density. How MPH enhances neurite outgrowth in DA neurons, and whether specific DAT antagonists, such as GBR-12909, can produce a similar response, warrants further investigation.
These in vitro studies appear to model some aspects of our prior in vivo work in which we demonstrated that maternal administration of MDMA increased DA neurite density in prefrontal cortex, striatum and nucleus accumbens in 21 day old rats (Koprich et al., 2003). In the prior in vivo study, we hypothesized that MDMA increased DA neuron survival and/or neurite branching in these target structures. Based upon our current in vitro findings, MDMA augments DA neuron survival but does not produce an increased number of neurites per neuron. This suggests that either the prior finding of increased neurite density is associated with increased DA neurons from source stuctures, or that our in vitro model does not exactly reproduce the environmental conditions needed to enhance neurite outgrowth. While our in vitro model establishes that MDMA has a pro-survival effect on DA neurons, these cultures lack both glia and neurons from their target structures. Future studies will examine the role of glia and striatal target cells in a more complex in vitro model system. The added cell population complexity in the presence of MDMA may provide sufficient homology to produce both increased neuron survival and increased neurite density to better approximate our in vivo findings.
In the current study, prenatal exposure to MDMA resulted in increased DA neuron populations in the SN but not the VTA in brains of rats assessed at P35. Whether this is a result of less apoptotic cell death or increased neurogenesis during development remains to be determined. MDMA has been shown to reduce the survival of newly generated neurons within the adult hippocampus, but not affect the rate of neurogenesis (Hernandez-Rabaza et al., 2006). While this demonstrates that MDMA can affect the homeostatic balance between neurogenesis in apoptosis in the adult hippocampus, it is unclear whether this occurs in the developing brain. This finding is particularly interesting not only because it provides a parallel in vivo result that demonstrates greater DA neuron survival as a result of developmental MDMA exposure, but also because it appears to be selective for nigral DA neurons. This provides important data that can be followed up in vitro to determine if different DA neuron populations show differential responses to the pro-survival effect of MDMA.
While there are many studies that have shown that DAT can be regulated by upstream signals (Ingram and Amara, 2000), and that the presence of DAT can change neuronal excitability (Ingram et al., 2002), the downstream result of phosphorylation and endocytosis of DAT has not been well characterized.
It has been postulated that accumulation of cytosolic DA may be responsible for nigral degeneration (Berman et al., 1996; Caudle et al., 2007; Hastings et al., 1996a; Hastings et al., 1996b; Jenner, 2003; Kunikowska and Jenner, 2002; Montine et al., 1997; Rabinovic et al., 2000). Amphetamines such as MDMA, act on DAT to reverse the transport of DA out of the cytosolic compartment and into the extracellular space (for a review see (Fleckenstein et al., 2007)). In the current study, we have demonstrated that MDMA increases expression of slc6a3 which may increase DAT expression. MDMA’s protective action may be a result of these two phenomena which would keep cytosolic DA pools reduced. While this is speculative, future studies examining the generation of reactive oxygen species in culture may help determine the validity of this hypothesis.
This is the first report that MDMA can specifically increase the survival and/or growth of immature DA neurons both in vivo and in vitro. Elucidating the pathway that begins with MDMA induced DAT stimulation, and ends with a DA neuron that can survive in challenging environments such as those employed here in vitro may allow us to better understand how MDMA may reduce normal DA neuron loss that occurs during development.
Acknowledgments
The authors would like to thank Prof. Dan Peterson for his expertise and guidance in quantifying neurons and neurites in culture using Stereoinvestigator. We would also like to thank Prof. Kathy Steece-Collier for permitting the use of her embryonic tissue dissection images. This research was supported by the NIH: 1R21 DA019261 (JWL), 1R01DA017399 (JWL), and the George and Elizabeth Wile Fund. MDMA and methylphenidate were provided by the NIDA Research Drug Supply System.
Footnotes
Publisher's Disclaimer: This is a PDF file of an unedited manuscript that has been accepted for publication. As a service to our customers we are providing this early version of the manuscript. The manuscript will undergo copyediting, typesetting, and review of the resulting proof before it is published in its final citable form. Please note that during the production process errors may be discovered which could affect the content, and all legal disclaimers that apply to the journal pertain.
References
- Battaglia G, Brooks BP, Kulsakdinun C, De Souza EB. Pharmacologic profile of MDMA (3,4-methylenedioxymethamphetamine) at various brain recognition sites. Eur J Pharmacol. 1988;149:159–163. doi: 10.1016/0014-2999(88)90056-8. [DOI] [PubMed] [Google Scholar]
- Baumann MH, Wang X, Rothman RB. 3,4-Methylenedioxymethamphetamine (MDMA) neurotoxicity in rats: a reappraisal of past and present findings. Psychopharmacology (Berl) 2007;189:407–424. doi: 10.1007/s00213-006-0322-6. [DOI] [PMC free article] [PubMed] [Google Scholar]
- Berman SB, Zigmond MJ, Hastings TG. Modification of dopamine transporter function: effect of reactive oxygen species and dopamine. J Neurochem. 1996;67:593–600. doi: 10.1046/j.1471-4159.1996.67020593.x. [DOI] [PubMed] [Google Scholar]
- Berridge MV, Herst PM, Tan AS. Tetrazolium dyes as tools in cell biology: new insights into their cellular reduction. Biotechnol Annu Rev. 2005;11:127–152. doi: 10.1016/S1387-2656(05)11004-7. [DOI] [PubMed] [Google Scholar]
- Campbell NG, Koprich JB, Kanaan NM, Lipton JW. MDMA administration to pregnant Sprague-Dawley rats results in its passage to the fetal compartment. Neurotoxicol Teratol. 2006;28:459–465. doi: 10.1016/j.ntt.2006.05.006. [DOI] [PubMed] [Google Scholar]
- Capela JP, Meisel A, Abreu AR, Branco PS, Ferreira LM, Lobo AM, Remiao F, Bastos ML, Carvalho F. Neurotoxicity of Ecstasy metabolites in rat cortical neurons, and influence of hyperthermia. J Pharmacol Exp Ther. 2006;316:53–61. doi: 10.1124/jpet.105.092577. [DOI] [PubMed] [Google Scholar]
- Caudle WM, Richardson JR, Wang MZ, Taylor TN, Guillot TS, McCormack AL, Colebrooke RE, Di Monte DA, Emson PC, Miller GW. Reduced vesicular storage of dopamine causes progressive nigrostriatal neurodegeneration. J Neurosci. 2007;27:8138–8148. doi: 10.1523/JNEUROSCI.0319-07.2007. [DOI] [PMC free article] [PubMed] [Google Scholar]
- Clauwaert KM, Van Bocxlaer JF, De Leenheer AP. Stability study of the designer drugs “MDA, MDMA and MDEA” in water, serum, whole blood, and urine under various storage temperatures. Forensic Sci Int. 2001;124:36–42. doi: 10.1016/s0379-0738(01)00562-x. [DOI] [PubMed] [Google Scholar]
- Colado MI, Green AR. The spin trap reagent alpha-phenyl-N-tert-butyl nitrone prevents ‘ecstasy’-induced neurodegeneration of 5-hydroxytryptamine neurones. Eur J Pharmacol. 1995;280:343–346. doi: 10.1016/0014-2999(95)00298-y. [DOI] [PubMed] [Google Scholar]
- Collier TJ, Steece-Collier K, McGuire S, Sortwell CE. Cellular models to study dopaminergic injury responses. Ann N Y Acad Sci. 2003;991:140–151. doi: 10.1111/j.1749-6632.2003.tb07472.x. [DOI] [PubMed] [Google Scholar]
- DiResta GR, Lee J, Lau N, Ali F, Galicich JH, Arbit E. Measurement of brain tissue density using pycnometry. Acta Neurochir Suppl (Wien) 1990;51:34–36. doi: 10.1007/978-3-7091-9115-6_12. [DOI] [PubMed] [Google Scholar]
- DiResta GR, Lee JB, Arbit E. Measurement of brain tissue specific gravity using pycnometry. J Neurosci Methods. 1991;39:245–251. doi: 10.1016/0165-0270(91)90103-7. [DOI] [PubMed] [Google Scholar]
- Fleckenstein AE, Volz TJ, Riddle EL, Gibb JW, Hanson GR. New insights into the mechanism of action of amphetamines. Annu Rev Pharmacol Toxicol. 2007;47:681–698. doi: 10.1146/annurev.pharmtox.47.120505.105140. [DOI] [PubMed] [Google Scholar]
- Foster JD, Cervinski MA, Gorentla BK, Vaughan RA. Regulation of the dopamine transporter by phosphorylation. Handb Exp Pharmacol. 2006:197–214. doi: 10.1007/3-540-29784-7_10. [DOI] [PubMed] [Google Scholar]
- Galineau L, Belzung C, Kodas E, Bodard S, Guilloteau D, Chalon S. Prenatal 3,4-methylenedioxymethamphetamine (ecstasy) exposure induces long-term alterations in the dopaminergic and serotonergic functions in the rat. Brain Res Dev Brain Res. 2005;154:165–176. doi: 10.1016/j.devbrainres.2004.10.012. [DOI] [PubMed] [Google Scholar]
- Green AR, Mechan AO, Elliott JM, O’Shea E, Colado MI. The pharmacology and clinical pharmacology of 3,4-methylenedioxymethamphetamine (MDMA, “ecstasy”) Pharmacol Rev. 2003;55:463–508. doi: 10.1124/pr.55.3.3. [DOI] [PubMed] [Google Scholar]
- Hastings TG, Lewis DA, Zigmond MJ. Reactive dopamine metabolites and neurotoxicity: implications for Parkinson’s disease. Adv Exp Med Biol. 1996a;387:97–106. doi: 10.1007/978-1-4757-9480-9_13. [DOI] [PubMed] [Google Scholar]
- Hastings TG, Lewis DA, Zigmond MJ. Role of oxidation in the neurotoxic effects of intrastriatal dopamine injections. Proc Natl Acad Sci USA. 1996b;93:1956–1961. doi: 10.1073/pnas.93.5.1956. [DOI] [PMC free article] [PubMed] [Google Scholar]
- Helton TE, Daunais JB, McGinty JF. Convulsant doses of cocaine alter immediate early gene and opioid peptide expression in rat limbic forebrain. Brain Res Mol Brain Res. 1993;20:285–288. doi: 10.1016/0169-328x(93)90054-s. [DOI] [PubMed] [Google Scholar]
- Hernandez-Rabaza V, Dominguez-Escriba L, Barcia JA, Rosel JF, Romero FJ, Garcia-Verdugo JM, Canales JJ. Binge administration of 3,4-methylenedioxymethamphetamine (“ecstasy”) impairs the survival of neural precursors in adult rat dentate gyrus. Neuropharmacology. 2006;51:967–973. doi: 10.1016/j.neuropharm.2006.06.019. [DOI] [PubMed] [Google Scholar]
- Ingram SL, Amara SG. Arachidonic acid stimulates a novel cocaine-sensitive cation conductance associated with the human dopamine transporter. J Neurosci. 2000;20:550–557. doi: 10.1523/JNEUROSCI.20-02-00550.2000. [DOI] [PMC free article] [PubMed] [Google Scholar]
- Ingram SL, Prasad BM, Amara SG. Dopamine transporter-mediated conductances increase excitability of midbrain dopamine neurons. Nat Neurosci. 2002;5:971–978. doi: 10.1038/nn920. [DOI] [PubMed] [Google Scholar]
- Jenner P. Oxidative stress in Parkinson’s disease. Ann Neurol. 2003;53(Suppl 3):S26–S36. doi: 10.1002/ana.10483. [DOI] [PubMed] [Google Scholar]
- Koprich JB, Chen EY, Kanaan NM, Campbell NG, Kordower JH, Lipton JW. Prenatal 3,4-methylenedioxymethamphetamine (ecstasy) alters exploratory behavior, reduces monoamine metabolism, and increases forebrain tyrosine hydroxylase fiber density of juvenile rats. Neurotoxicol Teratol. 2003;25:509–517. doi: 10.1016/s0892-0362(03)00091-6. [DOI] [PubMed] [Google Scholar]
- Kunikowska G, Jenner P. The distribution of copper, zinc- and manganese-superoxide dismutase, and glutathione peroxidase messenger ribonucleic acid in rat basal ganglia. Biochem Pharmacol. 2002;63:1159–1164. doi: 10.1016/s0006-2952(01)00897-8. [DOI] [PubMed] [Google Scholar]
- Ludolph AG, Schaz U, Storch A, Liebau S, Fegert JM, Boeckers TM. Methylphenidate exerts no neurotoxic, but neuroprotective effects in vitro. J Neural Transm. 2006;113:1927–1934. doi: 10.1007/s00702-006-0487-5. [DOI] [PubMed] [Google Scholar]
- Marchionini DM, Collier TJ, Camargo M, McGuire S, Pitzer M, Sortwell CE. Interference with anoikis-induced cell death of dopamine neurons: implications for augmenting embryonic graft survival in a rat model of Parkinson’s disease. J Comp Neurol. 2003;464:172–179. doi: 10.1002/cne.10785. [DOI] [PubMed] [Google Scholar]
- McCann UD, Ricaurte GA. Lasting neuropsychiatric sequelae of (+-)methylenedioxymethamphetamine (‘ecstasy’) in recreational users. J Clin Psychopharmacol. 1991;11:302–305. [PubMed] [Google Scholar]
- Montine TJ, Picklo MJ, Amarnath V, Whetsell WO, Jr, Graham DG. Neurotoxicity of endogenous cysteinylcatechols. Exp Neurol. 1997;148:26–33. doi: 10.1006/exnr.1997.6662. [DOI] [PubMed] [Google Scholar]
- Peterson DA, Jones DG. Determination of neuronal number and process surface area in organotypic cultures: a stereological approach. J Neurosci Methods. 1993;46:107–120. doi: 10.1016/0165-0270(93)90146-i. [DOI] [PubMed] [Google Scholar]
- Rabinovic AD, Lewis DA, Hastings TG. Role of oxidative changes in the degeneration of dopamine terminals after injection of neurotoxic levels of dopamine. Neuroscience. 2000;101:67–76. doi: 10.1016/s0306-4522(00)00293-1. [DOI] [PubMed] [Google Scholar]
- Ramamoorthy Y, Yu AM, Suh N, Haining RL, Tyndale RF, Sellers EM. Reduced (+/−)-3,4-methylenedioxymethamphetamine (“Ecstasy”) metabolism with cytochrome P450 2D6 inhibitors and pharmacogenetic variants in vitro. Biochem Pharmacol. 2002;63:2111–2119. doi: 10.1016/s0006-2952(02)01028-6. [DOI] [PubMed] [Google Scholar]
- Ricaurte GA, DeLanney LE, Irwin I, Langston JW. Toxic effects of MDMA on central serotonergic neurons in the primate: importance of route and frequency of drug administration. Brain Res. 1988a;446:165–168. doi: 10.1016/0006-8993(88)91309-1. [DOI] [PubMed] [Google Scholar]
- Ricaurte GA, Forno LS, Wilson MA, DeLanney LE, Irwin I, Molliver ME, Langston JW. (+/−)3,4-Methylenedioxymethamphetamine selectively damages central serotonergic neurons in nonhuman primates. JAMA. 1988b;260:51–55. [PubMed] [Google Scholar]
- Ricaurte GA, Yuan J, McCann UD. (+/−)3,4-Methylenedioxymethamphetamine (‘Ecstasy’)-induced serotonin neurotoxicity: studies in animals. Neuropsychobiology. 2000;42:5–10. doi: 10.1159/000026664. [DOI] [PubMed] [Google Scholar]
- Schweri MM, Skolnick P, Rafferty MF, Rice KC, Janowsky AJ, Paul SM. [3H]Threo-(+/−)-methylphenidate binding to 3,4-dihydroxyphenylethylamine uptake sites in corpus striatum: correlation with the stimulant properties of ritalinic acid esters. J Neurochem. 1985;45:1062–1070. doi: 10.1111/j.1471-4159.1985.tb05524.x. [DOI] [PubMed] [Google Scholar]
- Sortwell CE. Strategies for the augmentation of grafted dopamine neuron survival. Front Biosci. 2003;8:s522–s532. doi: 10.2741/1096. [DOI] [PubMed] [Google Scholar]
- Sortwell CE, Pitzer MR, Collier TJ. Time course of apoptotic cell death within mesencephalic cell suspension grafts: implications for improving grafted dopamine neuron survival. Exp Neurol. 2000;165:268–277. doi: 10.1006/exnr.2000.7476. [DOI] [PubMed] [Google Scholar]
- Srivastava S, Crippen GM. Analysis of cocaine receptor site ligand binding by three- dimensional Voronoi site modeling approach. J Med Chem. 1993;36:3572–3579. doi: 10.1021/jm00075a012. [DOI] [PubMed] [Google Scholar]
- St Omer VE, Ali SF, Holson RR, Duhart HM, Scalzo FM, Slikker WJ. Behavioral and neurochemical effects of prenatal methylenedioxymethamphetamine (MDMA) exposure in rats. Neurotoxicol Teratol. 1991;13:13–20. doi: 10.1016/0892-0362(91)90022-o. [DOI] [PubMed] [Google Scholar]
- Sulzer D, Sonders MS, Poulsen NW, Galli A. Mechanisms of neurotransmitter release by amphetamines: a review. Prog Neurobiol. 2005;75:406–433. doi: 10.1016/j.pneurobio.2005.04.003. [DOI] [PubMed] [Google Scholar]
- Takeshima T, Shimoda K, Johnston JM, Commissiong JW. Standardized methods to bioassay neurotrophic factors for dopaminergic neurons. J Neurosci Methods. 1996;67:27–41. [PubMed] [Google Scholar]
- Ukairo OT, Ramanujapuram S, Surratt CK. Fluctuation of the dopamine uptake inhibition potency of cocaine, but not amphetamine, at mammalian cells expressing the dopamine transporter. Brain Res. 2007;1131:68–76. doi: 10.1016/j.brainres.2006.11.018. [DOI] [PMC free article] [PubMed] [Google Scholar]
- Wei Y, Williams JM, Dipace C, Sung U, Javitch JA, Galli A, Saunders C. Dopamine transporter activity mediates amphetamine-induced inhibition of Akt through a Ca2+/calmodulin-dependent kinase II-dependent mechanism. Mol Pharmacol. 2007;71:835–842. doi: 10.1124/mol.106.026351. [DOI] [PubMed] [Google Scholar]
- West MJ. New stereological methods for counting neurons. Neurobiol Aging. 1993;14:275–285. doi: 10.1016/0197-4580(93)90112-o. [DOI] [PubMed] [Google Scholar]


