Abstract
Contemporary brain theories of cognitive function posit spatial, temporal and spatiotemporal reorganization as mechanisms for neural information processing. Corresponding brain imaging results underwrite this perspective of large scale reorganization. As we show here, a suitable choice of experimental control tasks allows the disambiguation of the spatial and temporal components of reorganization to a quantifiable degree of certainty. When using electro- or mag-netoencephalography (EEG or MEG), our approach relies on the identification of lower dimensional spaces obtained from the high dimensional data of suitably chosen control task conditions. Encephalographic data from task conditions are reconstructed within these control spaces. We show that the residual signal (part of the task signal not captured by the control spaces) allows the quantification of the degree of spatial reorganization, such as recruitment of additional brain networks.
Keywords: Functional Connectivity, Electroencephalography, Magnetoencephalography, Cognitive Subtraction, Mode Decomposition, Mode Level Cognitive Subtraction
1. Introduction
Current research suggests that brain areas constitute neurocognitive networks responsible for information processing and are omnipresent in the brain with similar operational principles (Sporns et al. (1989); McIntosh (2004); Bressler and Tognoli (2006))). The selection and subsequent activation of these networks are governed by context (McIntosh (2004)) and spatiotemporal coordination with other networks (Kelso (1995)); Bressler and Kelso (2001)). Temporal (re)organization in the neurocognitive networks may occur via amplitude modulation of activity in distant neuronal populations (Bressler et al. (1993); Rodriguez et al. (1999)). On the other hand, spatial (re)organization processes entail recruitment or disengagement of certain brain areas and are found to be involved in information processing mechanisms such as multisensory integration (Damasio (1989); Calvert et al. (2001); Dhamala et al. (2007))). Mesulam (1998) argued that synaptic inputs from low level unisensory cortical areas follow multiple pathways and finally get integrated in transmodal areas for cognitive processing. Experimental evidence suggests that the two aforementioned mechanisms of neural information processing are not necessarily mutually exclusive and may occur simultaneously (Bushara et al. (2003)) resulting in a spatiotemporal large scale network reorganization. Recent literature such as Bressler and Kelso (2001); Bushara et al. (2003); Jirsa and Kelso (2004); Kelso and Engstrom (2006) emphasizes the existence of spatiotemporal (re)organization processes in the context of integration and segregation of perceptual and motor behavior.
To characterize temporal modulation between coupled brain areas Rodriguez et al. (1999) and Ding et al. (2000) used phase and frequency based measures, respectively. On the other hand a common approach to identify spatial reorganization is the comparison of two sets of data, one of which serves as control condition to the other (Sanders (1980); Friston et al. (1996)). Cognitive subtraction methods that advocate linear subtraction of control and task condition assume that there are no temporal interactions between cognitive components and any additional activity will inevitably involve a change in amplitude thereby asserting pure insertion (Friston et al. (1996)). Nonetheless, because of its simplicity and intuitive principles cognitive subtraction methods have been used to characterize the interactions within brain areas (Meredith and Stein (1983)) and between brain areas responding to unisensory and multisensory inputs (Molholm et al. (2002)). The residual data following a cognitive subtraction operation can be analyzed via two concepts: 1) inverse techniques that estimate the exact location and dynamics of the cortical sources by fitting dipolar generators with varying orientations at anatomically motivated locations and comparing subsequently generated forward solution with the event related signal (Geselowitz (1967); Grynszpan and Geselowitz (1973); Hämäläinen and Sarvas (1989); Mosher et al. (1999); Jirsa et al. (2002)) 2) mode decomposition techniques that do not perform source localization (though often aid in this process). The latter assume scalp potentials or fields to be a mixture of low dimensional scalp components in a high-dimensional space spanned by the sensors. Techniques such as Principal component analysis (PCA) or Independent component analysis (ICA) (Bell and Sejnowski (1995)) and Second order blind identification (SOBI) (Tang et al. (2005)) have been used to obtain these components. Nevertheless, the biological significance of the individual components has always been an issue of controversy because of the constraints (orthogonality and statistical independence) implied by the algorithms.
In this article, we develop a general approach to disambiguate between the spatial and temporal contributions of spatiotemporal network activity in an additive factor based experimental paradigm. A lower dimensional space (defined as the control space) is constructed by the major scalp topographies present in multiple control conditions. The key idea is to analyze the projections of the task condition data in the control space. We test systematically to what degree the control space captures the scalp activations present in the task condition. As our analysis is inspired by the decomposition of a higher dimensional EEG signal to a lower dimensional subspace of spatial modes we refer to it as “Mode Level Cognitive Subtraction (MLCS)”. The algorithm is straightforward (with the underlying ideas based on the theory of linear vector spaces), computationally parsimonious and easy to implement.
Our paper is structured as follows: In section 2 we develop the mathematical framework of MLCS. In section 3 we apply MLCS to computationally generated data for various dynamical scenarios including temporal, spatial and spatiotemporal reorganization. Our conclusions are presented in section 4.
2. Mode-Level Cognitive Subtraction
2.1. Theory
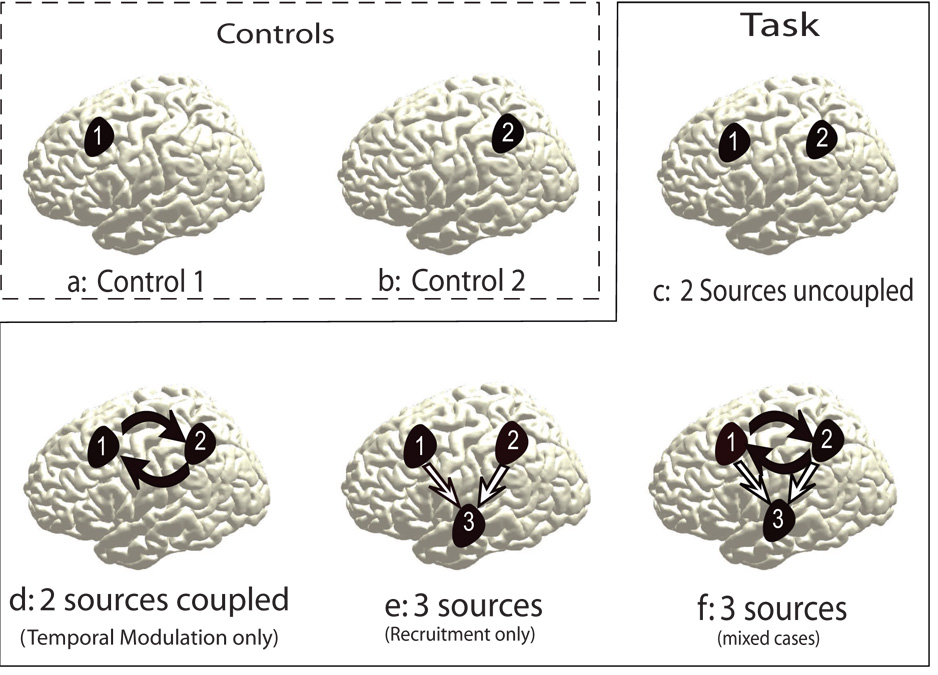
We consider an area or network of areas in the brain to be activated under suitably chosen experimental control conditions (Fig 1 a and 1b). Areas labeled as 1 and 2 in Fig 1 are involved in the information processing underlying control condition 1 and 2 respectively. Now, a task condition may require the activation of both areas. We posit that the brain dynamics underlying this task condition might occur via the following mechanisms which are shown in Fig 1 c, d, e and f..
Fig. 1.
Networks involved under different scenarios of neural information processing are illustrated via a cartoon. a) and b) show the sources activated during the control conditions 1 and 2 (refer to text) respectively. Both sources are activated during the task conditions in following ways: c) without coupling, d) via non-linear temporal modulation, e) through a spatially linear recruitment of additional area 3, f ) via the mixed contributions from (d) and (e). The location of the sources in the brain are chosen arbitrarily for illustrative purposes only.
No reorganization: Uncoupled dynamics of areas 1 and 2 is a superposition of the electromagnetic activity from the two sources that generate scalp potential (Fig 1 c).
Temporal reorganization: Temporal modulation of areas 1 and 2 exhibit a coupled dynamical behavior (Fig 1 d).
Spatial reorganization: Recruitment only where the area 1 and 2 recruit a third area resulting in an altered scalp topography (Fig 1 e).
Spatiotemporal reorganization: Mixed conditions where both contributions (temporal modulation and recruitment ) are parametrically varied (Fig 1 f).
The scalp potentials measured by k electrodes during a control condition compose the k-dimensional vector Ψc(t) as a function of time t and may be expressed as a sum of spatiotemporal patterns
| (1) |
where, is the temporal coefficient of the n-th spatial pattern (or mode) ϕn of the control condition. A spatial mode is the scalp topography suitable to capture the time course of the EEG. The set of spatial modes {ϕn} spans a space Φ, in which the spatiotemporal scalp dynamics of the particular control condition evolves. If the dimension m of the space spanned by {ϕn} is smaller than the number of sensors k, then dimensional reduction can be obtained using established mode decomposition techniques. Prime candidates for mode decomposition are principal component analysis (PCA), independent component analysis (ICA) or Second Order Blind Identification (SOBI) (Bell and Sejnowski (1995); Tang et al. (2005)). Ideally, the high dimensional data should be reduced to a few spatial modes in the control conditions, m < k, and hence result in a low-dimensional representation of the dynamics. The low dimensional approximation is usually done under the usage of a threshold eigenvalue which separates the noise from signal. This threshold can also be set parametrically by using techniques of Mitra and Pesaran (1999). Since PCA components are highly affected by background noise, a high signal to noise ratio is desired. For our simulated data, in the absence of background noise, both PCA and ICA give similar dimensional reduction. If multiple control conditions c1, c2, … are used, then the control space Φ is spanned by the unity of the individual subspaces from the control conditions, that is Φ = Φc1×Φc2×. … Generally the modes spanning the individual subspaces will be linearly independent, but non-orthogonal, and together they span the complete control space Φ. Alternatively, new orthogonal modes can be constructed, for instance, using Schmidt-Graham-orthogonalization (Hoffman and Kunze (1961)).
We now wish to express the scalp potentials of the task condition, Ψ(t), within the control space Φ. To do so, we perform a decomposition as follows,
| (2) |
where the residual term R is that part of the data not explained by the control space Φ; and ηn(t) are the projections of Ψ(t) onto the individual modes, i.e. they are obtained from the dot product of the task signal and the adjoint modes
| (3) |
where the adjoint modes satisfy the biorthogonality condition
| (4) |
and =δij is the Kronecker symbol. The residual data, R, that cannot be explained by temporal modulation of the sources of present in the control conditions will reflect the recruitment of additional networks absent in control conditions, since holds. For the case of complete temporal modulation |R| = 0. The goodness of fit of the reconstruction is obtained from
| (5) |
where < . > denotes the temporal average. Any significant deviation from a 100% value of goodness of fit can be attributed to a spatiotemporal reorganization.
2.2. Spatial sensitivity analysis
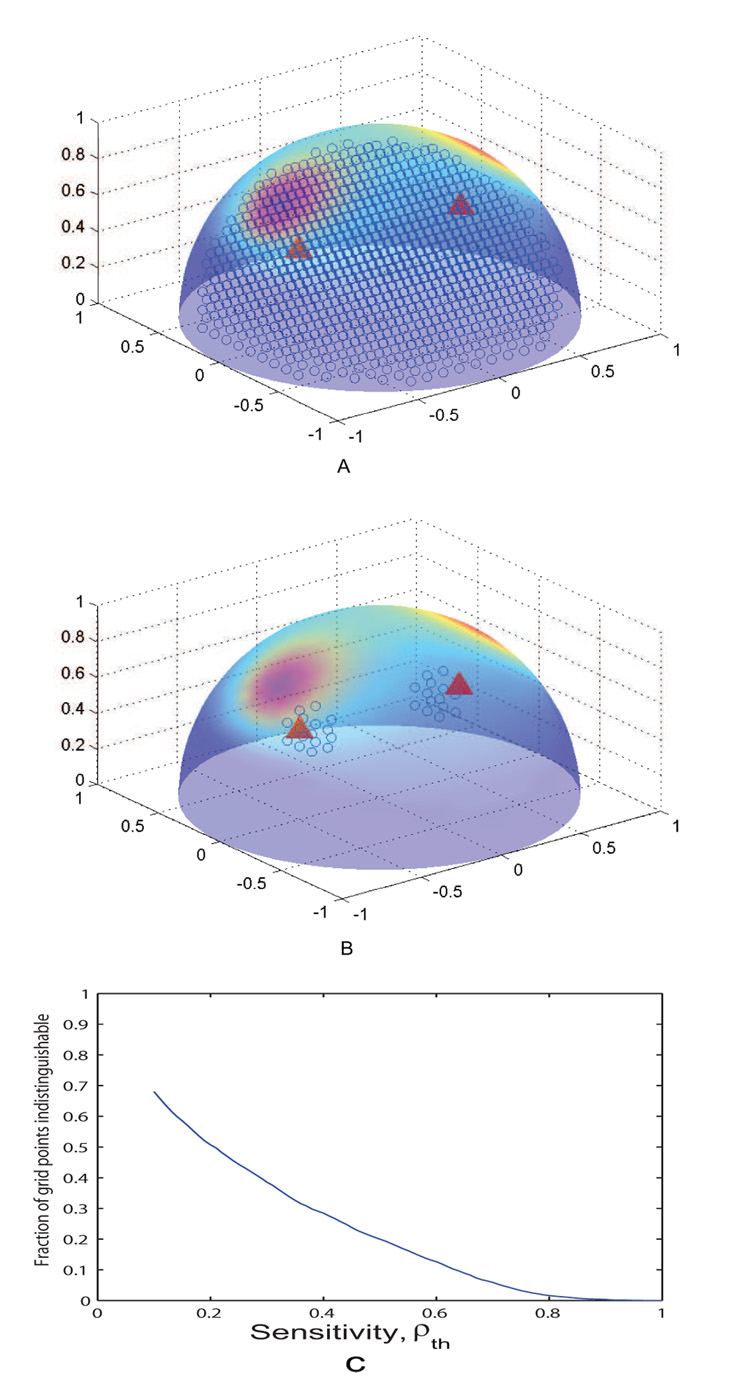
To obtain a quantification of the spatial sensitivity of MLCS, we perform the following analysis: We simulate two control conditions by placing sources at two different locations in the half-sphere (our approximated cortical volume) and then compute forward solutions on its surface (conductivity σ = 1). As a next step, we create a grid of 2890 points inside the cortical volume (see Fig 3a). At each grid point (X(r, Θ) in spherical polar coordinates) we place a dipolar source and compute the forward solution, Ψ(X(r, Θ)) for 25 different orientations (5 azimuthal angles between 0 to 2π in steps of and 5 vertical angles between 0 to 2 in steps of ). To obtain a measure ρ for the degree of containment of Ψ within the control space Φ we determine the reconstructed signal
| (6) |
for each location and orientation (ηn are scalar, in absence of temporal dependence) and compute
| (7) |
MLCS is insensitive to detection of any recruitment at ρ = 1 when Ψ lives completely in the space Φ. Complementarily, MLCS is perfectly sensitive to any dipole location and orientation at ρ = 0 when no component of Ψ ever projects into θ. Now, a threshold ρth may be defined to choose the degree of overlap that may be allowed between the two spaces to make a statement about the existence of the third source. For example at ρth = 0.9 the third source projects completely into Φ when it was placed at the grid points shown in Fig 3b. In Fig 3c, we show how the fraction of insensitive locations (out of all possible locations and orientations) vary when ρth is set at different values between [0, 1]. The choice of conductivity σ = 1 simplifies our analysis as we can ignore the several layers of complexity that is associated with a realistic head model. However, we show in Fig 3c that at ρth = 0.5, the fraction of insensitive location and orientation is approximately 0.2. Or in other words at 50% sensitivity threshold we can still discriminate 80% of the third source locations and orientations while 20% are blind to our analysis. The volume defined by the blind locations is related to the well-known half-sensitivity volume of a forward model in electroencephalography (see Ferree and Nunez (2007) for details). Note that disengagement of networks from the control space during the task condition cannot be detected by MLCS and would be erroneously interpreted as temporal modulation.
Fig. 3.
Spatial sensitivity analysis of the forward solution: A) Blue circles show all locations in the cortical volume at which the forward solutions are calculated, red triangles show the source locations and their scalp projection mapped onto a half-sphere B) For ρth = 0.9, blue circles show the blind locations where an additional source cannot be resolved. C) Effect of the sensitivity ρ on the ability of MLCS to distinguish additional network locations. At the limit case of ρth = 1, almost all the locations are resolved
3. Application to synthetic EEG data
The key question we wish to address in this section is how well does MLCS characterize temporal modulation of the control modes, recruitment of additional networks and mixed cases where both mechanisms affect the coupled networks. The measure for such characterization is the goodness of fit of the reconstruction. For high goodness of fit, there is a strong likelihood that the effective connectivity is primarily mediated by temporal modulation whereas a low value indicates a likelihood of spatial reorganization. To perform a systematic testing of our interpretation we create synthetic data, briefly described in the next section with technical details provided in the appendix. In the subsequent sections we apply MLCS to the various connectivity scenarios and compare these directly with results obtained from cognitive subtraction.
3.1. Generation of synthetic EEG data
We assume that the scalp potentials are generated by neural masses inside the cortex, which are used extensively in the literature of encephalographic source modeling Lopes da Silva et al. (1974); Freeman (1974); Nunez (1974); Valdes et al. (1999); David and Friston (2003). Here we use in particular the neural mass models by De Monte et al. (2003); Assisi et al. (2005), which are derived from networks of globally coupled FitzHugh-Nagumo neurons (FitzHugh (1961); Nagumo et al. (1962)). Essentially the neural masses are approximated by the dynamics of an “effective” neuron (Buhmann (1989); Assisi et al. (2005)) for certain parameter regimes of coupling strength and dispersion. The details used for the various connectivity scenarios are presented in the appendix. In particular, we also include situations, which correspond to more complex dynamics such as in rotating wave patterns, commonly seen in spatiotemporal brain maps of α – rhythms (Fuchs et al. (1987); Friedrich et al. (1991)). Given the locations of the neural masses, the scalp potential is computed by means of a spatial forward solution (Mosher et al. (1999)) which can be mathematically expressed as
| (8) |
where x(t) is the source dynamics, q is position, and Θ is the orientation of the dipole. For a spherically symmetric head model, the orientation is defined by the azimuthal (ϕ) and vertical (θ) angles. H is the forward matrix and Ψ(t) is the electromagnetic activity measured on the scalp from all the sensors. In the entire paper we use a spherical 1-shell model with conductivity, σ = 1 for our simulations (Mosher et al. (1999)).
3.2. Analysis of synthetic EEG data
We consider the following connectivity scenarios:
3.2.1. Uncoupled Sources, Fig 1c
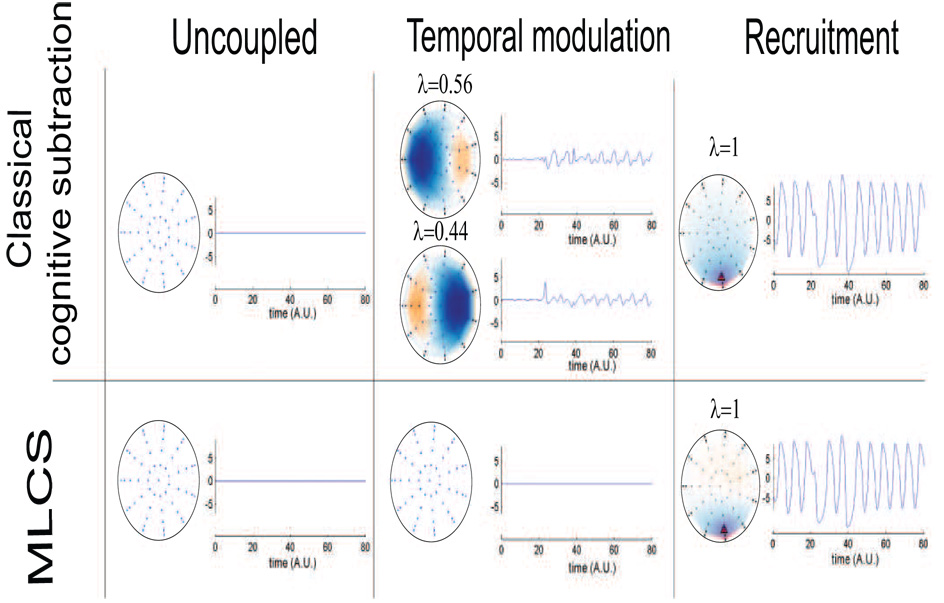
Here, the two cortical sources are uncoupled and hence the forward solution for the task condition is just a linear summation of the activities for each control condition. In other words, there is zero temporal modulation and no additional networks are recruited. Hence, a perfect reconstruction is expected from both MLCS and pure insertion based cognitive subtraction. The latter is expressed as
| (9) |
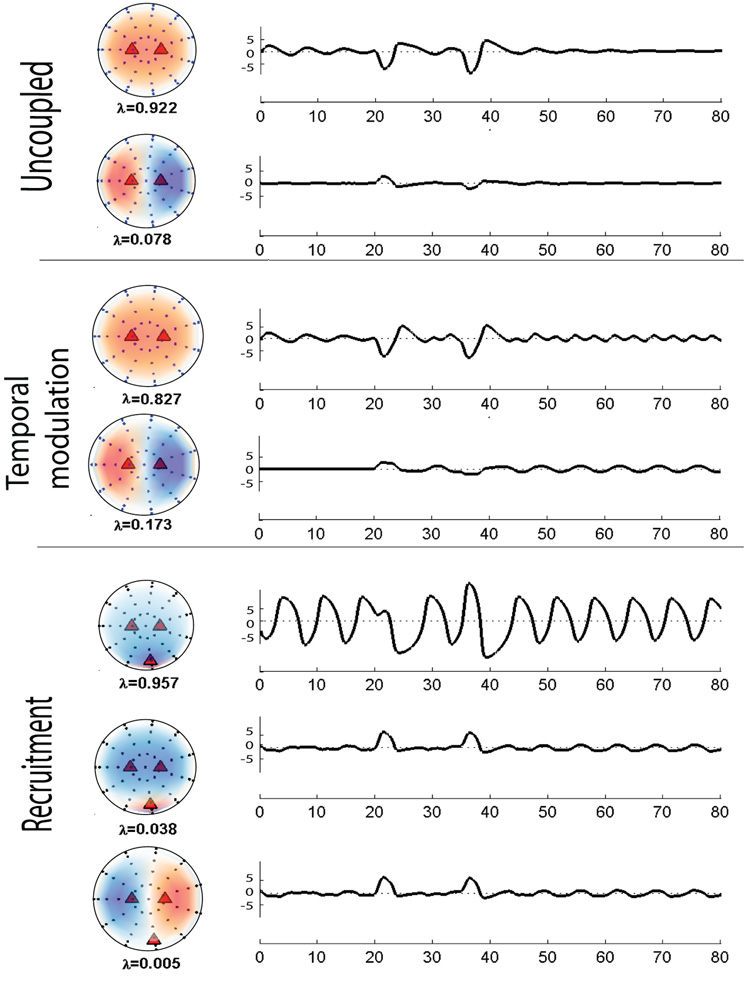
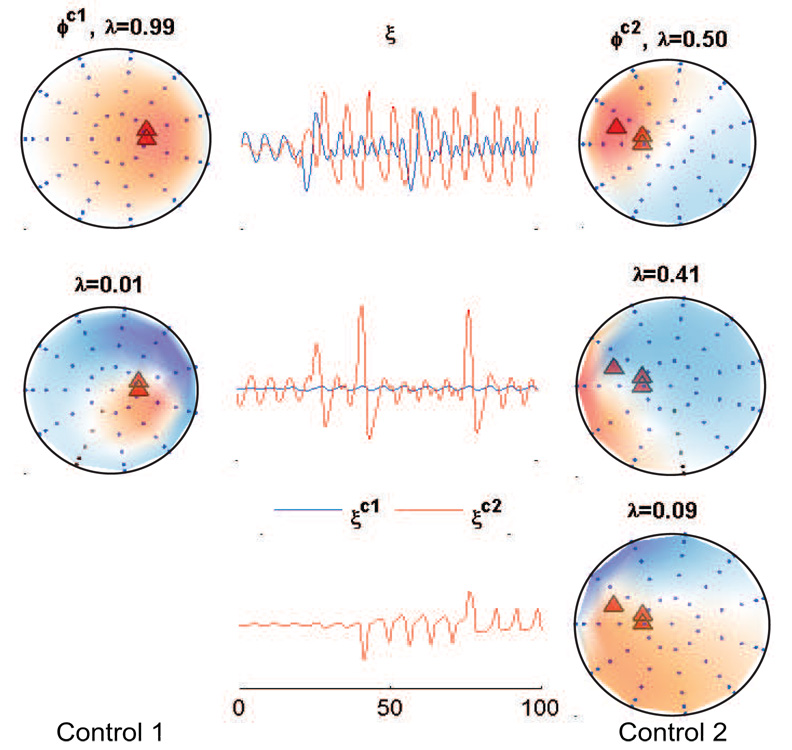
The residuals obtained from both methods are zero complemented by a 100% goodness of fit of the reconstruction using MLCS. One of the motivations behind a cognitive subtraction approach (both MLCS and pure insertion) is to investigate the individual contributions of the control spaces in a task condition. Under most circumstances, a direct mode decomposition of the task condition will not be able to extract such information about each of the control spaces. This is shown in Fig 6 where the principal components of the task condition did not recover the control spaces unambiguously. Hence, MLCS retains one key attribute of regular multifactorial experimental designs, namely, it is able to quantify the contributions of the controls in a task condition.
Fig. 6.
Decomposition of scalp potentials obtained from the task signal by principal component analysis. The figure illustrates that the proper contribution of underlying control spaces is not isolated by direct decomposition of the task signal in uncoupled (top), temporal modulation (middle) and recruitment (bottom) scenarios.
3.2.2. Temporally Coupled Sources, Fig 1d
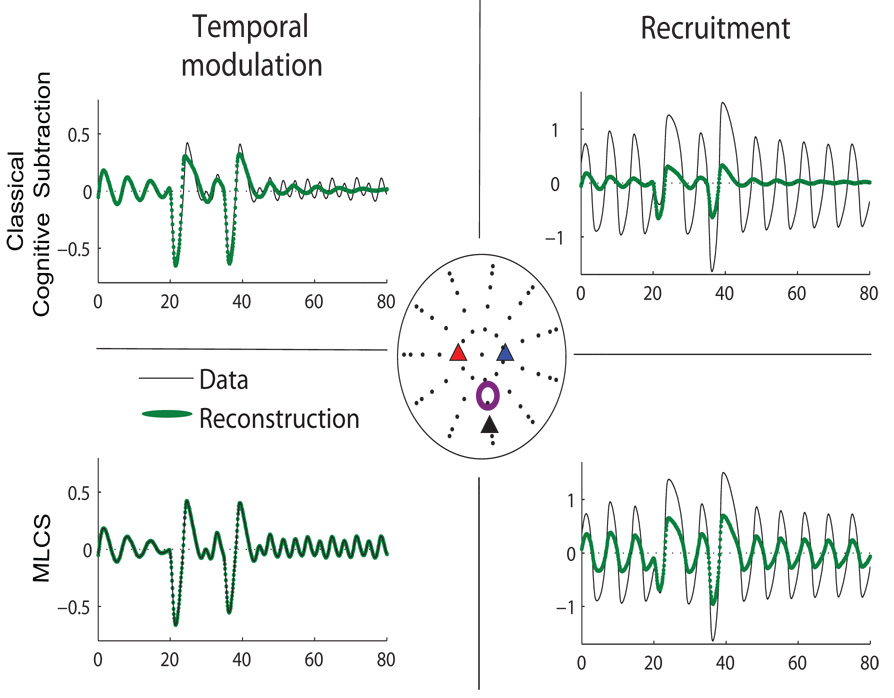
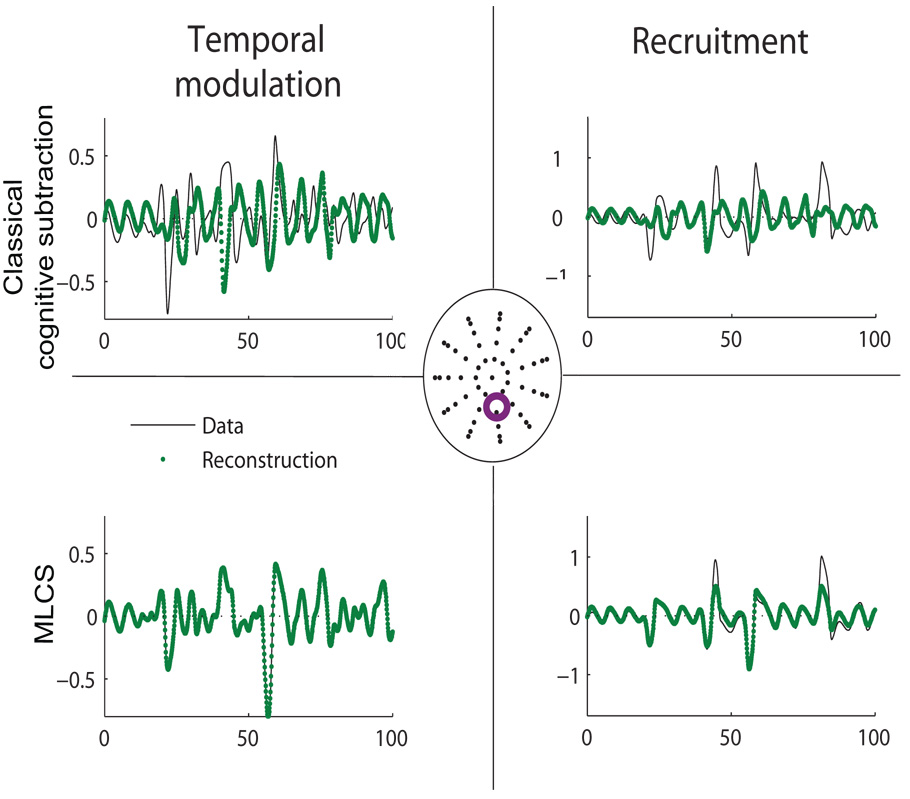
Temporal coupling between two control cortical sources can be induced by non-linear coupling functions as illustrated in section 3.1. Following the application of MLCS we obtain a 100% reconstruction of the task condition as shown in Fig 7. As expected, the residuals from such an approach are zero and goodness of fit is 100% and temporal modulation can be characterized by high goodness of fit of the reconstruction. As in the previous case of uncoupled sources, a direct PCA on the task data (Fig 6) did not elicit the scalp components whose superposition generated the task condition. Here, additional activity in the task signal did not involve additional brain areas. This is a prototypical non-linear brain interaction in which a standard cognitive subtraction based on pure insertion (Friston et al. (1996)) will fail. For comparison, we perform cognitive subtraction by computing the residual Rc (see equation 9). As evident in Fig 5, principal components of Rc project in the same subspace as that of controls. However, the temporal coefficients of the corresponding spatial modes are completely dissimilar to the time course of the underlying control spaces (see Fig 4).
Fig. 7.
Representative time series (black lines) from one sensor and corresponding reconstruction (green lines) by cognitive subtraction (top row) and MLCS (bottom row) respectively. In the center is a scalp map in which the control source 1 is labeled as blue, control source 2 labeled as red and the additional source for recruitment only case is labeled as black triangles. The purple circle is the sensor location where the time series is recorded. Left column illustrates temporal modulation. Right column shows recruitment.
Fig. 5.
Analysis of the residuals R12 for cognitive subtraction and MLCS for the different task conditions. In the case of uncoupled sources (left column), the residual is null for both the cognitive subtraction and the MLCS. In the case of recruitment (right column), both methods identify a residual in the posterior regions. In the case of temporal modulation however (center column), MLCS shows that there are no other spatial modes recruited during the task while cognitive subtraction shows residual activity. λ represents the eigenvalue of the corresponding spatial mode normalized to 1.
Fig. 4.
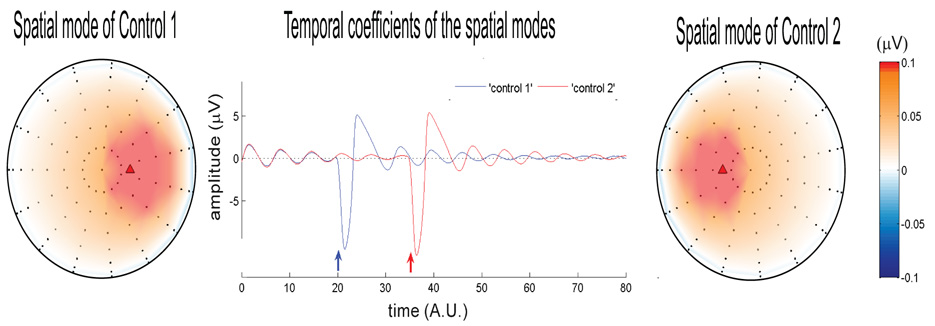
Spatial modes generated for the control conditions (two side columns) and their corresponding temporal coefficients (center column). The time courses are plotted in arbitrary units (A.U.). Black dots are the sensors on the scalp (shown as a 2D projection from the top) and red triangles are sources inside the brain. For all simulations the dipolar sources for control conditions are directed along z – axis direction and placed at symmetric location (−0.3, 0, 0.3) and (0.3, 0, 0.3) in Cartesian space. The sources are excited at t = 20 (blue arrow) and t = 35 (red arrow) for control 1 and 2 respectively. The eigenvalue for each spatial mode is 1 which reflects that 100% of the control condition can be decomposed into temporal dynamics of one spatial mode.
3.2.3. Recruitment of additional networks, Fig 1e
For recruitment only cases, reconstruction quality for the task condition is reduced by a significant extent to goodness of fit= 25% (we plot a representative time series obtained from one of the sensors in Fig 7). Earlier we stated that pure insertion-based cognitive subtraction is primarily tuned for detecting spatially linear recruitment. To validate this point, the principal components of residuals computed via MLCS and cognitive subtraction are plotted in Fig 5. Both methods yield equivalent results. As a result of MLCS the residual data R is reorganized to a subspace which is orthogonal to the control space. We perform a principal component analysis of the raw task signal and obtain the scalp components along with corresponding temporal coefficients (see Fig 6). However, these components do not reflect any similarity with the control modes shown in Fig 4. Hence, it is evident that the direct decomposition of the task signal is not an appropriate technique to comment on the contribution of underlying control spaces.
3.2.4. Mixed cases, Fig 1f
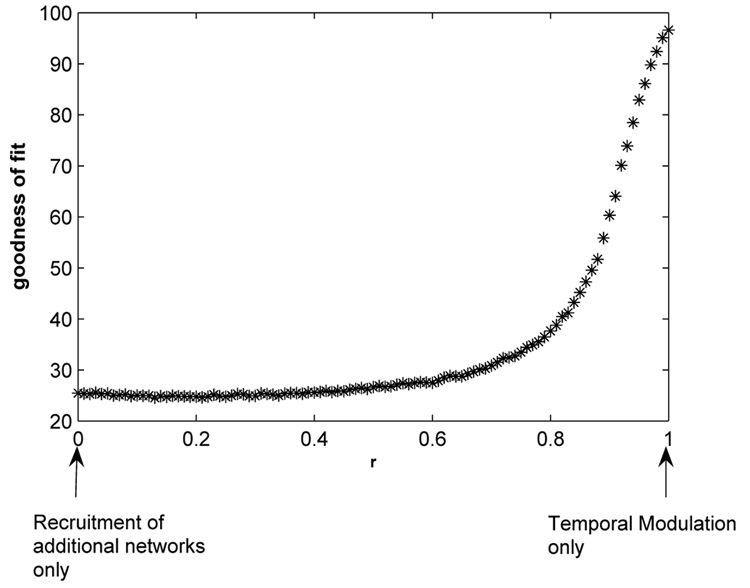
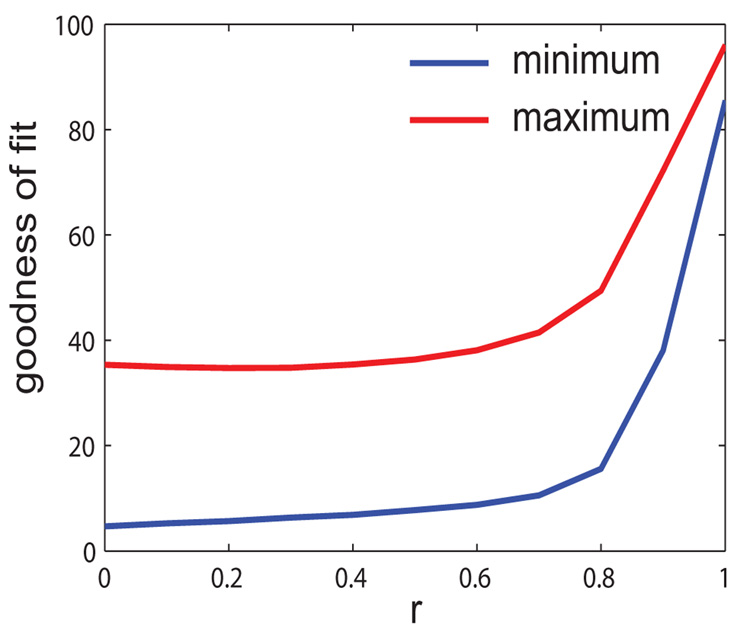
For mixed cases, both temporal modulation and recruitment of additional networks occur simultaneously. We implemented this in the task condition by parameterizing effective connectivity using a continuously varying parameter, r ∈ [0, 1] in section 3.1. MLCS is applied to the task signals which are obtained for discrete values of r ∈ [0, 1]. A plot of the goodness of fit versus r (Fig 8) encapsulates the results. Consequently, we argue that the reconstruction capability from the MLCS technique rises with an increase in effective connectivity between the two control sources (increasing values of r). A saturation of the curve at r < 0.6 allowed us three distinct possibilities. For high goodness of fit ( > 85% and corresponding r > 0.9) we argue that temporal modulation is more likely to be the mechanism for information processing. For medium goodness of fit (40% < goodness of fit < 85%) there is more likelihood of mixed conditions (0.25 < r < 0.9) being dominant and for low goodness of fit (< 40%) recruitment of additional networks (r < 0.25) seems to be the primary mechanism for information transfer. We address these criteria more systematically in the following section.
Fig. 8.
MLCS applied to data obtained for mixed cases. Here, we plot the goodness of fit vs r to summarize the results obtained for all values of r.
3.2.5. Rotating and traveling wave patterns
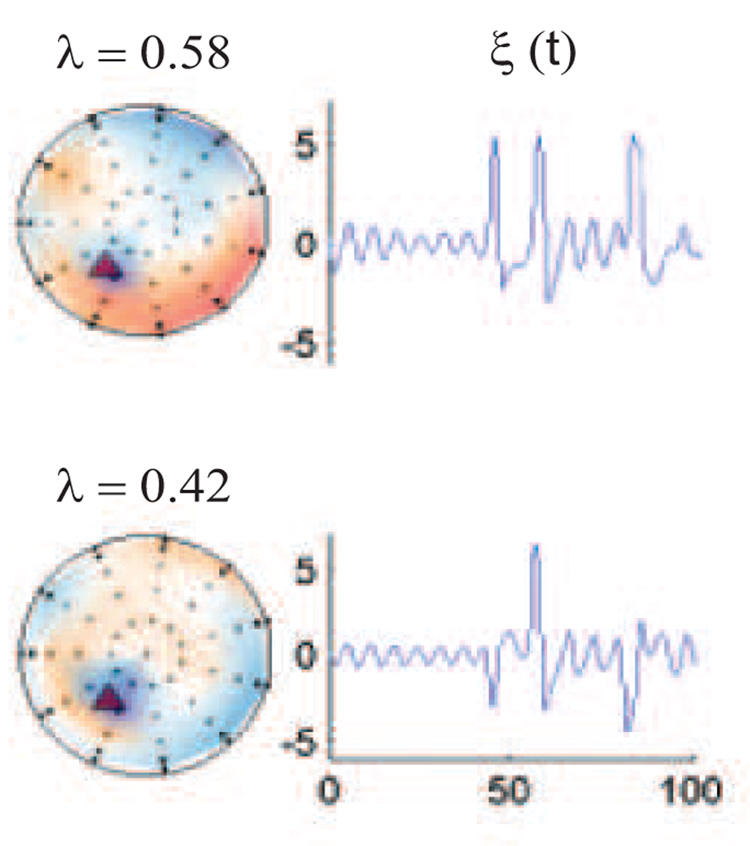
The spatial maps of control 2 and task conditions show rotating wave dynamics. In analogy with the earlier work (Fig 4), the principal components of the control conditions which constitutes the control space are plotted (Fig 10). A 100% goodness of fit is obtained for the reconstruction when 5 coupled sources (same as the controls) generated a task condition data by temporal modulation only. For illustration, representative time series at one sensor and its corresponding reconstruction using MLCS and cognitive subtraction are plotted in Fig 11. As a result the residual is zero under application of MLCS and non-zero during cognitive subtraction. Thus, MLCS predicted that the task signal is primarily generated from temporal modulation of control sources whereas cognitive subtraction failed. The ‘recruitment only’ scenario is obtained in section 3.1 via inclusion of an additional area which lies outside the control space. Here MLCS yielded a considerable reduction in the goodness of fit = 64% compared to temporal modulation scenario (where goodness of fit = 100%). Representative time series and its reconstruction at one sensor via cognitive subtraction and MLCS are presented in Fig 11. In addition, a principal component analysis on the residual R is performed, which extracts the activity of the additional subspaces as seen from the spatial maps and its contribution to the temporal dynamics of the task signal Fig 12. One source from the control condition is disengaged in the network which generated the task condition. A new source of similar strength and orientation is placed in a different location while the total number of sources remained the same as in the control conditions. The presence of this additional network is characterized by a considerable depreciation in reconstruction quality from temporal modulation scenario.
Fig. 10.
Rotating waves example Spatial modes generated for the control conditions (side columns) and their corresponding temporal coefficients (center column). Black dots are the sensors on the scalp (shown as a 2D projection from the top) and red triangles are sources inside the brain. Control condition 1 is generated by two temporally coupled excitators at the two locations shown in red triangles on the left column. Control 2 exhibited a rotating wave dynamics in the scalp map and is generated by three temporally coupled excitators, locations of which are shown with three red triangles in the right column.
Fig. 11.
Rotating waves example Time series and corresponding reconstruction at a location marked by the purple circle in the scalp map (center), via cognitive reconstruction (top row) and MLCS (bottom row). Left column illustrates temporal modulation. Right column shows recruitment
Fig. 12.
Rotating waves example Principal component analysis of the residuals obtained during recruitment only scenarios. For reference only the additional source is shown with the red triangle. Spatial maps are shown for the two most dominant eigenvalues.
3.3. Sensitivity to orientation of dipolar sources
A crucial aspect of the forward solution is the dependence of the scalp potential on the location and orientation of the dipole source. For a spherically symmetric geometry, the relevant orientation variables are the azimuthal ϕ and vertical θ angles, which we simulated for multiple vales (see 9). We plot the goodness of fit as a continuous surface under varying orientations (θ, ϕ) of the third dipole and its effective connectivity r. The location and orientation of control sources are fixed. It is evident from Fig 9 that the goodness of fit surface saturates for a parameter regime r < 0.6 for all θ and ϕ.
Fig. 9.
Goodness of fit vs r when θ is varying from 0 to Π, ϕ from 0 to 2 Π. We plot here the minimum and maximum projections on 2D which quantify the boundaries between which the goodness of fit values are distributed. In other words all surfaces GF(r, ϕ, θ) are bounded by these curves. Note that a saturation occurs for all surfaces at r < 0.6. Hence for any spatiotemporal reorganization with r < 0.6, reconstructions of task signal will not fit well. This analysis emphasizes the need for a model for estimation of effective connectivity from the goodness of fit measure.
4. Summary and Discussion
Mode Level Cognitive Subtraction (MLCS) motivates the design of behavioral paradigms from the perspective of network reorganization. Spatial reorganization involves the recruitment of additional networks during neural information processing, for instance, as known from multisensory integration (Meredith and Stein (1983); Molholm et al. (2002)). In contrast, temporal reorganization may result in amplitude modulation of electromagnetic activity in existing networks. To disambiguate these mechanisms of neural information processing, MLCS identifies the control space on the scalp level (obtained from the experimental control conditions), into which the scalp activity of task conditions are projected. Frequently evoked alternative interpretations to the presence of residual signals, including non-stationarity, non-linear coupling between the control condition networks and the experimental task networks, and simple temporal reorganization of the existing network that results in cancelation of observed electrical fields, do not pose a problem for MLCS, because MLCS measures the confinement of a signal to the control space and is not affected by the varying degrees of complexity in the time domain. For instance, the last alternative interpretation raised, cancellation of observed electrical fields, is particularly relevant in a sensorimotor coordination task where dipoles on opposite sides of the central sulcus are likely to be present and which will interfere with one another. Here all spatiotemporal reorganization will remain - by construction - confined to the control space and MLCS will identify a residual signal of zero.
Hence, it is actually the experimental design and the control conditions which have most influence upon the usefulness of MLCS. Typically, a guideline for a good MLCS experimental design is a well-defined hypothesis of the information processing mechanism underlying the actual cognitive operation. For instance, multifactorial experimental designs (Sternberg (1969)) in multisensory and sensorimotor paradigms are often based upon control conditions distinguishing cognitive, perceptual and motor components. It is worthwhile to note that the decompositions are usually functionally motivated and generally do not make any conclusive reference to the underlying neural sources. For example, auditory and visual evoked potential time locked to external auditory and visual stimuli or motor evoked potentials time locked to flexion and extension movement cycles can serve as very useful control signals as they seem to have the most widely accepted waveform shapes in the literature. Also, the selection of the stimuli type (example, flash or checker board patterns for visual) and epoch lengths are crucial for obtaining stationary signals (Picton et al. (2000)). Subsequently, statistical significance of the goodness of fit measure is also affected by these design principles as well as the number of observations. Significant differences in the goodness of fit across two or more task conditions may be computed by the analysis paradigm of repeated measures. Picton et al. (2000) also suggest standard corrections that need to be employed in such measurements. Proper care should be placed to select the modes that span the control basis. One possible way is to plot the eigenvalue spectrum of the principal components on a logarithmic scale. The noise tail can be identified on this plot for normally distributed noise (Mitra and Pesaran (1999)). Identification of the signal space will be simpler when it is a low rank structure in the entire data matrix or complementarily the corresponding eigenvalues are significantly higher than the noise tail. More complex cognitive paradigms, for instance involving speech or emotion, may require more functionally based control conditions, which cannot be assigned to individual cortical sources. However, such is not even necessary in this context as MLCS is not an inverse technique and hence the control conditions may be chosen arbitrarily complex in their network organization (spatial and temporal). The key aspect, though, that may be addressed by MLCS is the degree to which the brain signal of the actual task condition is captured by the networks present in the control conditions. Furthermore, following the lines of thought of Picton et al. (2000) a source analysis on the residual signal can also be performed. Resampling methods such as bootstrapping may improve the goodness of fit measurements. Our spatial sensitivity analysis (see Fig 3 and corresponding text) shows that the likelihood of two control networks projecting into the same subspace on the scalp level can be quantified with a forward model. Hence, large-scale brain networks are best-suited for this approach.
The major benefit of the application of MLCS is that it is able to capture the time course of recruited network activity as well as the temporal modulation of subspaces identified in the control conditions. In conjunction with other functional imaging techniques such as fMRI and PET, complementary information on the actual underlying sources may be obtained to refine the interpretation of the MLCS subspaces.
Fig. 2.
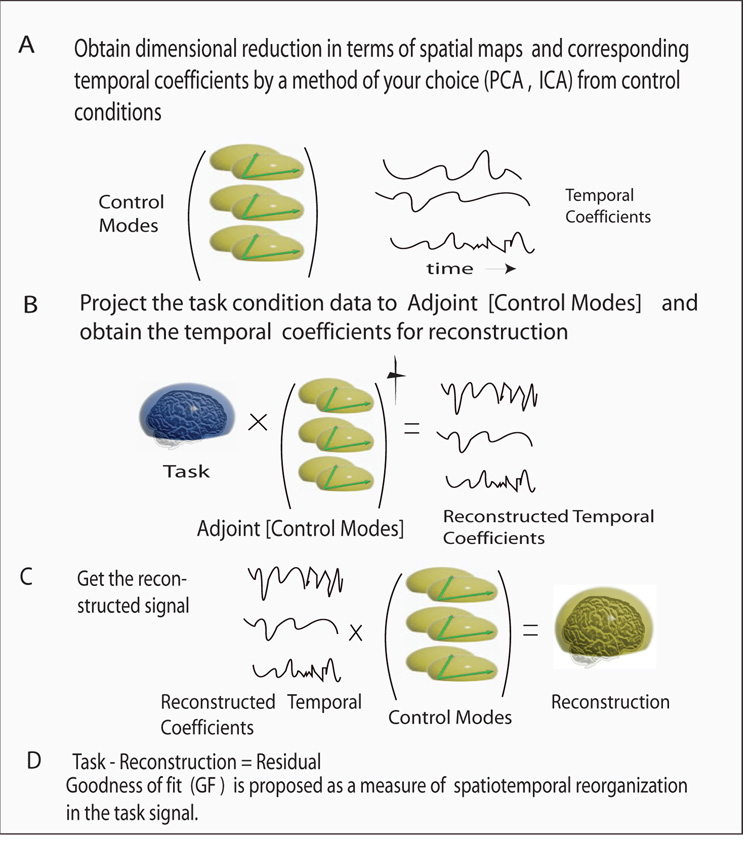
Summary of the key steps involved in MLCS articulated by a cartoon: A) High dimensional EEG/ MEG data from control conditions are decomposed into a set of low dimensional scalp components (green coordinates) and corresponding temporal coefficients (time series in black) using PCA/ICA/SOBI, etc. B) Projection of the task signal (blue scalp) onto the control modes space created from the scalp components of step (A). Resulting temporal coefficients represent the contribution from solely control space stimulation in the task signal. C) The temporal coefficients obtained from step B are now projected back to the control basis created in step A to reconstruct the task signal (green scalp). D) Goodness of fit of the reconstruction quantifies the degree with which the control modes space is reorganized in the task signal. As a rule of thumb, if the reconstruction is high (~85 % 90%), temporal modulation is the dominant mechanism involved in generating the task condition, and absence of additional networks in subsequent dynamics would be the likely inference.
Acknowledgement
We wish to thank Dr. Armin Fuchs and Ajay Pillai for help with computation. This work was supported by the grants Brain NRG JSM22002082, ATIP (CNRS) and ONR N000140510104 to VKJ, and by NIMH grant MH42900 and NINDS Grant NS48299 to JASK.
Appendix A. Generation of synthetic EEG data
To simulate the cortical dynamics of a neural mass or a effective neuron located at different locations, we use the neural mass following generalized FitzHugh-Nagumo neurons (see Buhmann (1989); Assisi et al. (2005)):
| (A.1) |
where x is related to the mean membrane potential and y is related to the membrane current. The dot indicates the time derivative. a and c are constant parameters and define the position of the equilibrium point and the time scale, respectively. I is an external input and the functions define the dynamic flow in the state space as a function of the behavioral task. We used c = 1; a = 1.08; b = 0 to restrict the dynamics of effective neuron in the excitable regime where given an input at time t, membrane potential completes a cycle and then goes to a fixed point. Input to a effective neuron is usually triggered by external sensory stimuli such as flashes of light or auditory tones as well as certain patterns of motor behavior such as flexion and extension cycles of human finger movement.
The source dynamics for each case of Fig 1 is set up as follows.
- One source located at rq1, following equation A.1. The scalp potential is expressed as
where H(rq1, θ) is the forward solution for the dipole at rq1 with orientation Θ = (θ, ϕ). θ, ϕ are vertical and azimuthal angles.(A.2) - Same procedure is followed as in (a) at location rq2. So,
(A.3) - Two sources (1 and 2) are located at rq1 and rq2 respectively. For j = 1, 2
Hence(A.4) (A.5) - Two sources (1 and 2) are located at rq1 and rq2 respectively and coupled. For j = 1, 2; k = 1, 2 and j ≠ k
where the coupling is expressed as(A.6)
The coupling is chosen following (Haken et al. (1985)). The scalp potential is obtained by equation A.5(A.7) - Two sources (1 and 2) are located at rq1 and rq2 and an additional one (3) at rq3. 1 and 2 projects to 3 such that unidirectional coupling existed between 1 → 3 and 2 → 3. No direct coupling existed between 1 and 2 like the previous case (d). For j = 1, 2
The scalp potential for this task condition is expressed as(A.8) (A.9) - Here, the contributions from scenarios (d) and (e) are weighted via a continuously varying parameter r. For j = 1, 2; k = 1, 2 and j ≠ k
(A.10)
In the limit case scenario of r = 0 one obtains recruitment only and for r = 1, temporal modulation is realized. Scalp potential is obtained by using expression A.9.
Generation of rotating waves
The dipole orientations of two sources is chosen to be 90 degrees. The source dynamics for control condition 2 is simulated by three coupled sources following equation A.10. Sources for control 1 are at {rq1, rq2} and for control 2 are at {rq3, rq4, rq5}. Thereafter, the scalp potential for control 2 is obtained by expression A.9.
For simulating temporal modulation in a task signal we introduce coupling between control 1 and control 2 networks. The equations for each source involved in the dynamics are expressed as,
| (A.11) |
Temporal modulation is realized for r = 1 and recruitment only is obtained for r = 0. We place a fifth source at rq5 (of equation A.11) at the same location as control condition 2 to generate the temporal modulation scenario and in a different location rq6 for recruitment only scenario (for rq6 location, see Fig 12).
Footnotes
Publisher's Disclaimer: This is a PDF file of an unedited manuscript that has been accepted for publication. As a service to our customers we are providing this early version of the manuscript. The manuscript will undergo copyediting, typesetting, and review of the resulting proof before it is published in its final citable form. Please note that during the production process errors may be discovered which could affect the content, and all legal disclaimers that apply to the journal pertain.
References
- Assisi CG, Jirsa VK, Kelso JAS. Synchrony and clustering in heterogeneous networks with global coupling and parameter dispersion. Phys Rev Lett. 2005;94(1):018106–018110. doi: 10.1103/PhysRevLett.94.018106. [DOI] [PubMed] [Google Scholar]
- Bell AJ, Sejnowski TJ. An information-maximization approach to blind separation and blind deconvolution. Neural Comp. 1995;7(6):1129–1159. doi: 10.1162/neco.1995.7.6.1129. [DOI] [PubMed] [Google Scholar]
- Bressler SL, Tognoli E. Operational principles of neurocognitive networks. Int J Psychophysiol. 2006;60(2):139–148. doi: 10.1016/j.ijpsycho.2005.12.008. [DOI] [PubMed] [Google Scholar]
- Bressler SL, Kelso JAS. Cortical coordination dynamics. Trends in Cognitive Sciences. 2001;5:26–36. doi: 10.1016/s1364-6613(00)01564-3. [DOI] [PubMed] [Google Scholar]
- Bressler SL, Coppola R, Nakamura R. Episodic multiregional cortical coherence at multiple frequencies during visual task performance. Nature. 1993;366(6451):153–156. doi: 10.1038/366153a0. [DOI] [PubMed] [Google Scholar]
- Buhmann Oscillations and low firing rates in associative memory neural networks. Phys Rev. A. 1989;40(7):4145–4148. doi: 10.1103/physreva.40.4145. [DOI] [PubMed] [Google Scholar]
- Bushara KO, Hanakawa T, Immisch I, Toma K, Kansaku K, Hallett M. Neural correlates of cross-modal binding. Nat Neurosci. 2003;6(2):190–195. doi: 10.1038/nn993. [DOI] [PubMed] [Google Scholar]
- Calvert GA, Hansen PC, Iversen SD, Brammer MJ. Detection of audio-visual integration sites in humans by application of electrophysiological criteria to the BOLD effect. NeuroImage. 2001;14(2):427–438. doi: 10.1006/nimg.2001.0812. [DOI] [PubMed] [Google Scholar]
- Damasio A. The brain binds entities and events by multiregional activations from convergence zones. Neural Comp. 1989;1:123–132. [Google Scholar]
- David O, Friston KJ. A neural mass model for MEG/EEG: coupling and neuronal dynamics. NeuroImage. 2003;20(3):1743–1755. doi: 10.1016/j.neuroimage.2003.07.015. [DOI] [PubMed] [Google Scholar]
- De Monte S, d’Ovidio F, Mosekilde E. Coherent regimes of globally coupled dynamical systems. Phys Rev Lett. 2003;90(5):054102. doi: 10.1103/PhysRevLett.90.054102. [DOI] [PubMed] [Google Scholar]
- Dhamala M, Assisi CG, Jirsa VK, Steinberg FL, Kelso JAS. Multisensory integration for timing engages different brain networks. NeuroImage. 2007;34(2):764–773. doi: 10.1016/j.neuroimage.2006.07.044. [DOI] [PMC free article] [PubMed] [Google Scholar]
- Ding M, Bressler SL, Yang W, Liang H. Short-window spectral analysis of cortical event-related potentials by adaptive multivariate autoregressive modeling: data preprocessing, model validation, and variability assessment. Biol Cybern. 2000;83(1):35–45. doi: 10.1007/s004229900137. [DOI] [PubMed] [Google Scholar]
- Ferree TC, Nunez PL. Handbook of Brain Connectivity. Springer; 2007. Chap. Primer on Electroencephalography for Functional Connectivity. [Google Scholar]
- FitzHugh R. Impulses and physiological states in theoretical models of nerve membrane. Biophysical J. 1961;1:445–466. doi: 10.1016/s0006-3495(61)86902-6. [DOI] [PMC free article] [PubMed] [Google Scholar]
- Freeman WJ. A model for mutual excitation in a neuron population in olfactory bulb. IEEE Trans Biomed Eng. 1974;21(5):350–358. doi: 10.1109/TBME.1974.324403. [DOI] [PubMed] [Google Scholar]
- Friedrich R, Fuchs A, Haken H. Rhythms in biological systems. Springer; 1991. Chap. Spatio-temporal EEG Patterns; pp. 315–337. [Google Scholar]
- Friston KJ, Price CJ, Fletcher P, Moore C, Frackowiak RS, Dolan RJ. The trouble with cognitive subtraction. Neuroimage. 1996;4(2):97–104. doi: 10.1006/nimg.1996.0033. [DOI] [PubMed] [Google Scholar]
- Fuchs A, Friedrich R, Haken H, Lehmann D. Computational systems-Natural and artificial. Berlin: Springer; 1987. Chap. Spatio-temporal analysis of multichannel α-EEG map series. [Google Scholar]
- Geselowitz DB. On bioelectric potentials in an inhomogeneous volume conductor. Biophys J. 1967;7:1–11. doi: 10.1016/S0006-3495(67)86571-8. [DOI] [PMC free article] [PubMed] [Google Scholar]
- Grynszpan F, Geselowitz DB. Model studies of the magnetocardiogram. Biophys J. 1973;13(9):911–925. doi: 10.1016/S0006-3495(73)86034-5. [DOI] [PMC free article] [PubMed] [Google Scholar]
- Haken H, Kelso JAS, Bunz H. A theoretical model for phase transitions of human hand movement. Biol Cybern. 1985;51:347–356. doi: 10.1007/BF00336922. [DOI] [PubMed] [Google Scholar]
- Hämäläinen MS, Sarvas J. Realistic conductivity geometry model of the human head for interpretation of neurormagnetic data. IEEE Trans Biomed Eng. 1989;36(2):165–171. doi: 10.1109/10.16463. [DOI] [PubMed] [Google Scholar]
- Hoffman K, Kunze R. Linear Algebra. Prentice-Hall: 1961. [Google Scholar]
- Jirsa VK, Kelso JAS. Integration and segregation of perceptual and motor behavior. In: Jirsa VK, Kelso JAS, editors. Coordination Dynamics: Issues and Trends. Berlin, Heidelberg, New York: Springer; 2004. pp. 243–259. [Google Scholar]
- Jirsa VK, Jantzen KJ, Fuchs A, Kelso JAS. Spatiotemporal forward solution of the EEG and MEG using network modelling. IEEE Trans on Med Imaging. 2002;21:493–504. doi: 10.1109/TMI.2002.1009385. [DOI] [PubMed] [Google Scholar]
- Kelso JAS. 1 ed. Cambridge, MA: The MIT Press; 1995. Dynamic Patterns: The self-organization of brain and behaviour. [Google Scholar]
- Kelso JAS, Engstrom DA. The Complementary Nature. Cambridge, MA: The MIT Press; 2006. [Google Scholar]
- Lopes da Silva FH, Hoeks A, Smits H, Zetterberg LH. Model of brain rhythmic activity. The alpha-rhythm of the thalamus. Kybernetik. 1974;15(1):27–37. doi: 10.1007/BF00270757. [DOI] [PubMed] [Google Scholar]
- McIntosh AR. Contexts and catalysts: A resolution of the localization and integration of function in the brain. Neuroinformatics. 2004;2(2):175–182. doi: 10.1385/NI:2:2:175. [DOI] [PubMed] [Google Scholar]
- Meredith MA, Stein BE. Interactions among converging sensory inputs in the superior colliculus. Science. 1983;221(4608):389–391. doi: 10.1126/science.6867718. [DOI] [PubMed] [Google Scholar]
- Mesulam MM. From sensation to cognition. Brain. 1998;121:1013–1052. doi: 10.1093/brain/121.6.1013. [DOI] [PubMed] [Google Scholar]
- Mitra P, Pesaran B. Analysis of brain imaging data. Biophys. J. 1999;76:691–708. doi: 10.1016/S0006-3495(99)77236-X. [DOI] [PMC free article] [PubMed] [Google Scholar]
- Molholm S, Ritter W, Murray MM, Javitt DC, Schroeder CE, Foxe JJ. Multisensory auditory-visual interactions during early sensory processing in humans: a high-density electrical mapping study. Cogn Brain Res. 2002;14(1):115–128. doi: 10.1016/s0926-6410(02)00066-6. [DOI] [PubMed] [Google Scholar]
- Mosher JC, Leahy RM, Lewis PS. EEG and MEG: forward solutions for inverse methods. IEEE Trans Biomed Eng. 1999;46(3):245–259. doi: 10.1109/10.748978. [DOI] [PubMed] [Google Scholar]
- Nagumo J, Arimoto S, Yoshizawa S. An active pulse transmission line simulating nerve axon. Procedings of the IRE 50. 1962;50:2061–2070. [Google Scholar]
- Nunez PL. The brain wave equation: A model for EEG. Mathematical Biosciences. 1974;21:279–297. [Google Scholar]
- Picton TW, Bentin S, Berg P, Donchin E, Hillyard SA, Johnson R, Miller GA, Ritter W, Ruchkin DS, Rugg MD, Taylor MJ. Guidelines for using human event-related potentials to study cognition: recording standards and publication criteria. Psychophysiology. 2000;37(2):127–152. [PubMed] [Google Scholar]
- Rodriguez E, George N, Lachaux JP, Martinerie J, Renault B, Varela FJ. Perception’s shadow: long-distance synchronization of human brain activity. Nature. 1999;397(6718):430–433. doi: 10.1038/17120. [DOI] [PubMed] [Google Scholar]
- Sanders AF. Tutorials in Motor Behavior. North Holland: 1980. Chap. Stage analysis of reaction processes. [Google Scholar]
- Sporns O, Gally JA, Reeke GN, Edelman GM. Reentrant signaling among simulated neuronal groups leads to coherency in their oscillatory activity. Proc Natl Acad Sci U S A. 1989;86(18):7265–7269. doi: 10.1073/pnas.86.18.7265. [DOI] [PMC free article] [PubMed] [Google Scholar]
- Sternberg S. Attention and performance II. North Holland: Amsterdam; 1969. Chap. The discovery of processing stages: Extensions of Donders’s method. [Google Scholar]
- Tang AC, Sutherland MT, McKinney CJ. Validation of sobi components from high-density EEG. NeuroImage. 2005;25(2):539–553. doi: 10.1016/j.neuroimage.2004.11.027. [DOI] [PubMed] [Google Scholar]
- Valdes PA, Jimenez JC, Riera J, Biscay R, Ozaki T. Nonlinear EEG analysis based on a neural mass model. Biol Cybern. 1999;81(5–6):415–424. doi: 10.1007/s004220050572. [DOI] [PubMed] [Google Scholar]


