

Abstract
Objectives
We investigated whether transmural mechanics could yield insight into the transmural electrical sequence.
Background
Although the concept of transmural dispersion of repolarization has helped explain a variety of arrhythmias, its presence in vivo is still disputable.
Methods
We studied the time course of transmural myofiber mechanics in the anterior left ventricle of normal canines in vivo (n = 14) using transmural bead markers under biplane cineradiography. In 4 of these animals, plunge electrodes were placed in the myocardial tissue within the bead set to measure transmural electrical sequence.
Results
The onset of myofiber shortening was earliest at endocardial layers and progressively delayed toward epicardial layers (p < 0.001), resulting in transmural dispersion of myofiber shortening of 39 ms. The onset of myofiber relaxation was earliest at epicardial layers and most delayed at subendocardial layers (p = 0.004), resulting in transmural dispersion of myofiber relaxation of 83 ms. There was no significant transmural gradient in electrical repolarization (p = NS).
Conclusions
Despite lack of evidence of significant transmural gradient in electrical repolarization in vivo, there is transmural dispersion of myofiber relaxation as well as shortening.
Over the past decade, the concept of transmural dispersion of repolarization (TDRepol), or electrical heterogeneity, of the ventricular myocardium (1,2) has provided a framework to understand normal and abnormal cardiac electrophysiology (3–7). Nevertheless, it is still unclear whether TDRepol is present in vivo, where myocardial cells are electrically coupled (8). Some studies suggest that there is no significant TDRepol in a healthy heart (9,10).
Although the primary function of the heart is mechanical, little attention has been paid to mechanical correlation of TDRepol (11), primarily because many studies of TDRepol were performed in vitro, using wedge preparations of perfused ventricular myocardium. Measurements pertaining to mechanical function in vivo might yield insight into transmural electrical sequence. Earlier studies suggest the presence of transmural dispersion of myofiber shortening (12) as well as myofiber relaxation (13) in vivo.
To test the hypothesis that there is transmural dispersion of both myofiber shortening and relaxation, we studied the time course of transmural myofiber mechanics in the left ventricular (LV) anterior wall of normal canine heart in vivo using transmurally implanted markers and biplane cineradiography with high spatiotemporal resolution.
Methods
All studies were performed according to the “Position of the American Heart Association on Research Animal Use.” All protocols were approved by the Animal Subjects Committee of the University of California, San Diego, which is accredited by the American Association for Accreditation of Laboratory Animal Care.
Experimental protocol
We studied adult mongrel dogs (n = 14, 20 kg to 30 kg) to measure the time course of transmural myofiber mechanics in the anterior LV in vivo during normal sinus rhythm or atrial pacing with pacing wires sutured on the left atrial (LA) surface. To measure 3-dimensional (3-D) transmural myofiber mechanics, under general anesthesia and median sternotomy, 3 transmural columns of four to six 0.8-mm-diameter markers and a 1.7-mm-diameter surface marker above each column were placed within the anterior wall between the first (D1) and the second diagonal branches (D2) of the left anterior descending coronary artery (LAD) (Fig. 1) (13). To provide end points for a LV long axis, 2-mm-diameter gold beads were sutured to the apical dimple (apex bead) and on the epicardium at the bifurcation of the LAD and left circumflex coronary artery (base bead). To measure transmural electrical sequence (minimum sampling rate = 1 kHz), we studied a subset of 4 of the 14 dogs. For these 4 dogs, 3 pairs of bipolar plunge electrodes with terminal distance of 1 mm to 3 mm were inserted in subepicardial, midwall, and subendocardial layers of the myocardial tissue within the bead set. The transmural location of the electrodes was histologically determined after euthanasia. Each animal was positioned in a biplane radiography system, and synchronous biplane cineradiographic images (125 frames/s) of the bead markers were digitally acquired with mechanical ventilation suspended at end expiration. Left ventricular pressure, central aortic pressure, LA pressure, and surface and bipolar plunge electrocardiograms (ECG) were recorded simultaneously with the cineradiographic images. At the end of the study, the animal was euthanized with pentobarbital sodium and the heart was perfusion-fixed with 2.5% buffered glutaraldehyde at the end-diastolic pressure measured in the study (13,14). Because the heart was fixed at end-diastolic pressure, fiber orientations in the fixed hearts were assumed to represent the fiber structure in the end-diastolic reference configuration in vivo (13,15,16).
Figure 1. Schematic Representation of the Heart.

The transmural bead set was implanted between the first (D1) and the second (D2) diagonal branch of the left anterior descending coronary artery (LAD) to measure finite deformation of the myocardial tissue across the wall. Endo = endocardium; Epi = epicardium; LCx = left circumflex coronary artery; LV = left ventricle.
Histology
To avoid the distortional effects of dehydration and shrinkage associated with embedding, histologic measurements were obtained using freshly fixed heart tissue. In the transmural block of tissue within the implanted bead set, the mean myofiber angle was measured with reference to the positive circumferential direction and was determined from epicardium to endocardium at every 1-mm-thick section sliced parallel to the epicardial tangent plane (13,15).
Data analysis
The time reference was defined as the peak R-wave on surface ECG for both mechanical and electrical data. The digital images from biplane X-ray were corrected for magnification and spherical distortion (13) to reconstruct the 3-D coordinates (17) of the bead markers. Continuous, nonhomogeneous transmural distributions of 3-D strains were computed for each frame as a deformed configuration with the peak R-wave on surface ECG as the reference state (15). The strain with respect to the local fiber coordinate, or fiber strain, was calculated from the strains and histologically measured myofiber angles at each depth. The strain time course was determined at 10 transmural layers: from 0% (epicardial surface) to 90% wall depth (subendocardium) by 10% increments. By convention in continuum mechanics, a negative strain represents shortening, whereas a positive strain represents stretch. The onset of myofiber shortening at each depth was defined as the time of peak positive strain. The onset of myofiber stretch, or myofiber relaxation, at each depth was defined as the time of peak negative strain. Transmural dispersion of myofiber shortening (TDShort) was defined as the transmural range of the onset of myofiber shortening. Transmural dispersion of myofiber relaxation (TDRelax) was defined as the transmural range of the onset of myofiber relaxation.
We followed an established method of bipolar electrical analysis in published reports, most recently used by Sengupta et al. (18). Briefly, the electrical activation was defined as the first peak of the derivative of QRS in the regional bipolar deflection, and the electrical repolarization was defined as the steepest terminal phase of the T-wave of the bipolar electrocardiogram (Fig. 2) (19). The same definition was applied when the T-wave was inverted. A strong correlation exists between the activation-recovery intervals measured from the first-order derivatives of QRS and T waves on the bipolar electrograms and the refractory periods and transmembrane action potential durations measured directly in cardiac tissues (20,21).
Figure 2. Bipolar Electrograms From Plunge Electrodes.
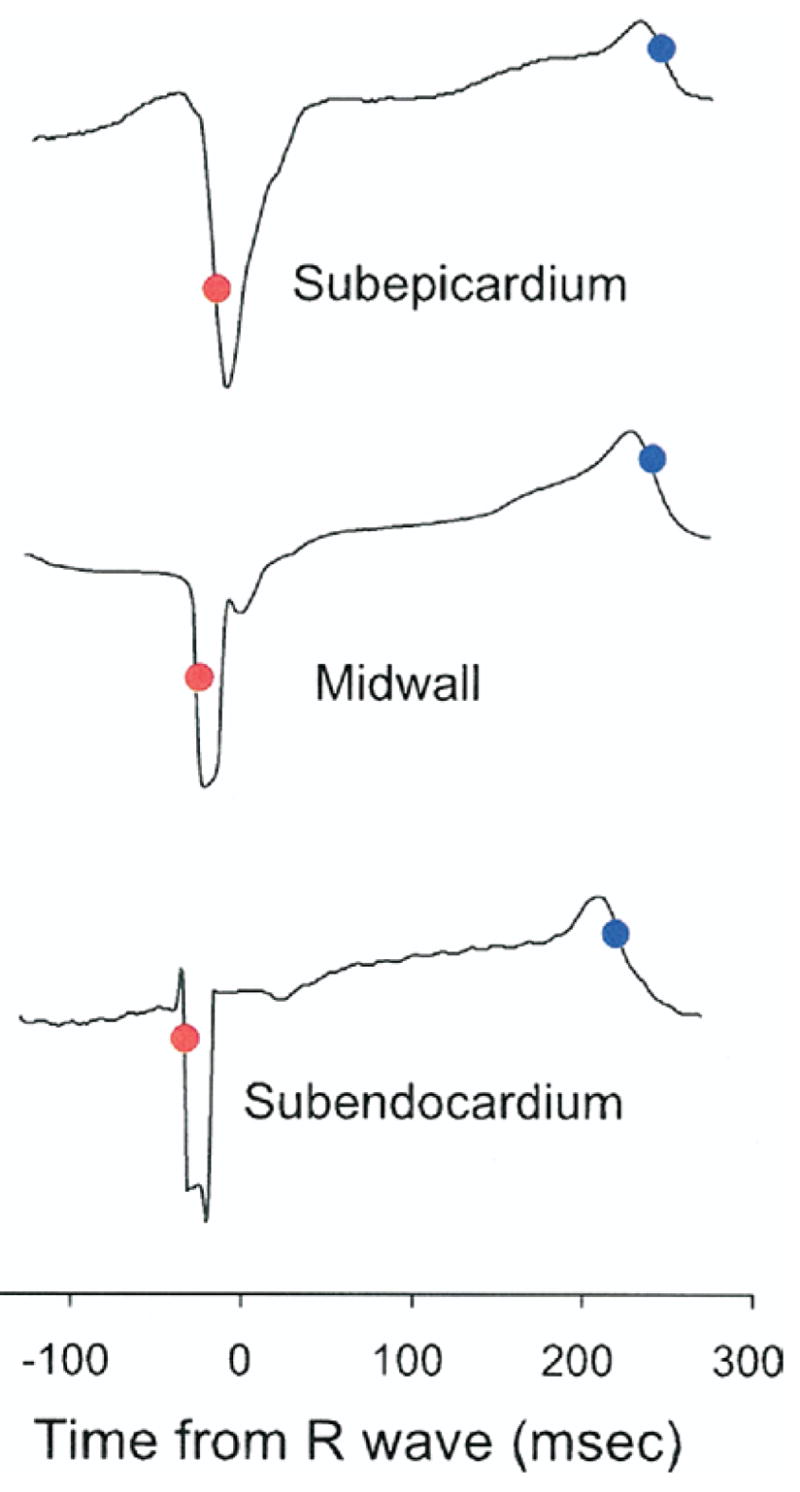
Red and blue dots mark the time points of steepest portion of initial bipolar QRS waveforms and end of the T wave, respectively. Note the endocardial-to-epicardial direction of depolarization, whereas no clear transmural dispersion of repolarization is observed.
Statistical analysis
Values are mean ± SD. To make our study comparable to previous similar studies (9,22), a sample size of 14 dogs was chosen for the mechanical data, and a sample size of 4 dogs was chosen for the electrical data. One-way repeated-measures analysis of variance (RMANOVA) was used to assess the effect of wall depth on the onset of shortening, relaxation, electrical activation, and repolarization. For the mechanical data, a paired t test was used to compare the 2 transmural ends (i.e., 0% vs. 90% wall depth). For the electrical data, a paired t test was used to compare the subendocardial layer to the subepicardial layer. For both the mechanical and the electrical data, ordinary linear regression was used to obtain an unbiased estimate of the absolute value of the slope of wall depth as a function of the time from the surface ECG R-wave. Statistical significance was accepted at p < 0.05. Statistics were performed using SigmaStat 3.0 (SPSS, Inc., Chicago, Illinois).
Results
The site of fiber strain measurement was located 55 ± 18% of the distance from base to apex along the LV long axis, in a region of the anterior LV free wall 1 to 2 cm septal of the anterolateral papillary muscle. Mean wall thickness at the measurement site was 12 ± 3 mm. Hemodynamic parameters are summarized in Table 1.
Table 1.
Hemodynamic Parameters
| Parameter | Value |
|---|---|
| Cycle length (ms) | 632 ± 119 |
| LVPmax (mm Hg) | 100 ± 13 |
| dP/dtmax (mm Hg/s) | 2,187 ± 443 |
| dP/dtmin (mm Hg/s) | −2,082 ± 426 |
Values are mean ± SD (n = 14).
dP/dt = first derivative of pressure over time; dP/dtmax = peak positive dP/dt; dP/dtmin = peak negative dP/dt; LVPmax = maximum left ventricular pressure.
Fiber orientation
The transmural fiber orientation (Fig. 3) was consistent among all the animals studied. The mean fiber angles ranged approximately from −60° to +60° from epicardium to endocardium, respectively, resulting in a transmural gradient of approximately 120°.
Figure 3. Transmural Fiber Orientation.

Values are mean ± SD (n = 14). Fiber angles were measured with reference to the positive circumferential direction. Abbreviations as in Figure 1.
Myofiber mechanics
The onset of myofiber shortening typically occurred earlier in endocardium than epicardium (Fig. 4). The delay of myofiber shortening at epicardial layers resulted from a brief period of myofiber stretch (prestretch) that preceded myofiber shortening (Fig. 4A). Myofiber shortening (Fig. 5, open circles) started earliest at a subendocardial layer (90% wall depth, 6 ± 13 ms) and was progressively delayed toward the epicardium (p < 0.001 by RMANOVA). There was a significant transmural gradient in the onset of myofiber shortening (p = 0.003, 0% wall depth, 46 ± 42 ms vs. 90% wall depth by the paired t test). The mean TDShort was 39 ms. Linear regression of the onset of myofiber shortening at each depth indicates that the mean propagation velocity of myofiber shortening from endocardium to epicardium was 0.25 m/s (Fig. 6, open circles).
Figure 4. Time Course of Transmural Fiber Strains.

(A) Entire cardiac cycle. Different colors represent the percent wall depth from the epicardial surface. Open circles = onset of myofiber shortening; open squares = onset of myofiber relaxation. (B) A closer look at TDShort. (C) A closer look at TDRelax. AoP = central aortic pressure; ECG = electrocardiogram; LAP = left atrial pressure; LVP = left ventricular pressure; TDRelax = transmural dispersion of myofiber relaxation; TDShort = transmural dispersion of myofiber shortening.
Figure 5. Transmural Dispersion of Myofiber Mechanics.

Values are mean and error bars indicate SD (n = 14). Open circles = onset of myofiber shortening; open squares = onset of myofiber relaxation. Endo = endocardium; Epi = epicardium; TDRelax = transmural dispersion of myofiber relaxation; TDShort = transmural dispersion of myofiber shortening.
Figure 6. Electrical Activation and the Onset of Myofiber Shortening Versus Mean Wall Depth.

Open triangles = electrical activation (n = 4) mean value at each depth (mm); open circles = onset of myofiber shortening (n = 14) mean value at each depth (mm). Abbreviations as in Figure 1.
In contrast, the onset of myofiber relaxation typically occurred earlier in epicardium than endocardium (Fig. 4C). The onset of myofiber relaxation (Fig. 5, open squares) was earliest at a subepicardial layer (30% wall depth, 262 ± 48 ms) and was progressively delayed toward the endocardium (p = 0.004 by RMANOVA). There was a significant transmural gradient in the onset of myofiber relaxation (p < 0.001, 0% wall depth, 271 ± 65 ms vs. 90% wall depth, 345 ± 86 ms by the paired t test). The mean TDRelax was 83 ms. Linear regression of the onset of myofiber relaxation at each depth indicates that the mean propagation velocity of myofiber relaxation from epicardium to endocardium was 0.10 m/s (Fig. 7, open squares); however, the relationship was not as linear as that for myofiber shortening. Of note, a second peak of myofiber shortening was observed at several layers in 8 animals during diastolic filling that was smaller in magnitude than the initial peak shortening. This second peak is also observed in epicardial layers (0 to 50%) in Figure 4.
Figure 7. Electrical Repolarization and the Onset of Myofiber Relaxation Versus Mean Wall Depth.

Closed triangles = electrical repolarization (n = 4) mean value at each depth (mm); open squares = onset of myofiber shortening (n = 14) mean value at each depth (mm). Abbreviations as in Figure 1.
Bipolar electrical recordings
There was a significant transmural gradient in electrical activation (p = 0.035 by RMANOVA) (Fig. 6); activation at subepicardium was significantly delayed compared with that of subendocardium (p= 0.029 by the paired t test). Linear regression of electrical activation indicates that the mean electrical conduction velocity from endocardium to epicardium was 0.49 m/s (Fig. 6, open triangles). Electrical repolarization at subendocardial, midwall, and subepicardial layers was almost synchronous (227 ± 38, 225 ± 58, and 237 ± 41 ms, respectively), and there was no significant transmural gradient (p = NS by both RMANOVA and the paired t test) (Fig. 7, closed triangles).
Discussion
Although heterogeneity of the onset of shortening and relaxation between subendocardium and subepicardium has been studied (23–25), this is the first study to comprehensively examine the depth-dependent difference of myofiber mechanics in vivo. Our results demonstrate that myofiber mechanics are transmurally and temporally heterogeneous, and global events such as LV end-diastole and end-systole do not uniquely correlate with the regional myofiber mechanics at individual depths.
Transmural sequence of electrical activation and myofiber shortening
The mean electrical conduction velocity (0.49 m/s) (Fig. 6) was consistent with reported values for transmural conduction velocity (26,27). Because the transmural propagation velocity of myofiber shortening (0.25 m/s) was slower than the electrical conduction velocity (0.49 m/s), the electromechanical delay was longer in epicardium than in endocardium. This in vivo finding is contrary to derivations from finite element simulation (28) and in vitro studies (11). One explanation for this new observation is tissue tethering (23,29). Because myofibers are physically coupled, myofiber mechanics at one layer might induce complex interactions within and between the layers, alter loading conditions, and thus make epicardial myofibers shorten later than they would in vitro. Such tissue interactions can be seen in the relationship between the fiber and cross-fiber strains at epicardial and endocardial layers (Fig. 8). Overall, epicardial fiber strain (solid red line) and endocardial cross-fiber strain (broken green line) demonstrate a similar time course. Likewise, epicardial cross-fiber strain (broken red line) and endocardial fiber strain (solid green line) demonstrate a similar time course. During isovolumic periods, fiber and cross-fiber strains in the same layer were always in opposite directions. For example, during isovolumic contraction, the epicardial myocardium stretched in the fiber direction (blue arrow, solid red line), but shortened in the cross-fiber direction (orange arrow, broken red line). Similarly, during isovolumic relaxation, the endocardial myocardium shortened then stretched in the fiber direction (orange arrow, solid green line), while it stretched then shortened in the cross-fiber direction (blue arrow, broken green line). These findings are consistent with previous reports (23–25).
Figure 8. Transmural Tissue Coupling.

Red and green lines = strains in epicardial (0% wall depth) and endocardial (90% wall depth) layers, respectively. Solid and broken lines = fiber and cross-fiber strains, respectively. AoP = central aortic pressure; ECG = electrocardiogram; IVC = isovolumic contraction; IVR = isovolumic relaxation; LAP = left atrial pressure; LVP = left ventricular pressure.
Previous studies imply that the transmural sequence of the fiber mechanics of the apical and the basal regions of the anterior LV may be in the opposite directions (18,30). However, the piezoelectric crystal pairs in these studies were not placed directly along the fiber direction. Therefore, these studies did not specifically examine the time course of true fiber strains and are fundamentally different from our study.
Transmural sequence of electrical repolarization and myofiber relaxation
We found no significant transmural gradient of electrical repolarization in the mid-anterior LV in vivo, which is consistent with earlier studies in canine (9,19), swine (18), and human (10,31,32). el-Sherif et al. (33) found that activation-recovery interval in canines in vivo was significantly longer at midmyocardium than epicardium and endocardium at longer cycle lengths, but transmural gradient was not significant at the range of cycle length in our study (600 to 700 ms). Of note, we found that electrical repolarization was later in subepicardium than subendocardium (Fig. 6), although the difference was not significant. This finding, although contradictory to in vitro reports, has been previously documented (18,34).
Despite lack of significant transmural gradient in electrical repolarization in vivo, our data indicate that there is a significant gradient in the onset of myofiber relaxation, which is progressively delayed in endocardial layers. This transmural sequence of myofiber relaxation is consistent with the reported data from isolated canine LV myocytes (11). This mechanical relaxation sequence is clearly different from the electrical repolarization sequence and requires exploration of possible mechanisms.
One possible explanation is that TDRelax is a direct consequence of TDRepol; that is, transmural electrical repolarization sequence has a significant impact on mechanical relaxation of the ventricle. TDRepol may exist in vivo, and the reported lack of it may simply reflect technical difficulties associated with obtaining transmural electrical measurements. For example, Van Dam and Durrer (35,36) noted that the spatial and temporal sequence of repolarization cannot be adequately studied by measuring the steepest portion of the T-wave using either bipolar or unipolar electrodes, because repolarization occurs much more slowly and is of lower voltage than depolarization. To overcome this limitation, Spach and Barr (37) measured potential distributions in closed-chest canine in vivo and found that repolarization was earlier in epicardium than endocardium. This result was consistent with refractory period measurements of Burgess et al. (38).
Another explanation is that TDRelax results from mechanical interactions between each myofiber and its loading conditions. Myofiber relaxation in vivo is primarily determined by the balance between the loading conditions and generated force within the myofiber during diastole; myofiber relaxation occurs when the afterload overcomes the generated force of the myofiber. The delay of endocardial relaxation may be explained by the fact that the end-systolic fiber stress is highest at endocardium (28). Moreover, the transmural propagation velocity of myofiber relaxation was even smaller than that of myofiber shortening (0.10 vs. 0.25 m/s, respectively). This very slow transmural propagation velocity suggests that TDRelax may be of mechanical origin, rather than electrical. These possible explanations are not mutually exclusive, and both may be in effect, at least partially, to cause TDRelax in vivo.
Clinical implications
The present study highlights a gap in our clinical understanding of electromechanical sequence in a normal heart, which was uncovered by recent studies on cardiac resynchronization therapy (39,40). Our results are consistent with recent reports presenting similar shortening-relaxation kinematics of the epicardial and endocardial layers (18,23,25). Delayed onset of relaxation is routinely encountered as a physiologic phenomenon in normal humans and has been referred to as post-systolic shortening (41,42); experimental studies have confirmed endocardial shortening after aortic valve closure (18).
There has been a great clinical interest in the myocardial band hypothesis (43,44), which has important surgical implications. This controversial hypothesis (45) is criticized as being oversimplified and having no anatomic foundation (46), and our anatomic data also do not fit with this hypothesis. For example, the smooth transition of myofiber orientation from epicardium to endocardium in the mid-anterior LV (Fig. 3), which are consistent with a number of published data (13,47–50), does not support the concept that there are discrete ascending and descending segments of the myocardial band, which would likely produce a more sudden change of transmural myofiber orientation in the midwall.
Study limitations
Our measurements were restricted to the mid-anterior LV; thus, our findings may not be applicable to other LV regions. It is possible that our electrical and mechanical measurements may have been affected by anesthetics and epicardial cooling associated with open-chest preparations. Some of our findings may have been affected by the damage caused by the bead implantation (51). However, measurements from noninvasive techniques such as magnetic resonance imaging have shown similar transmural gradients in regional strains (52); thus, we believe that our technique does not substantially affect the local mechanics.
Conclusions
There is transmural dispersion in the onset of myofiber relaxation as well as shortening in vivo, despite lack of evidence of significant transmural gradient in electrical repolarization.
Acknowledgments
This study was supported by the following grants: AHA 0225001Y (to Dr. Ashikaga, Western States Affiliate), NHLBI R01-HL32583 (to Dr. Omens), and Z01-HL4004609 (to Dr. McVeigh). Frits W. Prinzen, MD, served as Guest Editor for this article.
The authors thank James W. Covell, MD, for excellent technical assistance and valuable discussions. The authors also thank their staff, Rish Pavelec, Rachel Alexander, and Katrina Go, for superb managerial and surgical assistance.
Abbreviations and Acronyms
- AoP
central aortic pressure
- ECG
electrocardiogram
- LA
left atrial
- LAD
left anterior descending coronary artery
- LAP
left atrial pressure
- LCx
left circumflex coronary artery
- LV
left ventricular
- LVP
left ventriclar pressure
- RMANOVA
repeated-measures analysis of variance
- TDRelax
transmural dispersion of myofiber relaxation
- TDRepol
transmural dispersion of repolarization
- TDShort
transmural dispersion of myofiber shortening
- 3-D
3-dimensional
References
- 1.Antzelevitch C. Cardiac repolarization. The long and short of it Europace. 2005;7(Suppl 2):3–9. doi: 10.1016/j.eupc.2005.05.010. [DOI] [PMC free article] [PubMed] [Google Scholar]
- 2.Antzelevitch C, Fish J. Electrical heterogeneity within the ventricular wall. Basic Res Cardiol. 2001;96:517–27. doi: 10.1007/s003950170002. [DOI] [PubMed] [Google Scholar]
- 3.Sicouri S, Antzelevitch C. A subpopulation of cells with unique electrophysiological properties in the deep subepicardium of the canine ventricle. The M cell Circ Res. 1991;68:1729–41. doi: 10.1161/01.res.68.6.1729. [DOI] [PubMed] [Google Scholar]
- 4.Antzelevitch C, Shimizu W, Yan GX, et al. The M cell: its contribution to the ECG and to normal and abnormal electrical function of the heart. J Cardiovasc Electrophysiol. 1999;10:1124–52. doi: 10.1111/j.1540-8167.1999.tb00287.x. [DOI] [PubMed] [Google Scholar]
- 5.Yan GX, Antzelevitch C. Cellular basis for the normal T wave and the electrocardiographic manifestations of the long-QT syndrome. Circulation. 1998;98:1928–36. doi: 10.1161/01.cir.98.18.1928. [DOI] [PubMed] [Google Scholar]
- 6.Yan GX, Antzelevitch C. Cellular basis for the Brugada syndrome and other mechanisms of arrhythmogenesis associated with ST-segment elevation. Circulation. 1999;100:1660–6. doi: 10.1161/01.cir.100.15.1660. [DOI] [PubMed] [Google Scholar]
- 7.Medina-Ravell VA, Lankipalli RS, Yan GX, et al. Effect of epicardial or biventricular pacing to prolong QT interval and increase transmural dispersion of repolarization: does resynchronization therapy pose a risk for patients predisposed to long QT or torsade de pointes? Circulation. 2003;107:740–6. doi: 10.1161/01.cir.0000048126.07819.37. [DOI] [PubMed] [Google Scholar]
- 8.Anyukhovsky EP, Sosunov EA, Gainullin RZ, Rosen MR. The controversial M cell. J Cardiovasc Electrophysiol. 1999;10:244–60. doi: 10.1111/j.1540-8167.1999.tb00667.x. [DOI] [PubMed] [Google Scholar]
- 9.Janse MJ, Sosunov EA, Coronel R, et al. Repolarization gradients in the canine left ventricle before and after induction of short-term cardiac memory. Circulation. 2005;112:1711–8. doi: 10.1161/CIRCULATIONAHA.104.516583. [DOI] [PubMed] [Google Scholar]
- 10.Taggart P, Sutton P, Opthof T, Coronel R, Kallis P. Electrotonic cancellation of transmural electrical gradients in the left ventricle in man. Prog Biophys Mol Biol. 2003;82:243–54. doi: 10.1016/s0079-6107(03)00025-7. [DOI] [PubMed] [Google Scholar]
- 11.Cordeiro JM, Greene L, Heilmann C, Antzelevitch D, Antzelevitch C. Transmural heterogeneity of calcium activity and mechanical function in the canine left ventricle. Am J Physiol Heart Circ Physiol. 2004;286:H1471–9. doi: 10.1152/ajpheart.00748.2003. [DOI] [PubMed] [Google Scholar]
- 12.Ashikaga H, Omens JH, Ingels NB, Jr, Covell JW. Transmural mechanics at left ventricular epicardial pacing site. Am J Physiol Heart Circ Physiol. 2004;286:H2401–7. doi: 10.1152/ajpheart.01013.2003. [DOI] [PMC free article] [PubMed] [Google Scholar]
- 13.Ashikaga H, Criscione JC, Omens JH, Covell JW, Ingels NB., Jr Transmural left ventricular mechanics underlying torsional recoil during relaxation. Am J Physiol Heart Circ Physiol. 2004;286:H640–7. doi: 10.1152/ajpheart.00575.2003. [DOI] [PMC free article] [PubMed] [Google Scholar]
- 14.Yoran C, Covell JW, Ross J., Jr Rapid fixation of the left ventricle: continuous angiographic and dynamic recordings. J Appl Physiol. 1973;35:155–7. doi: 10.1152/jappl.1973.35.1.155. [DOI] [PubMed] [Google Scholar]
- 15.Costa KD, Takayama Y, McCulloch AD, Covell JW. Laminar fiber architecture and three-dimensional systolic mechanics in canine ventricular myocardium. Am J Physiol. 1999;276:H595–607. doi: 10.1152/ajpheart.1999.276.2.H595. [DOI] [PubMed] [Google Scholar]
- 16.Takayama Y, Costa KD, Covell JW. Contribution of laminar myofiber architecture to load-dependent changes in mechanics of LV myocardium. Am J Physiol Heart Circ Physiol. 2002;282:H1510–20. doi: 10.1152/ajpheart.00261.2001. [DOI] [PubMed] [Google Scholar]
- 17.MacKay SA, Potel MJ, Rubin JM. Graphics methods for tracking three-dimensional heart wall motion. Comput Biomed Res. 1982;15:455–73. doi: 10.1016/0010-4809(82)90027-1. [DOI] [PubMed] [Google Scholar]
- 18.Sengupta PP, Khandheria BK, Korinek J, et al. Apex-to-base dispersion in regional timing of left ventricular shortening and lengthening. J Am Coll Cardiol. 2006;47:163–72. doi: 10.1016/j.jacc.2005.08.073. [DOI] [PubMed] [Google Scholar]
- 19.Anyukhovsky EP, Sosunov EA, Rosen MR. Regional differences in electrophysiological properties of epicardium, midmyocardium, and endocardium. In vitro and in vivo correlations. Circulation. 1996;94:1981–8. doi: 10.1161/01.cir.94.8.1981. [DOI] [PubMed] [Google Scholar]
- 20.Millar CK, Kralios FA, Lux RL. Correlation between refractory periods and activation-recovery intervals from electrograms: effects of rate and adrenergic interventions. Circulation. 1985;72:1372–9. doi: 10.1161/01.cir.72.6.1372. [DOI] [PubMed] [Google Scholar]
- 21.Haws CW, Lux RL. Correlation between in vivo transmembrane action potential durations and activation-recovery intervals from electrograms. Effects of interventions that alter repolarization time. Circulation. 1990;81:281–8. doi: 10.1161/01.cir.81.1.281. [DOI] [PubMed] [Google Scholar]
- 22.Cheng A, Langer F, Nguyen TC, et al. Transmural left ventricular shear strain alterations adjacent to and remote from infarcted myocardium. J Heart Valve Dis. 2006;15:209–18. [PubMed] [Google Scholar]
- 23.Sengupta PP, Khandheria BK, Korinek J, Wang J, Belohlavek M. Biphasic tissue Doppler waveforms during isovolumic phases are associated with asynchronous deformation of subendocardial and subepicardial layers. J Appl Physiol. 2005;99:1104–11. doi: 10.1152/japplphysiol.00191.2005. [DOI] [PubMed] [Google Scholar]
- 24.Goetz WA, Lansac E, Lim HS, Weber PA, Duran CM. Left ventricular endocardial longitudinal and transverse changes during isovolumic contraction and relaxation: a challenge. Am J Physiol Heart Circ Physiol. 2005;289:H196–201. doi: 10.1152/ajpheart.00867.2004. [DOI] [PubMed] [Google Scholar]
- 25.Remme EW, Lyseggen E, Nash MP, et al. Mechanism behind the velocity spike during isovolumic relaxation (abstr) Circulation. 2005;112:1361. [Google Scholar]
- 26.Poelzing S, Dikshteyn M, Rosenbaum DS. Transmural conduction is not a two-way street. J Cardiovasc Electrophysiol. 2005;16:455. doi: 10.1046/j.1540-8167.2005.40742.x. [DOI] [PubMed] [Google Scholar]
- 27.Poelzing S, Roth BJ, Rosenbaum DS. Optical measurements reveal nature of intercellular coupling across ventricular wall. Am J Physiol Heart Circ Physiol. 2005;289:H1428–35. doi: 10.1152/ajpheart.01245.2004. [DOI] [PubMed] [Google Scholar]
- 28.Guccione JM, Costa KD, McCulloch AD. Finite element stress analysis of left ventricular mechanics in the beating dog heart. J Biomech. 1995;28:1167–77. doi: 10.1016/0021-9290(94)00174-3. [DOI] [PubMed] [Google Scholar]
- 29.McCulloch AD, Sung D, Wilson JM, Pavelec RS, Omens JH. Flow-function relations during graded coronary occlusions in the dog: effects of transmural location and segment orientation. Cardiovasc Res. 1998;37:636–45. doi: 10.1016/s0008-6363(97)00290-3. [DOI] [PubMed] [Google Scholar]
- 30.Buckberg GD, Castella M, Gharib M, Saleh S. Active myocyte shortening during the ‘isovolumetric relaxation’ phase of diastole is responsible for ventricular suction; ‘systolic ventricular filling’. Eur J Cardiothorac Surg. 2006;29(Suppl 1):S98–106. doi: 10.1016/j.ejcts.2006.02.043. [DOI] [PubMed] [Google Scholar]
- 31.Chauhan VS, Downar E, Nanthakumar K, et al. Increased ventricular repolarization heterogeneity in patients with ventricular arrhythmia vulnerability and cardiomyopathy: a human in vivo study. Am J Physiol Heart Circ Physiol. 2006;290:H79–86. doi: 10.1152/ajpheart.00648.2005. [DOI] [PubMed] [Google Scholar]
- 32.Taggart P, Sutton PM. Cardiac mechano-electric feedback in man: clinical relevance. Prog Biophys Mol Biol. 1999;71:139–54. doi: 10.1016/s0079-6107(98)00039-x. [DOI] [PubMed] [Google Scholar]
- 33.el-Sherif N, Caref EB, Yin H, Restivo M. The electrophysiological mechanism of ventricular arrhythmias in the long QT syndrome. Tridimensional mapping of activation and recovery patterns. Circ Res. 1996;79:474–92. doi: 10.1161/01.res.79.3.474. [DOI] [PubMed] [Google Scholar]
- 34.Franz MR, Bargheer K, Rafflenbeul W, Haverich A, Lichtlen PR. Monophasic action potential mapping in human subjects with normal electrocardiograms: direct evidence for the genesis of the T wave. Circulation. 1987;75:379–86. doi: 10.1161/01.cir.75.2.379. [DOI] [PubMed] [Google Scholar]
- 35.van Dam RT, Durrer D. The T wave and ventricular repolarization. Am J Cardiol. 1964;14:294–300. doi: 10.1016/0002-9149(64)90071-2. [DOI] [PubMed] [Google Scholar]
- 36.van Dam RT, Durrer D. Experimental study on the intramural distribution of the excitability cycle and on the form of the epicardial T wave in the dog heart in situ. Am Heart J. 1961;61:537–42. doi: 10.1016/0002-8703(61)90554-3. [DOI] [PubMed] [Google Scholar]
- 37.Spach MS, Barr RC. Ventricular intramural and epicardial potential distributions during ventricular activation and repolarization in the intact dog. Circ Res. 1975;37:243–57. doi: 10.1161/01.res.37.2.243. [DOI] [PubMed] [Google Scholar]
- 38.Burgess MJ, Green LS, Millar K, Wyatt R, Abildskov JA. The sequence of normal ventricular recovery. Am Heart J. 1972;84:660–9. doi: 10.1016/0002-8703(72)90181-0. [DOI] [PubMed] [Google Scholar]
- 39.Leclercq C, Faris O, Tunin R, et al. Systolic improvement and mechanical resynchronization does not require electrical synchrony in the dilated failing heart with left bundle-branch block. Circulation. 2002;106:1760–3. doi: 10.1161/01.cir.0000035037.11968.5c. [DOI] [PubMed] [Google Scholar]
- 40.Faris OP, Evans FJ, Dick AJ, et al. Endocardial versus epicardial electrical synchrony during LV free-wall pacing. Am J Physiol Heart Circ Physiol. 2003;285:H1864–70. doi: 10.1152/ajpheart.00282.2003. [DOI] [PMC free article] [PubMed] [Google Scholar]
- 41.Voigt JU, Lindenmeier G, Exner B, et al. Incidence and characteristics of segmental postsystolic longitudinal shortening in normal, acutely ischemic, and scarred myocardium. J Am Soc Echocardiogr. 2003;16:415–23. doi: 10.1016/s0894-7317(03)00111-1. [DOI] [PubMed] [Google Scholar]
- 42.Zwanenburg JJ, Gotte MJ, Kuijer JP, Heethaar RM, van Rossum AC, Marcus JT. Timing of cardiac contraction in humans mapped by high-temporal-resolution MRI tagging: early onset and late peak of shortening in lateral wall. Am J Physiol Heart Circ Physiol. 2004;286:H1872–80. doi: 10.1152/ajpheart.01047.2003. [DOI] [PubMed] [Google Scholar]
- 43.Buckberg GD, Weisfeldt ML, Ballester M, et al. Left ventricular form and function: scientific priorities and strategic planning for development of new views of disease. Circulation. 2004;110:e333–6. doi: 10.1161/01.CIR.0000143625.56882.5C. [DOI] [PubMed] [Google Scholar]
- 44.Torrent-Guasp F, Kocica MJ, Corno AF, et al. Towards new understanding of the heart structure and function. Eur J Cardiothorac Surg. 2005;27:191–201. doi: 10.1016/j.ejcts.2004.11.026. [DOI] [PubMed] [Google Scholar]
- 45.von Segesser LK. The myocardial band: fiction or fact? Eur J Cardiothorac Surg. 2005;27:181–2. doi: 10.1016/j.ejcts.2004.12.006. [DOI] [PubMed] [Google Scholar]
- 46.Criscione JC, Rodriguez F, Miller DC. The myocardial band: simplicity can be a weakness. Eur J Cardiothorac Surg. 2005;28:363–4. doi: 10.1016/j.ejcts.2005.04.015. author reply 364–7. [DOI] [PubMed] [Google Scholar]
- 47.Streeter DD, Jr, Spotnitz HM, Patel DP, Ross J, Jr, Sonnenblick EH. Fiber orientation in the canine left ventricle during diastole and systole. Circ Res. 1969;24:339–47. doi: 10.1161/01.res.24.3.339. [DOI] [PubMed] [Google Scholar]
- 48.Costa KD, May-Newman K, Farr D, O’Dell WG, McCulloch AD, Omens JH. Three-dimensional residual strain in midanterior canine left ventricle. Am J Physiol. 1997;273:H1968–76. doi: 10.1152/ajpheart.1997.273.4.h1968. [DOI] [PMC free article] [PubMed] [Google Scholar]
- 49.LeGrice IJ, Smaill BH, Chai LZ, Edgar SG, Gavin JB, Hunter PJ. Laminar structure of the heart: ventricular myocyte arrangement and connective tissue architecture in the dog. Am J Physiol. 1995;269:H571–82. doi: 10.1152/ajpheart.1995.269.2.H571. [DOI] [PubMed] [Google Scholar]
- 50.Harrington KB, Rodriguez F, Cheng A, et al. Direct measurement of transmural laminar architecture in the anterolateral wall of the ovine left ventricle: new implications for wall thickening mechanics. Am J Physiol Heart Circ Physiol. 2005;288:H1324–30. doi: 10.1152/ajpheart.00813.2004. [DOI] [PMC free article] [PubMed] [Google Scholar]
- 51.Cheng A, Langer F, Rodriguez F, et al. Transmural cardiac strains in the lateral wall of the ovine left ventricle. Am J Physiol Heart Circ Physiol. 2005;288:H1546–56. doi: 10.1152/ajpheart.00716.2004. [DOI] [PubMed] [Google Scholar]
- 52.Bogaert J, Rademakers FE. Regional nonuniformity of normal adult human left ventricle. Am J Physiol Heart Circ Physiol. 2001;280:H610–20. doi: 10.1152/ajpheart.2001.280.2.H610. [DOI] [PubMed] [Google Scholar]