Abstract
New advances in catheter technology and remote actuation for minimally invasive procedures are continuously increasing the demand for better x-ray imaging technology. The new x-ray high-sensitivity Micro-Angiographic Fluoroscope (HS-MAF) detector offers high resolution and real-time image-guided capabilities which are unique when compared with commercially available detectors. This detector consists of a 300 μm CsI input phosphor coupled to a dual stage GEN2 micro-channel plate light image intensifier (LII), followed by minifying fiber-optic taper coupled to a CCD chip. The HS-MAF detector image array is 1024×1024 pixels, with a 12 bit depth capable of imaging at 30 frames per second. The detector has a round field of view with 4 cm diameter and 35 microns pixels. The LII has a large variable gain which allows usage of the detector at very low exposures characteristic of fluoroscopic ranges while maintaining very good image quality. The custom acquisition program allows real-time image display and data storage. We designed a set of in-vivo experimental interventions in which placement of specially designed endovascular stents were evaluated with the new detector and with a standard x-ray image intensifier (XII). Capabilities such fluoroscopy, angiography and ROI-CT reconstruction using rotational angiography data were implemented and verified. The images obtained during interventions under radiographic control with the HS-MAF detector were superior to those with the XII. In general, the device feature markers, the device structures, and the vessel geometry were better identified with the new detector. High-resolution detectors such as HS-MAF can vastly improve the accuracy of localization and tracking of devices such stents or catheters.
Keyword list: high-resolution fluoroscopy, cone-beam computed tomography, region-of-interest micro-angiography, ROI-CT, endovascular image-guided interventions, micro-angiographic fluoroscope
INTRODUCTION
Cardiovascular diseases (CVD), such as aneurysms or stenoses, conditions which may cause stroke, remain some of the most lethal diseases for developed countries. The data published by the National Center for Health Statistics1, 2 place CVD as the first cause of death in the US and stroke as the leading cause of long term disability: approximately 50% of survivors have a residual neurologic deficit and greater than 25% require chronic care2.
These very grim facts have triggered a continuous effort from the research community to develop novel tools and treatment methods as well as new imaging techniques for diagnosis and real-time guidance3–5. Endovascular x-ray image-guided interventions are some of the most used methods for CVD and stroke treatment, according to the data published by Rosamond et al. 2. In the US, over 1.3 million of such procedures have been performed in 2005, an increase of 342% in the last decade. In these interventions, the interventionalist navigates a catheter and an endovascular device to the vascular lesion location using x-ray image guidance. Endovascular procedures are done using devices (such as stents, balloons, coils, snare devices, etc.) which are manipulated using such catheters. The device sizes are of the order of millimeters with structure details smaller than 100 microns. Often these devices require sub-millimeter placement accuracy.
X-ray imaging detector resolution and sensitivity improvements can help endovascular device development which in turn could increase treatment success rates. Our group developed a new detector, designated as microangiographic (MA) detector6–9, with high resolution over a small field of view. The detector was mainly dedicated to diagnosis and evaluation of a treatment using low (4 frame per second) angiographic acquisition. The MA detector was tried in a clinical environment on a limited number of patients and demonstrated improved resolution over the standard C-arm mounted detectors. Details such as Neuroform stent structure placed in the Circle of Willis and small arterial branches were visible. However, the MA detector was not designed to be used for fluoroscopic guidance of the devices during the endovascular image-guided interventions (EIGIs). To enable both fluoroscopy and micro-angiography, a high sensitivity microangiographic fluoroscope (HS-MAF) was built. Measurements of the physical parameters derived using a cascade model analysis10 and in vitro measurements on phantoms11, 12 already have shown that the HS-MAF can bring significant image improvement in a small field of view. However, such measurements, although necessary, are not sufficient for implementation of the detector in a clinical setting. Before this can occur, we must evaluate the functioning of the entire system in in-vivo experiments where conditions are similar to those in the clinic.
The most used imaging techniques during EIGI’s, including fluoroscopy, subtracted fluoroscopy or roadmapping, digital angiography, digital subtracted angiography and rotational angiography, were implemented using the HS-MAF. We developed the software to implement all these imaging techniques and we verified them using the in-vivo studies. All the experiments were related to CVD treatments and included placement of stents in the cerebral vasculature and treatment of experimentally created aneurysms in rabbits.
MATERIAL AND METHODS
High Sensitivity Micro-Angiographic Fluoroscope Detector (HSMAF) and acquisition program
The detector as shown in Figure 1 consists of a 300 μm CsI input phosphor coupled to a dual stage GEN2 micro-channel plate light image intensifier (LII), followed by a minifying fiber optic taper coupled to a CCD chip. The HS-MAF detector image array is 1024×1024 pixels, with a 12 bit depth capable of imaging at 30 frames per second. The detector has a round field of view with 4 cm diameter and 35 microns pixels. The LII has a large variable gain which allows detector usage at very low exposures characteristic of fluoroscopic ranges while maintaining very good image quality. The detector is connected using a Camera Link connection to a National Instruments PCI-express frame grabber. The custom acquisition program allows real-time image display and data storage.
Figure 1.
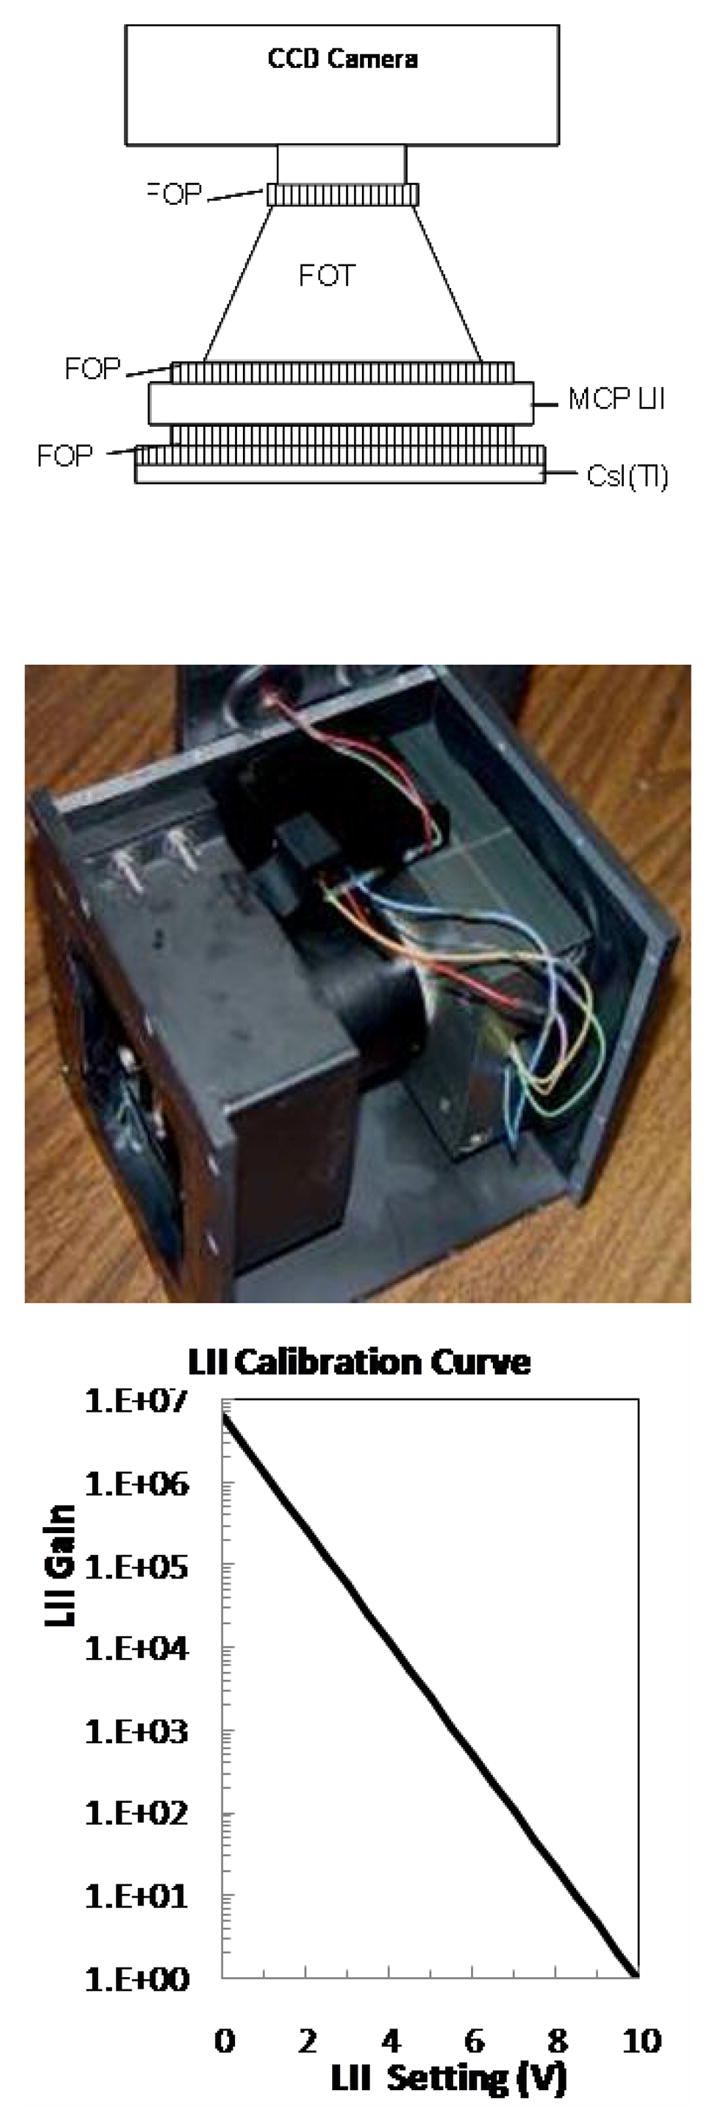
HSMAF detector: (top) schematic drawing, (center) actual detector, and (bottom) plot showing the LII calibration curve relating the gain to the LII setting.
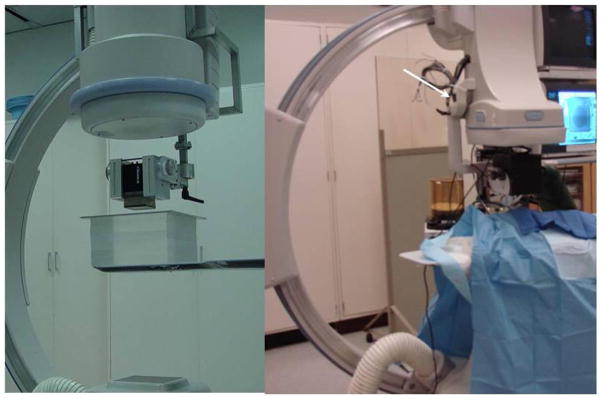
The detector is attached to a standard x-ray C-arm (Infinx, Toshiba Medical Systems, Tucson CA) using a special mechanical arm Figure 2. The detector has the same mechanical degrees of freedom as the image intensifier and can be brought in and out of the field of view whenever needed. The collimators are automatically adjusted to the active area of the HSAMF to limit the dose to the patient to a minimum. The collimator adjustment is done by using a switch attached to the HSMAF holder.
Figure 2.
Micro-Angiographic detector mounted on a standard C-Arm with XII (left) and HSMAF mounted with FP (right). The images acquired with the HSMAF detector are automatically displayed on a monitor adjacent to the flat panel monitors. The automatic collimation button (white arrow in the right image) is attached onto the HSMAF holder
Our group is also developing the program to control the camera, and the acquisition, processing and display of the data. In the current state, the program can acquire and display real-time fluoroscopy and roadmapping, high frame-rate angiography and rotational angiography. Data saving is done in real time using four hard disks in serial configuration. Details of the hardware control and the programming algorithm are given by Keleshis and al13.
The parameter presentation for each exam protocol includes [voltage kVp, tube current mA, exposure time per frame ms, LII gain] for the HSMAF and [voltage kVp, tube current mA, exposure time per frame ms] for the standard C-arm mounted flat-panel or image-intensifier detector.
Fluoroscopy and Fluoroscopic Roadmap
In-vivo EIGI’s were performed in three types of animal experiments: carotid stenting, stent navigation through stented arteries and treatment of elastase model aneurysms with novel methods. Identical EIGI procedures were done using two detectors: the HS-MAF and the standard C-arm detector: either the X-ray Image Intensifier XII or Flat Panel FP. The standard detector was used for the initial part of the procedure, in which the catheters are guided from the femoral artery to the upper circulatory system areas such as carotid, vertebral, basilar arteries, etc. For this part of the procedure, the small HS-MAF FOV is not adequate. Once the smaller arteries are reached, the C-arm detector is raised and the HS-MAF is brought into the field of view. The collimator adjustment is activated, and the automatic exposure parameter adjustment for the x-ray beam is deactivated. The kVp is kept the same while the current and the exposure time are approximately doubled. Between 10 and 30 seconds of fluoroscopy are taken manually to adjust the LII gain until the image is satisfactory. Once parameters are chosen, the procedure follows standard protocols.
For roadmap fluoroscopy, the program works similar to the commercial system. Sixty frames are acquired during iodine injection, and a mask is calculated. The next time the fluoroscopy pedal is pressed, the roadmap is displayed automatically for the interventionalists.
EIGI procedures followed a standard routine: the femoral artery was exposed, and a 6-French (Fr) introducer was inserted into the artery. A 6 Fr straight guiding catheter (Envoy, Cordis Endovascular Systems, Miami, FL) was advanced to the aortic arch using the C-arm mounted detector. In the case of carotid stenting, the guiding catheter was inserted first in the right carotid and, using a roadmap from the C-arm mounted detector, a stent was deployed at the end of the carotid in the area of the cerebral vasculature formation. The same procedure was then done on the left carotid using the HS-MAF so that the two detectors could be compared using the same animal.
Treatments were done on right-carotid aneurysms created using a well established method14, 15. In this method, the right carotid was exposed in the neck area. A 6 Fr introducer, and 6 FR guiding catheter was used to advance a compliant balloon and a micro-catheter to the area where the right carotid branches out of the sub-clavian artery. A compliant balloon was placed to block the right carotid entrance in the subclavian artery, and elastase was incubated in the blocked artery segment for twenty minutes. After the elastase and catheter were removed, the artery was occluded using a suture. The x-ray guidance of different aneurysm creation procedures was done with both detectors: HSMAF or the C-arm mounted, XII.
The aneurysms were kept three weeks to mature and then treated with a flow diverting stent developed by our group (Figure 3). A small area of a standard porous stent is covered by a low porosity surface making the stent appear asymmetric - thus the name for the device: Asymmetric Vascular Stent (AVS). Ideally, the device is deployed such that the low-porosity patch covers only the aneurysm neck. This special design, while ensuring strong flow diversion away from the aneurysm, maintains a low probability for occluding potentially critical perforating vessels. We attached a set of four platinum markers on the periphery of the low porosity patch to localize its position with regard to the aneurysm neck. For deployment, the stent is rotated until the patch is facing the aneurysm orifice, then the stent is deployed and the aneurysm orifice blocked (Figure 3). Ionita el al. 16 showed that, using the markers in the configuration shown in Figure 3, the stent can be placed with an accuracy of 6 degrees using a standard XII and 4 degrees when a microangiographic detector was used.
Figure 3.
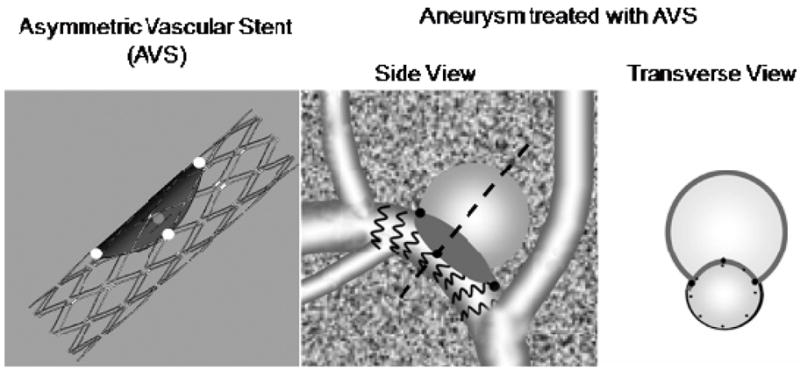
Asymmetric Vascular Stent (AVS), and schematics of aneurysm treatment with the AVS
For the HSMAF, the entire procedure occurs under roadmap fluoroscopy. The elastase aneurysm model in rabbits is located in an area surrounded by soft tissue; if the mask is acquired prior to the advancement of the catheter there will be misregistration between the mask and the new position of the vessel. Hence, the fluoroscopic roadmap is acquired with the stent catheter already in place, and the stent advanced distally to the aneurysm location to avoid mask misregistration when the stent is positioned over the aneurysm neck for deployment. The immediate treatment verification was done by DSA sequence analysis which is described below. However, for the C-arm mounted detector the alignment was done in two steps. The first part was gross alignment of the patch using roadmap fluoroscopy, and the final finer alignment was done using low frame-rate digital angiography. Only using high exposure, specific to angiography, could we verify the exact orientation of the patch.
Digital Angiography (DA) and Digital Subtracted Angiography (DSA)
The procedure also requires manual control over the x-ray parameters. The kVp was kept the same while the mAs was quadrupled by adjusting the mA and the exposure per frame. Since the benefits of the digital micro-angiography have been discussed in detail elsewhere by our group8, 9, we will focus on matters that concern data display and real-time storage. Angiograms of the brain vasculature in rabbits were acquired at 15 and 30 frames per second. During the experiments we validated the HS-MAF system capability to acquire high-frame-rate angiographic images and also display the information in real time. Transition between different imaging procedure such as DA, DSA and fluoroscopy was verified and improved to be comparable with the current C-arm system performance.
Rotational Angiography and Region-of-Interest Cone-Beam Computed Tomography (ROI-CT)
Rotational angiography was done in the carotid stenting case. After the stent was placed, rotational DA was performed using the standard C-arm. Second, the HSMAF detector was inserted and the system was set for manual control of the x-ray parameters. Vertical and lateral projections were acquired to verify that the object of interest (stent) is close to the iso-center. X-ray parameters were adjusted to avoid saturation during the acquisition.
For cone-beam CT, if only the ROI data were reconstructed, severe truncation artifacts could result. Thus, full-field-of-view (FFOV) data was acquired at low dose to supply the data outside the ROI17, 18. FFOV data were acquired using the lower resolution, noisier FPD. The FOV for the FPD was 8 in. and for the HSMAF was approximately 1.4 in. Both the datasets were acquired using standard rotational-DSA settings, which assured that data for FFOV and ROI were acquired at the same angle.
Once FFOV and ROI datasets, were acquired, the ROI data had to be properly replaced within the FFOV. First, the FFOV projections were expanded to match pixel sizes with the HSMAF. Since the FFOV and ROI data was acquired at different SIDs, FFOV projections were also adjusted for the differences in geometric magnification. Then, the ROI data was translated in both, x- (horizontal) and y- (vertical) directions to obtain data overlap. Cross-correlation coefficients at each step were calculated. Maximum correlation coefficient gave the co-ordinates where the ROI data matched the FFOV data. Since, the FFOV data was acquired at lower dose compared to the ROI data, the intensities were lower. Thus, intensity matching was also performed. A plot of FFOV pixel intensities vs. corresponding ROI pixel intensities was generated, the data were then fit using linear regression, and a linear equation was computed. This relation was used to equalize pixel intensities so that the data within the ROI could be placed within the FFOV projection. The entire process was repeated for all projections.
The projections were reconstructed in a 512 × 512 × 512 volume with voxel size of 50 microns. The projections were filtered using a standard Shepp-Logan filter. Finally, the data was back-projected using Parker weights for CBCT, as shown by Gullberg and Zeng19, and a Feldkamp-based algorithm20
RESULTS
Fluoroscopy and Fluoroscopic Roadmap
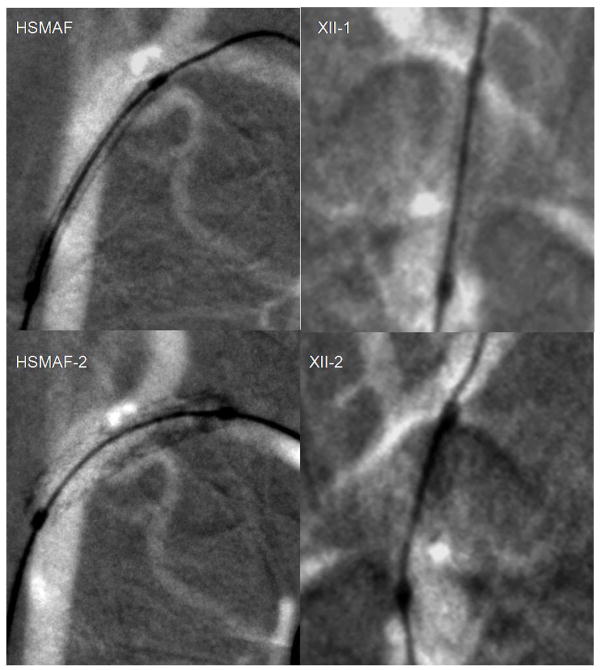
In Figure 4 we show stent deployment in a rabbit’s carotids arteries just before the Circle of Willis using fluoroscopic roadmapping with both detectors. For the x-ray imaging parameters, we kept the same kVp and mA, but the exposure time was 3 ms for the II and 6 ms for the HSMAF. The acquisition was done at 15frames/second. The stent structure after deployment is only visible in the images obtained with the HSMAF. The stent struts can be localized with great accuracy with regard to the adjacent vasculature. The fluoroscopic x-ray parameters during acquisition were [80 kVp, 100 mA, 6 ms, 5 V] for the HSMAF and [80 kVp, 50 mA, 3 ms] for the XII.
Figure 4.
Placement of a coronary stent using fluoroscopic roadmaping: left column HSMAF, right column XII. The first picture was acquired before stent deployment and the second picture was acquired after stent deployment
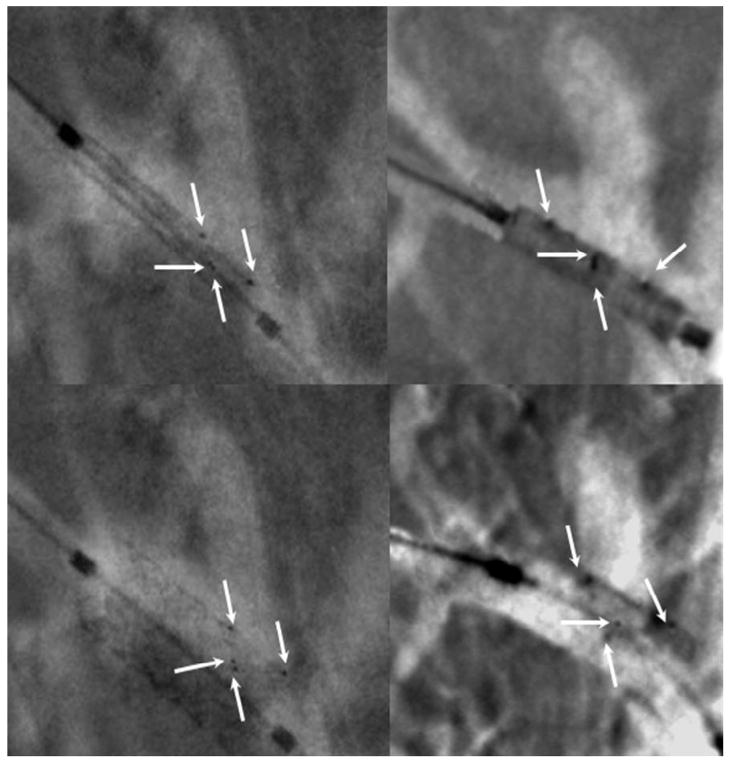
The next comparison (Figure 5) shows the aneurysm rabbit model treated with the AVS. The white arrows indicate the platinum markers. The markers configuration was chosen to indicate uniquely the patch position with regard to the aneurysm orifice. The markers are quite visible using both detectors; however, the HSMAF’s high resolution allows a faster alignment and more precise localization.
Figure 5.
Alignment of the AVS with regard to the aneurysm neck. The white arrows indicate the four platinum markers. On left column we show the images acquired using the HS-MAF and on the right column those acquired with the standard II. In the top row the stent is undeployed, in the bottom row images the stent is deployed
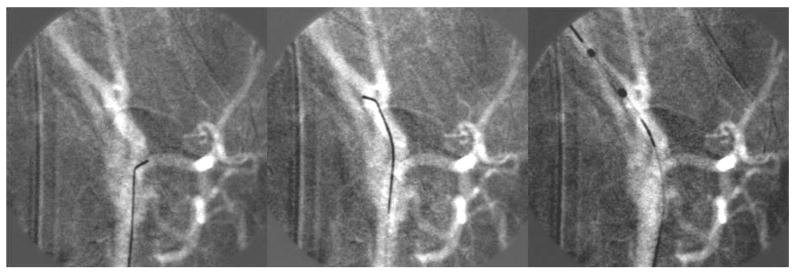
Figure 6 shows three images taken during a stenting procedure in a rabbit brain using the fluoroscopic roadmap guidance. The device was a balloon deployed coronary stent (1 mm undeployed, 2.5 mm deployed). In the first two sequences, the micro-wire is advanced to access the chosen artery than the stent is advanced using the micro-wire as support. Brighter area in the fluoroscopic map indicates curves and twists in the vasculature. Such variations facilitate navigation of the wire by orienting the tip accordingly.
Figure 6.
Sequence of images showing stent navigation into the brain vasculature. Tone variations in the roadmap are used to orient the micro-wire tip to advance further in the brain
Digital Angiography (DA) and Digital Subtracted Angiography (DSA)
Angiographic runs of the cerebral vasculature of the rabbits are shown in Figure 7; the angiograms were acquired while inserting the catheter in the right carotid artery. The transition between fluoroscopy and angiography was done using the same graphical user interface (GUI) and reducing the LII gain by about one order of magnitude. Acquisitions were obtained at 15 to 30 frames/second. The HSMAF images were substantially better quality than those from the XII especially when dealing with closely located vessels or small branches.
Figure 7.
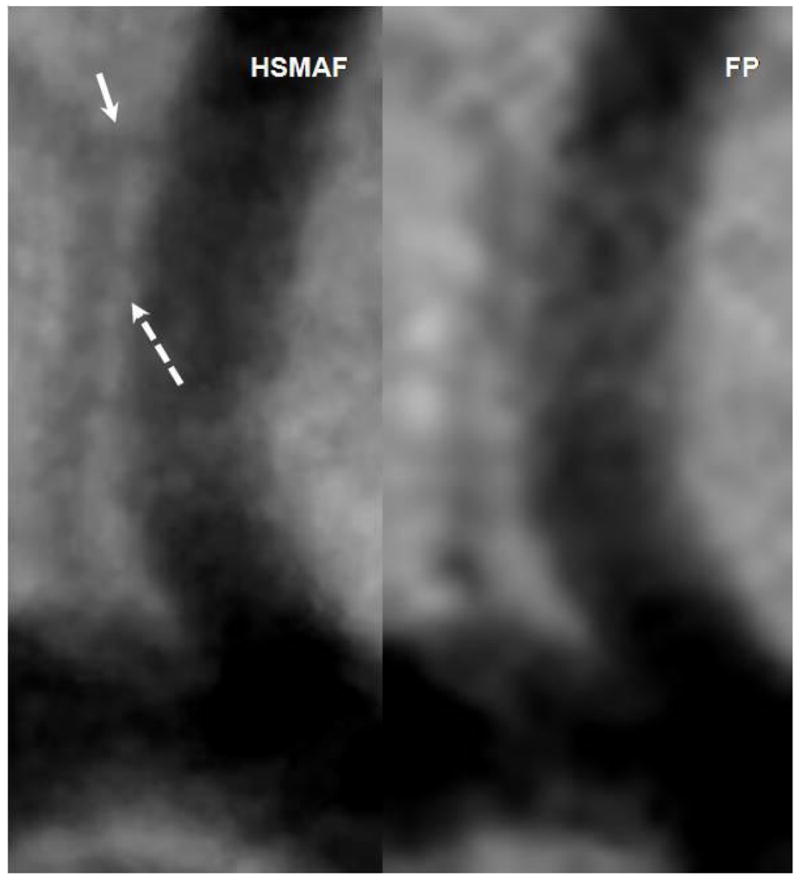
Images acquired with the HSMAF and FP of the brain vasculature in rabbits. Solid arrow indicates a small branch not visible in the FP DSA. Dotted arrow indicates real separation between the two arteries visible in the HSMAF DSA but not in the FP.
For comparison purposes, we show in Figure 7 two images of a small region in DSA images taken with both detectors over the same area in a rabbit neuro-vasculature. We focused on two vessels - one major with a diameter of about 3 mm and a small vessel of about 0.2 mm diameter parallel to the larger one. The small adjacent vessels are well delimited in the HSMAF DSA, while in the FP they seem to be connected. Also, at the location indicated with the solid arrow, the small vessel branches into two. This detail is visible on the HSMAF run but not in the FP.
Rotational Angiography and Region-of-Interest Cone Beam Computed Tomography (ROI-CT)
The x-ray parameters were [86 kVp, 50 mA, 6.3 ms, 5 V] for the HSMAF and [86 kVp, 80 mA, 12.5 ms] for the FP. The images of the projections were calibrated and fused. The result of the fused images is shown in Figure 8. The low-dose, low- resolution image acquired with the FP was fused with the high- dose, high-resolution image acquired with the HSMAF.
Figure 8.
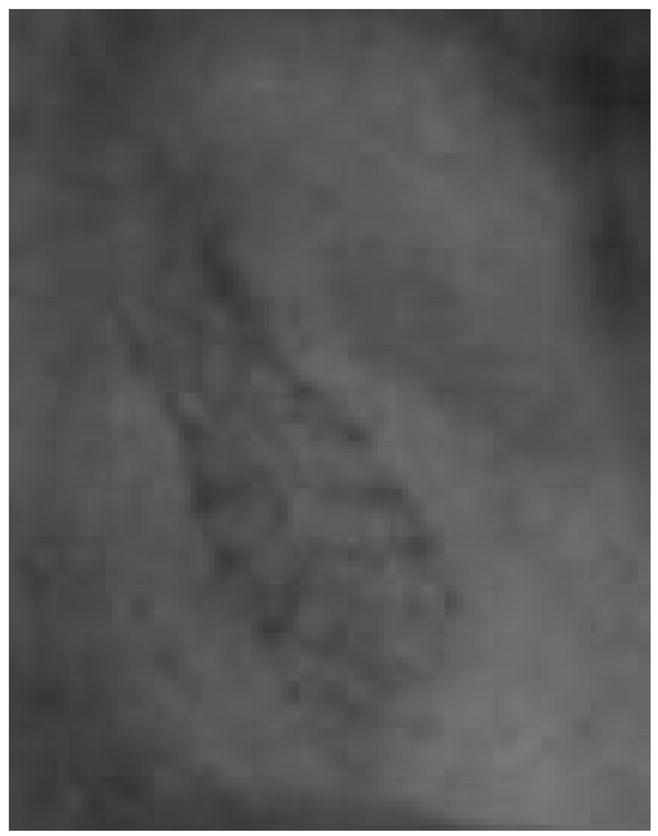
High-resolution region acquired with HSMAF fused into a low-resolution, low-dose FP projection.
The results of the CBCT using the fused images are shown in Figure 9. The left columns show CT slices in which the stents struts are well depicted. In the right side of Figure 9, we show the 3D rendering of the stent; the bone adjacent to the stent was removed and only the stent structure is displayed. Some severe metal artifacts are caused by the life-supporting and monitoring devices.
Figure 9.
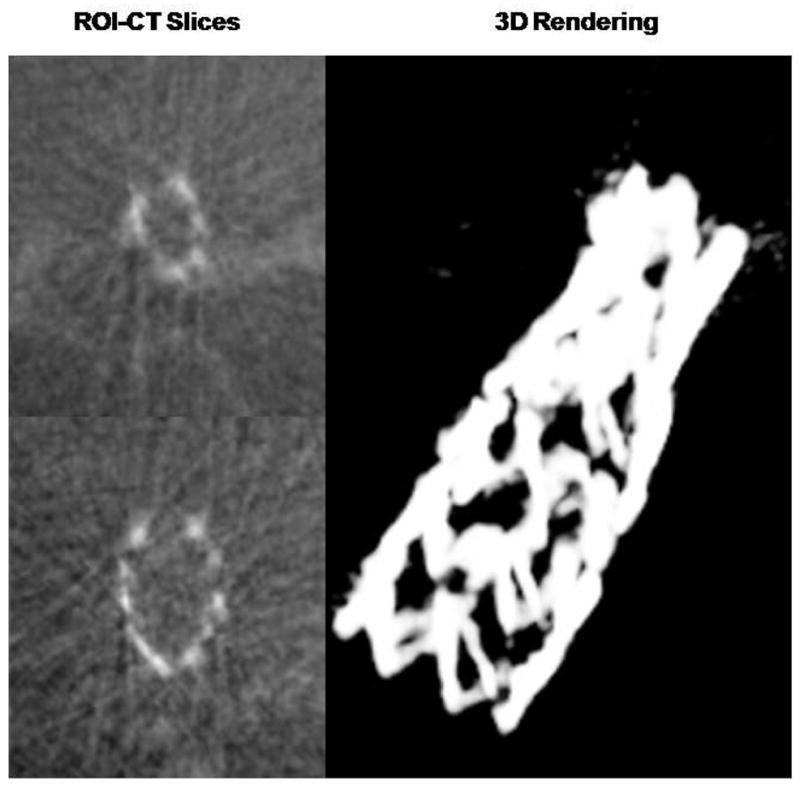
ROI-CT slices at two different levels and a 3D rendering showing the full stent in the rabbit brain vasculature. The projection data was acquired using both the HSMAF and the FP as indicated in Figure 8
DISCUSSION
We have done many interventions which include placement of stents in the upper circulatory system close to Circle of Willis, treatment of experimentally created aneurysms with novel devices such as the AVS, navigation of the devices in difficult situations such as tortuous vessels or through other devices already in place. The HSMAF detector functioned successfully during the in-vivo animal model EIGI’s. The HSMAF control software has undergone multiple changes, mostly concerned with data handling optimization. Post processing and data storage are done in real time without the addition of delays to the endovascular procedures. The hardware details and the algorithms for data handling are shown in an accompanying work by Keleshis et al13.
The standard C-arm mounted detector is sufficient for guidance over a large field of view when the catheter is advanced through large arteries such as the aorta, the aortic arch or even the lower carotid of the animal model. HSMAF usage at this procedure stage is most often not required. When the catheters are inserted into the cerebro-vascular region, the HS-MAF can be quite beneficial. The high-resolution capability facilitates guide-wire tip localization with regard to the adjacent vessels. Also some of the improvements are subtle and difficult to quantify. During roadmap fluoroscopy, vessel turns in or out of the viewing plane were easily identified as brighter areas of the vessel. This observation can help during the navigation of the guiding micro-wire, by orienting the pre-shaped tip in the appropriate direction. These benefits can shorten the access time to the desired vessel branch especially when dealing with a very dense vasculature.
Current technology does not easily allow retrieval of a stent once deployed without high risk of vessel injury. For this reason, when comparing images using the different detectors of stent deployment procedures for this study, it was necessary to deploy devices of the same design in either different vessels of the same animal or the same type of vessel in different animals of the same type.
Results indicate that high quality visualization of the stents under direct or roadmap fluoroscopy is possible only with the HSMAF. The standard C-arm mounted detector allowed visualization of the entire device but not of its internal structure. As procedures such as double stent bypass of the aneurysm orifice or Y stenting techniques for the bifurcation aneurysms are becoming widely used, knowledge of the stent structure with regard to the vessel geometry becomes very important. In thess delicate situations, the HSMAF can make an important contribution.
Digital angiography confirmed our previous data7–9, namely that better resolution can bring better measurements of the vessel geometry. Precise vessel dimension measurement is important in accurately choosing the device size for an intervention. Inaccurate size selection can cause irremediable damage to the vessel wall and complications such as: hemorrhages, vasospasms or in-stent re-stenosis. Also in light of the new advancements in EIGI research, the high resolution DSA images can help in the development of computerized data analysis such as in catheter advancement simulations, computational fluid dynamics calculations based on patient specific geometry or even in treatment planning using patient specific devices.
We demonstrated the first ROI-CT data of a stent implanted in-vivo. The structure of the stent could be identified well. This feature of the new system may bring significant improvement in the ability of interventionalists to plan and conduct EIGIs.
The geometry of the C-arm and the patient table currently used in this study did not allow optimal usage of the HS-MAF. Ideally, to minimize geometric unsharpness, the detector should be kept as close to the patient as possible without risk of collision; however, in the present set-up, only one non-optimal source-to-detector distance and one isocenter to detector distance were allowable. A reduced distance from the detector to the patient should enable substantially greater utilization of the high-resolution capabilities of the HSMAF.
CONCLUSION
This first comprehensive in-vivo study indicates that the new HSMAF system is moving closer to final implementation in a hospital angiographic suite. These first in-vivo tests have shown that the new detector and imaging system are capable of performing all the standard angiographic and fluoroscopic modes including DA, DSA, digital fluoroscopy, roadmapping, rotational DSA, and even ROI-CT. The HSMAF ROI-CT images were obtained in combination with an actual commercial C-arm system used in clinical angiographic suites providing the benefit of improved spatial resolution in an ROI where an intervention is occurring. Implementation of such a system could bring substantial benefits for the treatment of cerebrovascular disease and also potentially increase the motivation to develop improved and more effective endovascular devices.
Acknowledgments
Partial support for this work was provided by NIH grants R01 EB002873, R01 NS43924, and R01 EB02916; an equipment grant from Toshiba Medical Systems Corp., and stents from Guidant Corp. (currently Abbott Vascular).
References
- 1.U.S. Department of Health and Human Services. Summary Health Statistics for US Adults: National Health Interview Survey, 2005. 2006;10 [Google Scholar]
- 2.Rosamond W, Flegal K, Furie K, Go A, Greenlund K, Haase N, Hailpern SM, Ho M, Howard V, Kissela B, Kittner S, Lloyd-Jones D, McDermott M, Meigs J, Moy C, Nichol G, O’Donnell C, Roger V, Sorlie P, Steinberger J, Thom T, Wilson M, Hong Y. Heart Disease and Stroke Statistics 2008 Update. A Report From the American Heart Association Statistics Committee and Stroke Statistics Subcommittee. Circulation. 2007:e2–e122. doi: 10.1161/CIRCULATIONAHA.107.187998. [DOI] [PubMed] [Google Scholar]
- 3.Rudin S, Bednarek DR, Hoffmann KR. Endovascular image-guided interventions (EIGIs) Medical Physics. 2008;35:301–309. doi: 10.1118/1.2821702. [DOI] [PMC free article] [PubMed] [Google Scholar]
- 4.Guterman LR, Jenkins JA, Borchers DJ, Rodriguez R, Hopkins LN. Vascular neurosurgery: Aneurysms, arteriovenous malformations, subarachnoid hemorrhage, and intracranial hemorrhage. Current Opinion in Neurology. 1996;9:57–61. [PubMed] [Google Scholar]
- 5.Guterman LR, Standard SC, Ahuja A, Hopkins LN. Vascular and Endovascular Neurosurgery. Current Opinion in Neurology. 1993;6:854–859. doi: 10.1097/00019052-199312000-00005. [DOI] [PubMed] [Google Scholar]
- 6.Ganguly A, Rudin S, Bednarek DR, Hoffmann KR. Micro-angiography for neuro-vascular imaging. II. Cascade model analysis. Medical Physics. 2003;30:3029–3039. doi: 10.1118/1.1617550. [DOI] [PubMed] [Google Scholar]
- 7.Ganguly A, Rudin S, Bednarek DR, Hoffmann KR, Kyprianou IS. Micro-angiography for neuro-vascular imaging. I. Experimental evaluation and feasibility. Medical Physics. 2003;30:3018–3028. doi: 10.1118/1.1617549. [DOI] [PubMed] [Google Scholar]
- 8.Kyprianou I, Rudin S, Ionita C, Wu Y, Bednarek D, Ganguly A. A high-resolution rapid-sequence imaging system for region of interest micro-angiography. Medical Physics. 2002;29:1355–1355. [Google Scholar]
- 9.Kyprianou I, Rudin S, Wang Z, Ionita C, Bednarek DR, Nemes B. Advances and implementation of the region of interest micro-angiographic imaging system. Medical Physics. 2003;30:1423–1423. [Google Scholar]
- 10.Yadava GK, Rudin S, Kuhls-Gilcrist AT, Daniel RB. Generalized objective performance assessment of a new high-sensitivity microangiographic fluoroscopic (HSMAF) imaging system. Proc SPIE. 2008 doi: 10.1117/12.769808. [DOI] [PMC free article] [PubMed] [Google Scholar]
- 11.Rudin S, Kuhls AT, Yadava GK, Josan GC, Wu Y, Chityala RN, Rangwala HS, Ionita CN, Hoffmann KR, Bednarek DR. New light-amplifier-based detector designs for high spatial resolution and high sensitivity CBCT mammography and fluoroscopy. Proc SPIE. 2006;6142:61421R. doi: 10.1117/12.649501. [DOI] [PMC free article] [PubMed] [Google Scholar]
- 12.Rudin S, Wu Y, Kyprianou IS, Ionita CN, Wang Z, Ganguly A, Bednarek DR. Micro-angiographic detector with fluoroscopic capability. Proc SPIE. 2002;4682:344–354. [Google Scholar]
- 13.Keleshis CM, Ionita CN, Yadava GK, Bednarek DR, Hoffmann KRAV, Rudin S. LabVIEW graphical user interface for a new high sensitivity, high resolution micro-angio-fluoroscopic system. Proc SPIE. 2008:6913. doi: 10.1117/12.769630. [DOI] [PMC free article] [PubMed] [Google Scholar]
- 14.Altes TA, Cloft HJ, Short JG, DeGast A, Do HM, Helm GA, Kallmes DF. Creation of saccular aneurysms in the rabbit: A model suitable for testing endovascular devices. American Journal of Roentgenology. 2000;174:349–354. doi: 10.2214/ajr.174.2.1740349. [DOI] [PubMed] [Google Scholar]
- 15.Krings T, Hans FJ, Moller-Hartmann W, Brunn A, Thiex R, Schmitz-Rode T, Verken P, Scherer K, Dreeskamp H, Stein KP, Gilsbach JM, Thron A. Treatment of experimentally induced aneurysms with stents. Neurosurgery. 2005;56:1347–1359. doi: 10.1227/01.neu.0000159887.03290.d1. [DOI] [PubMed] [Google Scholar]
- 16.Ionita CN, Rudin S, Hoffmann KR, Bednarek DR. Microangiographic image-guided localization of a new asymmetric stent for treatment of cerebral aneurysms. Proc SPIE. 2005;5744:354–365. doi: 10.1117/12.594789. [DOI] [PMC free article] [PubMed] [Google Scholar]
- 17.Chityala R, Hoffmann K, Rudin S, Bednarek D. Region-of-interest (ROI) computed tomography: Combining dual resolution XRII images. Medical Physics. 2005;32:2056–2056. [Google Scholar]
- 18.Chen L, Shaw CC, Altunbas MC, Lai C, Ding X, Liu X. Dose Saving and Scatter Reduction in Dual-resolution Cone Beam CT Breast Imaging: A Monte Carlo Simulation Study. RSNA. 2007;451 [Google Scholar]
- 19.Gullberg GT, Zeng GL. A Cone-Beam Filtered Backprojection Reconstruction Algorithm for Cardiac Single Photon-Emission Computed-Tomography. IEEE Transactions on Medical Imaging. 1992;11:91–101. doi: 10.1109/42.126915. [DOI] [PubMed] [Google Scholar]
- 20.Feldkamp LA, Davis LC, Kress JW. Practical Cone-Beam Algorithm. Journal of the Optical Society of America a-Optics Image Science and Vision. 1984;1:612–619. [Google Scholar]


