Abstract
In this study, we compare the results obtained from Time-Density Curve (TDC) analysis of angiographic imaging sequences with histological evaluation for a rabbit aneurysm model treated with standard stents and new asymmetric vascular stents (AVS) placed by image-guided endovascular deployment. AVSs are stents having a low-porosity patch region designed to cover the aneurysm neck and occlude blood flow inside. To evaluate the AVSs, rabbits with elastase-induced aneurysm models (n=20) were divided into three groups: the first (n=10) was treated with an AVS, the second (n=5) with a non-patch standard coronary stent, and third was untreated as a control (n=5). We used TDC analysis to measure how much contrast media entered the aneurysm before and after treatment. TDCs track contrast-media-density changes as a function of time over the region of interest in x-ray DSA cine-sequences. After 28 days, the animals were sacrificed and the explanted specimens were histologically evaluated. The first group showed an average reduction of contrast flow into the aneurysm of 95% after treatment with an AVS with fully developed thrombus at 28 days follow-up. The rabbits treated with standard stents showed an increase in TDC residency time after treatment and partial-thrombogenesis. The untreated control aneurysms displayed no reduction in flow and were still patent at follow-up. The quantitative TDC analysis findings were confirmed by histological evaluation suggesting that the new AVS has great potential as a definitive treatment for cerebro-vascular aneurysms and that angiographic TDC analysis can provide in-vivo verification.
Keywords: asymmetric vascular stent, angiographic time-density curves, histology, elastase rabbit model
1. INTRODUCTION
Several endovascular research groups have studied the treatment of intracranial aneurysms using commercially available stents. The treatment of aneurysms using stents assumes that controlling the blood flow inside the aneurysm can induce thrombus formation processes1 and hence result in future healing of the aneurysm. Various in-vivo and in-vitro studies using commercial stents in treatment of aneurysms have been reported in the literature showing that this treatment did not attain the desired reproducibility2–4. Based on the same treatment philosophy, our group has been developing a new type of stent designated the asymmetric vascular stent or AVS in order to overcome the drawbacks of the standard stents. In-vitro angiographic5,6 and particle image velocimetry7 studies as well as computational fluid dynamics8,9 studies of our prototype AVS indicate radical changes in flow inside aneurysms, drastic reduction of iodine contrast in the aneurysm dome as well as prolonged contrast presence in the aneurysm dome after injection. In-vivo studies were done using a canine model so far10.
Before potential clinical application of these new stent designs is possible, in vivo testing in an animal aneurysm model is warranted. Also prior to clinical application in the future, computer fluid dynamics (CFD) calculations11 should be beneficial.
The purpose of this study is to compare the function of the new asymmetric vascular stents (AVS) with that of standard stents in an in-vivo rabbit aneurysm model using Time-Density Curve (TDC) analysis derived from angiographic imaging sequences as well as using histological analysis.
2. METHODOLOGY
2.1 AVS prototype
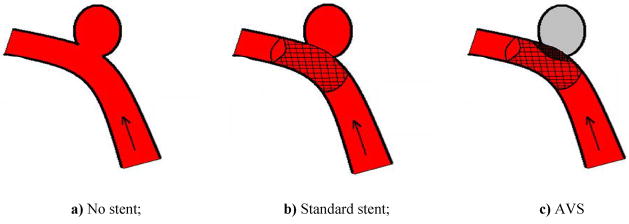
Aneurysms are bulges in vessels (Fig. 1a). Treatment relies on controlling blood flow into the aneurysm1 inducing thrombogenesis (clot formation) leading to subsequent healing of the aneurysm. Standard stents (Fig. 1b) are insufficient for this task of reducing flow into the aneurysm2–4 and hence the rationale for the asymmetric vascular stent (AVS).
Figure 1.
Vessel with aneurysm (arrow indicates flowing blood)
Asymmetric Vascular Stents (AVS) are endovascular devices similar to standard stents (Fig. 2a) but having a low-porosity region that is designed to cover the aneurysm neck and occlude blood flow into the aneurysm (Fig. 1c). For our study, this region was made by laser micro-welding a high-density stainless steel mesh patch onto a standard stent (Fig. 2b).
Figure 2.
a) Standard coronary stent; b) AVS with steel mesh patch; c) Platinum markers (white arrows) on patch
For the x-ray visualization of patch position inside the patient’s vessel the AVS stent is also marked (Fig. 2c) using platinum markers (Ø=100 μm) prior to being attached to a delivery catheter. After the patch is welded, the stent is crimped onto a commercially available balloon tipped 6-Fr catheter (Penta, Guidant Corp., now Abbott Vascular, Santa Clara, CA) for subsequent deployment. The AVS is advanced to the aneurysm location under real time x-ray fluoroscopic guidance using a guide wire as support for the catheter (Synchro-14, Boston Scientific, Mountain View, CA). By using a fluoroscopic roadmap overlay and observing the markers, the stent is positioned so that the patch is accurately aligned with the aneurysm orifice. Once in place, the AVS is deployed by inflating the balloon. After balloon deflation the catheter is removed.
2.2 Rabbit aneurysm model
To evaluate the AVSs, we used an elastase-induced rabbit aneurysm model created on the curved portion of the sub-clavian vessel. It is known from the literature12 that this model exhibits inertial flow into the aneurysm, being a good geometric and blood-flow type representation of human clinical cases. Although only one aneurysm per rabbit can be created and the amount of iodinated contrast media that can be injected is limited by the size of animal, the rabbit model was preferred over a canine model which uses a straight parent vessel and where the blood flow into the aneurysm is shear driven.
Detailed aneurysm creation procedures have been described in the literature12. Creation of the rabbit aneurysm model used here relies on an elastase incubation technique. Elastase is an enzyme that breaks down proteins; in our case this protein is elastin, an elastic fiber that, together with collagen, determines the mechanical properties of connective tissue found in the blood vessel walls. First, the right carotid (RC) (Fig. 3) is blocked using a compliant balloon. Then elastase is incubated intra-arterially for 20 minutes in a small segment of the right carotid 2 cm above the right sub-clavian (RSC) in order to weaken the vessel wall of the RC and facilitate the formation of the aneurysm. Once the incubation time has passed, the vessel above this region is isolated by tying it off. After a three-week aneurysm maturation period, we performed a treatment with either the AVS or standard stents.
Figure 3.
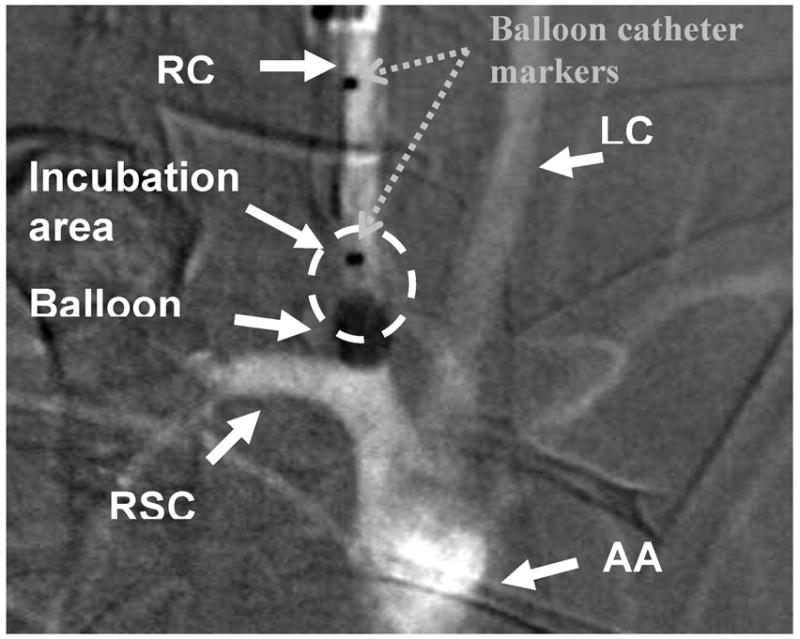
Unsubtracted angiographic image of aortic arch of a rabbit including adjacent vessels
RC- right carotid; LC- left carotid; RSC- right sub-clavian; AA- aortic arch
For our study, we used a total of 20 rabbits. The animals were divided into three groups. The first group was treated with an AVS (10 rabbits), the second group was treated with standard coronary stents (non-patch) (5 rabbits), and the third was an untreated control group (5 rabbits). In the first two groups, the stents were deployed at the desired location under fluoroscopic guidance and subsequent high-frame-rate angiography sequences were acquired to observe the flow modifications. After 28 days, the animals were sacrificed and the explanted aneurysm specimens were histologically evaluated.
2.3 Image Data Acquisition
The angiographic runs were acquired for all rabbits in our study with a Toshiba Model Infinix X-ray C-arm at a high-frame acquisition rate of 15 frames/sec, using the 5-inch II magnification mode, automatic exposure control (AEC), and 1024×1024 pixel images with 12 bits gray level. The gantry position and imaging geometry was maintained fixed for the same rabbit for all runs after the best view of the aneurysm was found. The iodinated contrast media injected was a 50/50 mixture of Optyray ® with saline in boluses of 10 cc per run by hand injections.
Projection angiographic sequences were taken at three times during the experiment: pre-treatment, post-treatment and follow-up. The pre-treatment angiograms were acquired before the treatment; the post-treatment angiograms were acquired after the treatment with the AVS or standard coronary stent, while the follow-up angiograms were acquired 28 days after the treatment.
2.4 Time-Density Curve angiographic analysis
The methods we used for the assessment of the effects of aneurysm treatment were: time-density curve angiographic analysis and histological evaluation.
The method employed to quantify the changes in blood flow occurring as a result of treating the aneurysm with the standard stent and with the new AVS was time-density curve analysis (TDC). TDCs track changes of contrast media density as a function of time in x-ray digital subtraction angiography (DSA) cine-sequences. As described in the literature13, TDCs are determined by choosing a polygonal shape defining the region of interest (ROI) (Fig. 4a) and then measuring the average contrast density value within the ROI area for each frame in the DSA sequence corresponding to a particular time (t) (Fig. 4b); and then we plot the area-average contrast density values as a function of time (Fig. 4c).
Figure 4.
a) Subtracted image of a vessel with aneurysm; b) Spatial-temporal distribution of contrast density passing through an ROI; c) Contrast density values plotted vs. time (TDC)
The first part of the TDC plot (Fig. 4c) corresponds to the aneurysmal contrast inflow. The slope of this part of the curve is an indication of the rate at which the contrast enters the aneurysm. The peak of the TDC curves is directly correlated with how much contrast enters inside the aneurysm. The time constants describing the washout part of the curve are related to the time that the contrast resides within aneurysm pouch (chosen ROI).
The advantages of this method include the fact that it relies on dynamic x-ray imaging (DSA), provides quantitative contrast media flow information, can be used as both an in-vivo and in-vitro diagnostic tool, is a fast patient-specific analysis and also presents great potential as a tool to measure regional (R-TDC) hemodynamic effects resulting from stent-prototype treatments as has been demonstrated in-vitro14.
2.5 Histological evaluation
As we mentioned above, the TDC method is used to measure the flow of contrast media into the aneurysm before and after treatment with the AVS and standard stents using in-vivo x-ray DSA cine-sequence data. On the other hand, the histology slides are used to compare the results of the TDC method with microscopic images of slices cut longitudinally through explanted aneurysms which show the final state of the aneurysm. After 28 days following the treatment of aneurysms with the AVS or standard stents, the animals are sacrificed. At the time of sacrifice, samples are fixed by pressure perfusion with either 0.9% buffered neutral Formalin solution or 2.5% Gluteraldehyde. After 30 minutes the specimens containing the aneurysm and parent vessel are explanted, and prior to histological processing, are stored in fixative (10% buffered neutral Formalin) for 48 hours at 4°C to stabilize the tissue and prevent decay. Then the aneurysm dome of each specimen is carefully excised from the parent vessel containing the stent, which is processed separately. In order to perform light microscopy for visualization of intra-aneurysmal healing, the aneurysms are embedded in paraffin using a standard technique15. Paraffin replaces the water in tissue and hardens it. The tissue is then cut using a rotary microtome (Microm International, HM355S, Kalamazoo, MI) into 2μm thick sections in planes parallel to the center line of the parent vessel. The tissue sections are mounted on a microscope slide and stained prior to being examined using a light microscope (Zeiss Axioskop-Gottingen, Germany). The stains used on the slides to give contrast and allow us to see morphological differences were: Hematoxilyn and Eosin (H&E) for overview, Van Gieson (EvG) for the aneurysm’s wall configuration and Masson Tri-Chrome stain for collagen fibers detection16.
Special attention was given to find un-organized and/or organized thrombus structures inside the aneurysm dome that could indicate the start of the finalization of healing processes17. These features do not appear inside a healthy blood vessel. An un-organized thrombus contains: red blood cells, platelets (anuclear cells involved in formation of blood clots) and fibrin (protein involved in clotting of blood by forming a “mesh” in conjunction with platelets). An organized thrombus contains: fibroblasts or smooth muscle cells present within a collagen (protein of connective tissue) matrix. It was possible to distinguish these formations due to different colorization of their specific components given by the stains applied on microscope slides as summarized in Table 1.
Table 1.
Colorization of different tissue components under different stains specific to the histology technique
| Stains
Components |
Van Gieson | Masson’s Tri-Chrome | Hematoxilyn and Eosin
(H&E) |
|---|---|---|---|
|
| |||
| nuclei | Blue | Black | Blue |
| collagen | Bright red | Blue | / |
| cytoplasm | Yellow | Red | Pink to red |
| muscle | Yellow | Red | / |
| fibrin | Yellow | Bright red | / |
| red blood cells | Yellow | / | / |
| keratin | / | Red | / |
Microscopic analysis was done by two observers blind to each others analysis and to the angiographic results. A grading scale was used to evaluate healing characteristics in the aneurysm’s dome and neck for each explant, which were scored separately and then averaged as a total “healing score” per aneurysm. This grading scale was as follows:
0= devoid of obvious thrombus, < 2% un-organized thrombus, no organized thrombus
1= > 2% un-organized thrombus, no organized thrombus
2= 10%–50% organized thrombus
3= >50% organized thrombus
4= organized thrombus only.
Histological evaluations provide a measure of pathological response of tissues to injuries. The characteristics of this method are: it enables presumptive identification of the source of injury in tissues as well as demonstration of the tissue reaction, it is one of the least expensive of the morphological techniques, it allows examination of large areas of tissue at a variety of magnifications, and there is a wide range of staining techniques available, however since it needs explants, it can not be used as an in-vivo diagnostic tool of the efficacy of aneurysm treatment in live patients.
3. RESULTS
3.1 DSA sequences
As we mentioned above, digital angiographic sequences were taken at three times during the experiment: pre-treatment, post-treatment, and 28 days follow-up.
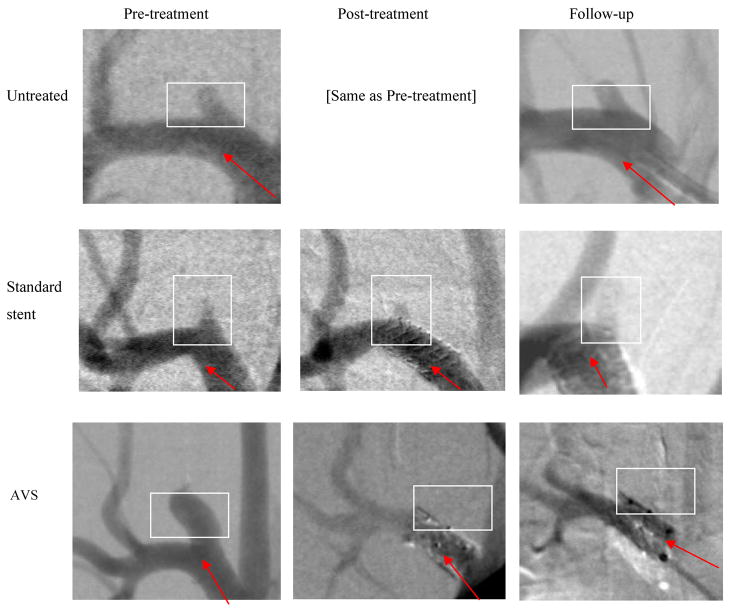
The three cases shown in Figure 5 are representative examples for the three rabbit groups (untreated, treated with standard stents, and treated with AVS).
Figure 5.
DSA images acquired at pre-treatment, post-treatment and at 28 days follow-up for untreated, standard stent treated, and AVS treated representative cases from the three groups. (The arrow indicates the direction of flow in the main vessel and the box indicates the region containing the aneurysm. The images are different in noise quality due to differences in the x-ray technique and misregistration due to motion - see further discussion in the text.)
In the first case (untreated DSA sequences), analysis shows no qualitative difference between the beginning of the study and 28 days follow-up. In both, there is strong blood flow in and out of the aneurysm. (Taking runs for post-treatment as well as pre-treatment for the untreated case is redundant and is not shown in Figure 5).
In the second case (treated with a standard stent), analysis shows that flow into the aneurysm is reduced after the placement of the standard stent. We observed iodinated contrast entering the aneurysm in the post-treatment run but we were not able to gauge by how much the inflow differs from the pre-treatment case from the visual inspection of the DSA sequences alone.
In the third case (treated with AVS), it can be seen that the aneurysm was totally occluded after the placement of the stent with patch, and we did not observe any contrast entering the aneurysm at either post-treatment or follow-up cases.
3.2 TDC and Histology
The results in the form of TDC curves and histology slides (Tri-Chrome staining technique) from the three treatment cases are presented below. The histological study was done on explanted specimens in order to check the viability of the TDC analysis method. On the histology slides, we were looking for fibrin and collagen structures inside the aneurysm (fibrin stains bright red and collagen stains blue when using the Tri-Chrome staining method). These are always a part of the thrombogenesis process.
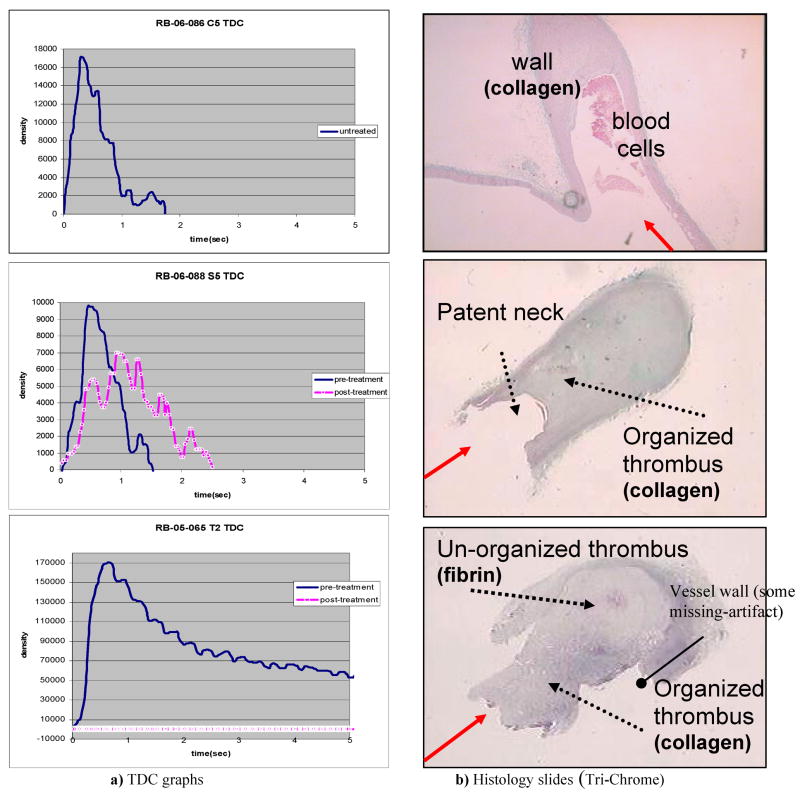
The solid line in the graphs of Figure 6a) (top, middle and bottom) represents the TDC for the entire aneurysm pre-treatment and the white-dotted line is the TDC taken after the stents were deployed in the desired position (post-treatment).
Figure 6.
TDC curves (pre- and post-treatment) versus histology slides (at 28 days follow-up) for the three cases representative of the three groups (from top to bottom: untreated, standard stent treated and AVS treated). (The solid arrow indicates the blood flow direction from the main vessel toward the aneurysm dome.)
In the first case (the untreated aneurysm), we have one TDC representing both the pre- and post-treatment instances since there is no treatment done for this group which was used as a control. From the TDC we could determine the peak density and residence time value for each particular rabbit aneurysm case. A peak value higher than zero shows that iodinated contrast substance enters into the aneurysm, and that the aneurysm is patent. The histology study confirmed that at 28 days follow-up the aneurysm is still patent (Fig. 6b-top).
In the second case (treated with a standard stent), one can conclude from the TDCs that there was a reduction in peak density (about 35% in this case) due to the standard stent placement at the neck of the aneurysm and an increase in the residence time (about 2 times in this case). The residence time is calculated using the full width at the half maximum of the TDC. The histology study confirmed the partial-patency of the aneurysm at 28 days follow-up after standard stent treatment (Fig. 6b-middle).
For the third case, the TDC for the pre-treatment case (solid) shows the filling of the aneurysm with blood. The TDC at post-treatment with the AVS (white-dotted) shows that the flow into the aneurysm has been dramatically reduced (in this case there is a 100% reduction in peak density). In the histology slide, the aneurysm was found to be completely occluded at follow-up. The histology study shows that, the aneurysm presents organized thrombus (collagen) at the neck and un-organized thrombus (fibrin) inside the dome at 28 days follow-up after AVS treatment.
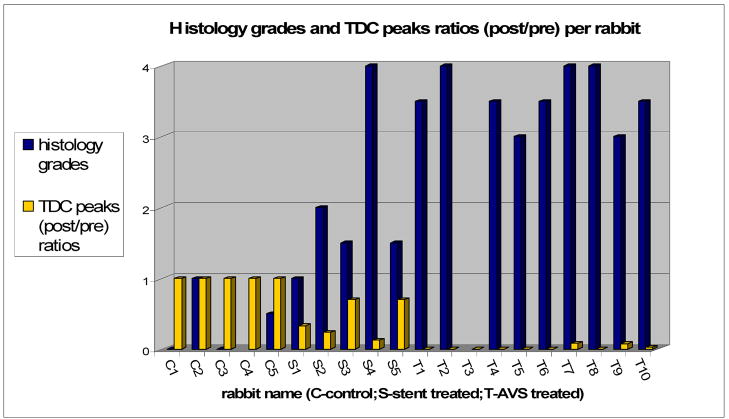
The cumulative results for all 20 rabbits used in our experiment are plotted in Figure 7 in the form of the ratio of TDC peaks (post/pre) and the histology grades received by each aneurysm.
Figure 7.
TDC peaks ratios (post/pre-treatment) compared with Histology averaged grades for each rabbit
(NOTE: C4 and T3 do not have histology grades due to severe artifacts or defects that occurred during processing.)
The plot shows, for the untreated group, values of (0 – 1) histology-grade and 1 for TDC ratio; for the standard stent group, values are (0.5 – 3.5) for histology grades and (0.1 – 0.7) for TDC ratio; and for the AVS treated group, values are (3 – 4) histology-grade and (0 – 0.09) for TDC ratio. In summary, the untreated control aneurysms displayed no reduction in flow and were still patent at follow-up as histology confirmed. The rabbits treated with standard stents showed an increase in residence time after treatment. Still the extent of flow modification with the standard stent is unpredictable. (The geometry of the aneurysm seems to be an important factor.) The histology confirmed the partial-patency of the aneurysms at 28 days follow-up. The AVS group showed an average reduction of contrast flow into the aneurysm of 95% after treatment with fully developed thrombus at 28 days follow-up.
4. DISCUSSION
The results obtained in our study suggest that consistent full healing can be achieved only with radical changes of hemodynamics conditions inside aneurysms. As seen from Figure 7, such changes appear not to be consistently achievable when we use standard stents to treat the aneurysms. From five standard stents used to treat the aneurysms, only one caused full dome obliteration (thrombosis). Another two caused partial-thrombosis and in two cases the aneurysms were almost fully patent at follow-up. At first glance this could indicate that standard stents could heal aneurysms as well as AVSs. The geometry of these aneurysms in terms of dome size and neck size for the one occluded was: (2.6 mm, 2.8 mm); for the ones that remained patent (5.6 mm, 3.2 mm) and (7.5 mm, 4.6 mm); and for the ones that were found partially-patent at follow-up (10.7 mm, 2.8 mm) and (12 mm, 4.7 mm). The aneurysm that was occluded is very small and the healing potentially could be self-healing rather than due to the stent treatment. Moreover, for the aneurysms that were found partially-patent, we observed, a pooling effect (contrast settling in the aneurysm dome) in the DSA runs taken post-treatment, which is indicative of slower flow in the particular geometry of these aneurysms. In the literature1 it is suggested that slow recirculation could trigger thrombus formation processes. For all 20 rabbits in this study the aneurysmal dome sizes have a significant range; however the aneurysm-neck sizes were relatively small compared to those encountered clinically, but this feature is a limitation of rabbit aneurysm model creation methodology. The geometry does not seem to be very important in the final results obtained for the untreated and AVS treated groups. Still the extent of flow modification brought by the treatment with the standard stent is unpredictable, and we consider the geometry of the aneurysm to play an important factor for this group only.
It is important to mention that when we acquire the DSA runs which are used in generating the time-density curves we have to maintain the same acquisition conditions for all cases. By acquisition conditions we mean: the same imaging geometry (SID, SOD), x-ray unit, x-ray techniques (kVp, mAs), number of frames per second, magnification mode, orientation angles for the gantry, image size and bits gray level. We can vary some of the factors (e.g. x-ray techniques, SID, SOD) in a real clinical environment when time is limiting by using the AEC and ABC functions of the x-ray machine and using the inverse-square law to make corrections as needed. We can do this between pre- and post-treatment runs (where the other conditions such as gantry position are kept the same) because they are taken in the same treatment session; however, it is almost impossible to maintain this uniformity if the real clinical data acquisitions are taken on different days. Without having a strict record of conditions corresponding to each patient and insuring that they be used by the physicians and technologists any time they have the same patient on the table, comparing the TDCs between sessions may have limited value if they are not reproducible. We expect that keeping such a record may be cumbersome in a clinical environment. As an example see Figure 5 for the standard stent-treated group representative rabbit case. The pre- and post-treatment DSA sequences have the same appearance, but the one at follow-up is very different (e.g., noise, angle etc.). For this report, we compared TDCs generated from DSA sequences acquired before and after treatment only in the same clinical session and under the same conditions, but did not include TDC data for the follow-ups which require further study.
Another issue that arose in applying TDC analysis to the in-vivo rabbit model is the wavy shapes of the curves. These fluctuations are mainly due to animal model breathing motion during the x-ray image acquisition. However, this is not expected to be a problem when using the method for studying flow in human intracranial aneurysms.
Iodinated contrast media injections used to get DSA runs and hence TDCs, were a 50/50 mixture of Optyray ® with saline in boluses of 10cc per run by hand injection. Hand injections were preferred so as to reproduce the clinical environment. They were given by a trained person to keep them as reproducible as possible. Also the quantity and density was dictated by the rabbit model limitations. In order to have reproducibility of TDCs pre- and post-treatment, the curves were normalized to the inflow. Care was taken not to introduce extra errors due to the position of the catheter too close to the neck region of interest chosen for normalization.
As mentioned previously regarding the histology slides, we were looking for fibrin and collagen structures inside the aneurysm (fibrin stains bright red and collagen stains blue in case of Tri-Chrome staining method). Inducing a thrombus is considered the desired result in aneurysm treatment. Care has to be taken not to mistakenly consider the collagen from the wall of the aneurysm as part of the thrombus. As one can see in Figure 6b at the top of the histology slide, the dome appears to be filled by a fibrous formation (blue-collagen); however, this collagen at the top is part of the former right carotid (RC) from the rabbit aneurysm model creation technique and is not related to a thrombus induced by the treatment. Thrombus formation starts from the inner part of aneurysm’s walls toward the center and starts first as an unorganized formation (fibrin-bright red) and ends up as organized thrombus (collagen-blue) and not in reverse order.
5. CONCLUSIONS
The quantitative in-vivo TDC analysis findings were confirmed by histological evaluation suggesting that the new AVS design has great potential as a definitive treatment for cerebro-vascular aneurysms.
The study suggests also that TDC analysis derived from angiographic imaging sequences may be a promising quantitative tool for in-vivo assessment of cerebro-vascular aneurysms treatments if used carefully.
Acknowledgments
This work was supported by NIH grants NINDS NS43924 and NIBIB EB002873, equipment provided by Toshiba Medical Systems Corp., and stents from Guidant Corp. (Abbott Vascular).
Special thanks to Jason R. Sherman for his help related to rabbits’ surgeries and to Abha Gupta for help related to patch welding on the stents.
References
- 1.Wootton DM, Ku DN. Fluid mechanics of vascular systems, diseases, and thrombosis. Annual Review of Biomedical Engineering. 1999;1:299–329. doi: 10.1146/annurev.bioeng.1.1.299. [DOI] [PubMed] [Google Scholar]
- 2.Doerfler A, Wanke I, Egelhof T, Stolke D, Forsting M. Double-stent method: Therapeutic alternative for small wide-necked aneurysms. Journal of Neurosurgery. 2004;100:150–154. doi: 10.3171/jns.2004.100.1.0150. [DOI] [PubMed] [Google Scholar]
- 3.Krings T, Busch C, Sellhaus B, Drexler AY, Bovi M, Hermanns-Sachweh B, Scherer K, Gilsbach JM, Thron A, Hans FJ. Long-term histological and scanning electron microscopy results of endovascular and operative treatments of experimentally induced aneurysms in the rabbit. Neurosurgery. 2006;59:911–923. doi: 10.1227/01.NEU.0000232841.08876.DA. discussion 923–914. [DOI] [PubMed] [Google Scholar]
- 4.Krings T, Hans FJ, Moller-Hartmann W, Brunn A, Thiex R, Schmitz-Rode T, Verken P, Scherer K, Dreeskamp H, Stein KP, Gilsbach JM, Thron A. Treatment of experimentally induced aneurysms with stents. Neurosurgery. 2005;56:1347–1359. doi: 10.1227/01.neu.0000159887.03290.d1. [DOI] [PubMed] [Google Scholar]
- 5.Wang Z, Ionita CN, Rudin S, et al. Proc of SPIE. Vol. 5369. San Diego: 2004. Angiographic analysis of blood flow modification in cerebral aneurysm models with a new asymmetric stent; pp. 307–318. [DOI] [PMC free article] [PubMed] [Google Scholar]
- 6.Rudin S, Wang Z, Kyprianou I, Hoffmann KR, Wu Y, Meng H, Guterman LR, Nemes B, Bednarek DR, Dmochowski J, Hopkins LN. Measurement of flow modification in phantom aneurysm model: Comparison of coils and a longitudinally and axially asymmetric stent - initial findings. Radiology. 2004;231:272–276. doi: 10.1148/radiol.2311021741. [DOI] [PubMed] [Google Scholar]
- 7.Ionita CN, Hoi Y, Meng H, Rudin S. Particle image velocimetry (piv) evaluation of flow modification in aneurysm phantoms using asymmetric stents. Proc of SPIE. 2004;5369:295–306. doi: 10.1117/12.534274. [DOI] [PMC free article] [PubMed] [Google Scholar]
- 8.Hoi Y, Ionita CN, Tranquebar RV, Hoffmann KR, Woodward SH, Taulbee DB, Meng H, Rudin S. Flow modification in canine intracranial aneurysm model by an asymmetric stent: Studies using digital subtraction angiography (dsa) and image-based computational fluid dynamics (cfd) analyses. SPIE. 2006;6143:61430J. doi: 10.1117/12.650624. [DOI] [PMC free article] [PubMed] [Google Scholar]
- 9.Minsuok K, Ciprian I, Rekha T, Hoffmann KR, Dale BT, Hui M, Stephen R. Evaluation of an asymmetric stent patch design for a patient specific intracranial aneurysm using computational fluid dynamic (cfd) calculations in the computed tomography (ct) derived lumen. SPIE. 2006;6143:61432G. doi: 10.1117/12.651773. [DOI] [PMC free article] [PubMed] [Google Scholar]
- 10.Ionita CN, Paciorek A, Hoffmann KR, Bednarek DR, Yamamoto J, Kolega J, Levy EI, Hopkins NL, Rudin S, Mocco J. Asymmetric vascular stent (avs): “Feasibility study of a new low-porosity patch-containing stent. Stroke. 2007 doi: 10.1161/STROKEAHA.107.503862. in print. [DOI] [PMC free article] [PubMed] [Google Scholar]
- 11.Cebral JR, Radaelli A, Frangi A, Putman CM. Qualitative comparison of intra-aneurysmal flow structures determined from conventional and virtual angiograms. Proc of SPIE. 2007;6511:65111E-1–9. [Google Scholar]
- 12.Altes TA, Cloft HJ, Short JG, et al. Creation of Saccular Aneurysms in the Rabbit: A Model Suitable for Testing Endovascular Devices. AJR. 2000 Feb;174:349–354. doi: 10.2214/ajr.174.2.1740349. [DOI] [PubMed] [Google Scholar]
- 13.Shpilfoygel SD, Close RA, Valentino DJ, Duckwiler GR. X-ray videodensitometric methods for blood flow and velocity measurement: a critical review of literature. Med Phys. 2000 Sep;27(9):2008–23. doi: 10.1118/1.1288669. [DOI] [PubMed] [Google Scholar]
- 14.Dohatcu AC, Ionita CN, Sherman JR, Rangwalla H, Bednarek DR, Hoffmann KR, Rudin S. Regional Time Density Curves (R-TDC) Derived From Angiographic Sequences for Analysis of Aneurysmal Flow Modification Resulting From Endovascular Image-Guided Interventions” SU-FF-I-128. AAPM 2007 Annual Meeting; Minneapolis, MN. [Google Scholar]
- 15.http://www.ihcworld.com/_protocols/histology/paraffin_section.htm
- 16.http://www.ihcworld.com/protocol_database.htm
- 17.Yuichi Murayama MD, Satoshi Tateshima MD, Nestor R, Gonzalez MD, Fernando Vinuela MD. Matrix and Bioabsorbable Polymeric Coils Accelerate Healing of Intracranial Aneurysms. Long-Term Experimental Study. Stroke. 2003;34:2031–2037. doi: 10.1161/01.STR.0000083394.33633.C2. [DOI] [PubMed] [Google Scholar]


