

Abstract
Very little is known about the conformation of polypeptides emerging from the ribosome during protein biosynthesis. Here, we explore the dynamics of ribosome-bound nascent polypeptides and proteins in Escherichia coli by dynamic fluorescence depolarization, and assess the population of cotranslationally active chaperones trigger factor (TF) and DnaK. E. coli cell-free technology and fluorophore-linked E. coli Met-tRNAfMet enable selective site-specific labeling of nascent proteins at N-terminal methionine. For the first time, direct spectroscopic evidence captures the generation of independent nascent chain motions for a single-domain protein emerging from the ribosome (apparent rotational correlation time ca. 5 ns), during the intermediate and late stages of polypeptide elongation. Such motions are only detected for a sequence encoding a globular protein but not for a natively unfolded control, suggesting that the independent nascent chain dynamics may be a signature of folding-competent sequences. In summary, we observe multi-component, severely rotationally restricted and strongly chain length/sequence-dependent nascent chain dynamics.
INTRODUCTION
The conformation and dynamics of nascent polypeptides emerging from the ribosome during biosynthesis are largely unexplored, to date. Yet, understanding these aspects of the protein folding question is very important, considering that most biomolecules need to be properly synthesized to function efficiently in the cell. The protein's fate in the cellular environment critically relies on the ability of the nascent chain to properly sample conformational space. This includes the need to avoid irreversible misfolded conformations before biosynthesis of the full length protein is complete.
High resolution structures of the ribosome large subunit in the absence (1-3) and presence (4, 5) of the ribosome-associated chaperone trigger factor (TF) have recently become available. A close inspection of these structures suggests that both the ribosome exit tunnel and TF impose a number of geometrical constraints to conformational sampling during translation in E. coli (2). These constraints have the potential to affect the folding and dynamics of nascent chains before biosynthesis has reached completion.
In addition to TF, a second major cotranslationally active chaperone, DnaK, is known to interact with elongating nascent chains in bacteria (6). A complex regulatory cycle involving the co-chaperones DnaJ, GrpE and nucleotide binding modulates DnaK's activity (7). The preferred binding motifs of DnaK and TF are not identical. However, both chaperones share an affinity for nonpolar and basic residues (8).
This work provides the first high resolution spectroscopic characterization of the dynamics of ribosome-bound nascent polypeptides for sequences encoding a single-domain and a natively unfolded protein. Previous work employing steady-state fluorescence anisotropy (9) yielded important conclusions on the role of chaperones in the ribosome-release of nascent proteins. While these studies provided a powerful tool to discriminate ribosome-free from ribosome-bound species, they were unable to resolve the specific dynamics of the ribosome-bound nascent chains from those of the whole ribosome-nascent chain complexes (RNCs). Steady-state fluorescence anisotropy reports on the average motions of fluorophore-containing macromolecules and is therefore unable to discriminate the presence of different types of dynamics, including their relative amplitudes and individual apparent rotational correlation times. Here, we employ a fluorescence anisotropy decay approach based on frequency-domain fluorometry known as dynamic fluorescence depolarization (10, 11), to discriminate the different types of motions occurring within RNCs. This methodology is uniquely tailored to discriminate complex motions, including the local motions of polypeptides bound to large macromolecules. Such dynamic properties are difficult to assess by other spectroscopies or functional assays.
The analysis is carried out for ribosome-bound nascent chains of apomyoglobin (apoMb) and the natively unfolded protein PIR, used as a control. The α-helical apoMb sequence has been selected because (a) the folding pathways (12, 13) and backbone motions (14) of the full length protein have been extensively studied, and (b) the production of native apoMb in E. coli cell-free systems has already been established in our laboratory by 2D NMR and ultracentrifugation (15). While the in vitro chain elongation behavior of apoMb has already been studied on purified N-terminal fragments in buffered solution (16), it is important to extend the previous studies to include the effect of the translation machinery and cotranslationally active chaperones on polypeptide folding and dynamics.
RESULTS AND DISCUSSION
Experimental design
Nascent polypeptides of increasing length derived from the apomyoglobin (apoMb) sequence (Figure 1, panel a) were analyzed in an E. coli cell-free system. The polypeptide length was chosen so that variable fractions of the chain are expected to be buried in the ribosomal exit channel (Figure 1, panel b). The natively unfolded PIR90 control protein was examined as a reference due to its low nonpolar content (Supporting Figure 3) and its intrinsic inability to adopt a compact structure in aqueous medium. Small angle X-ray scattering (SAXS) of pure full-length PIR shows that this sequence behaves as an unfolded self-avoiding Gaussian chain (17).
Figure 1.
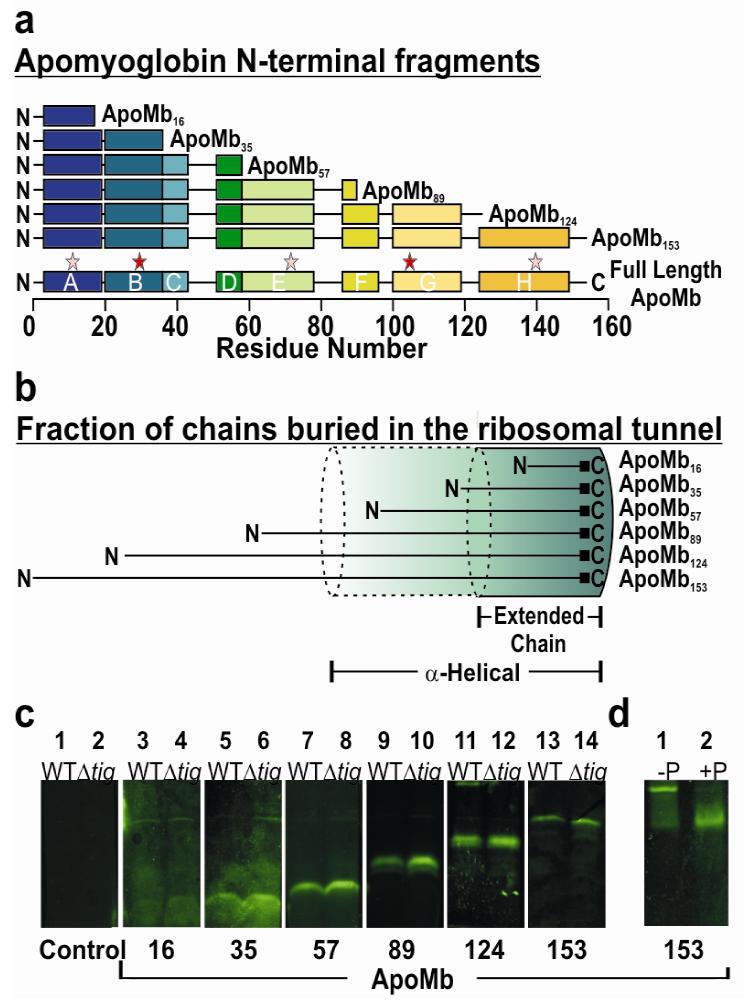
General features of ApoMb nascent chains. a) Schematic representation of apoMb ribosome-bound nascent polypeptides examined in this work. Chain lengths of N-terminal fragments are marked as subscripts. Colored segments (labeled A-H) denote α-helical regions of native full length apoMb. Stars indicate the experimentally detected high- (red) and low- (pink) affinity DnaK binding sites (48). b) Pictorial illustration of the expected fraction of nascent polypeptides buried inside the ribosomal exit tunnel (length ca. 100 Å, (1-3)) for limiting fully α-helical (1.5 Å /residue) and fully extended (3.5 Å /residue) conformations (see also Supporting Information). c) SDS-PAGE analysis of nascent apoMb polypeptides N-terminally tagged with BODIPY-FL-Met. Expression products for both wild-type (WT) and trigger factor-deficient (Δtig) cell-free systems are displayed. Samples in this panel are shown after treatment with puromycin (Puro). d) Verification of the fully ribosome-bound status of the nascent chains by treatment of ribosome-associated peptidyl-tRNAs with Puro. In the presence of the ribosome, Puro catalyzes the conversion of peptidyl-tRNA (lane 1) to peptidyl-Puro (lane 2), giving rise to a lower molecular weight species. As an example, the effect of Puro on apoMb153 RNCs is shown. Similar analysis was successfully performed on other nascent chains (Supporting Figure 1).
Initiation of protein biosynthesis is neither synchronized nor rigorously synchronizable across the ensemble of ribosomes in intact cells and cell-free systems. This limitation, which hampers both sensitivity and resolution, was overcome by generating ribosome-bound nascent chains of increasing length and monodisperse molecular mass. Creation of these homogeneous equilibrium populations of apoMb-RNCs is key to the success of our experiments (Figure 1, panel c). Given that conformational sampling is typically much faster than translation (16), these equilibrium populations may be regarded as working models for transiently elongating polypeptides. Cell-free expression was carried out in the presence of BODIPY-FL-tagged , leading to the biosynthesis of N-terminal BODIPY-FL-labeled nascent chains. This strategy provides the advantage of ensuring that all nascent chains are labeled with only one fluorophore at a unique sequence site (the amino group of N-terminal methionine). Due to its fluorescence lifetime in the low ns range (τF = 5.9 ns), BODIPY-FL is an ideal fluorophore here due to its small size and its ability to probe motions on a timescale close to the independent tumbling time of small globular proteins.
Biochemical characterization
As a complement to the spectroscopy, the amounts of chaperones associated with resuspended RNCs were characterized. Immunoblotting (Figure 2, panel a) shows that the average amount of TF per active ribosome increases progressively with chain elongation, with a sharp rise near completion of biosynthesis. The absolute amounts of TF associated with apoMb153-RNCs after ultracentrifugation are comparable to the estimated amounts of translating ribosomes (data not shown). Given the known 1:1 stoichiometry for substrate:TF binding (18), the above results suggest that TF displays a higher affinity for nascent apoMb chains as they get longer and acquire a higher nonpolar content, in agreement with recent studies on other proteins (19, 20).
Figure 2.
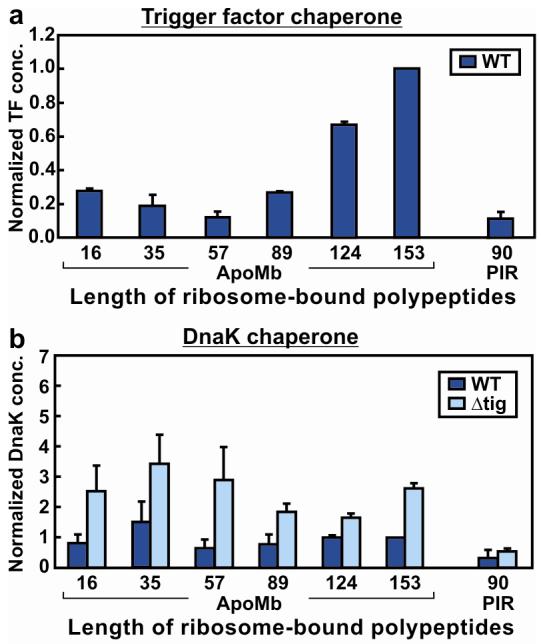
Normalized concentrations of TF and DnaK co-pelleting with RNCs. Normalized chaperone concentrations were obtained by dividing chaperone concentrations by ribosome-bound nascent chain levels (determined by fluorescence) and reporting the results relative to the values for the full length apoMb153 WT sample. Reported values are the average of two to six separate experiments. Uncertainties are reported as standard errors. a) Normalized concentrations of TF associating with translating ribosomes carrying nascent polypeptides. Cell-free expression was performed in WT cell-free systems. b) Normalized concentrations of DnaK associating with translating ribosomes carrying nascent polypeptides. Cell-free expression was performed in both WT and Δtig cell-free systems.
While the TF chaperone associates most tightly with RNCs bearing full-length apoMb, the biosynthesis of the natively unfolded control sequence PIR90 requires reduced amounts of TF (Figure 2, panel a). In addition to its low hydrophobicity, PIR90 has very few aromatic residues (Supporting Figure 3). Both nonpolar content and aromatic residues of the substrate are important for TF affinity in solution (21, 22). Therefore, the observed low TF content in PIR90-RNCs is consistent with the prediction that this chaperone should not significantly interact with PIR90.
Immunoblotting also shows that the bacterial Hsp70 chaperone DnaK associates with apoMb-translating ribosomes more than with the PIR90 control sequence, in wild-type strains (Figure 2, panel b). However, in contrast with the behavior of TF, the amount of detectable ribosome-apoMb-associated DnaK is independent of substrate chain length within experimental error. The presence of residual DnaK even at short chain lengths is not entirely surprising given the known affinity of DnaK for E. coli ribosomes (23). Therefore some of the DnaK detected here may be due to association with the ribosome. DnaK concentrations increase for cell-free systems prepared from Δtig strains (lacking the gene for TF), in agreement with the overall complementary roles of DnaK and TF (8) and the likelihood that they compete for similar binding sites (8, 24). There is, however, no significant detectable difference in the amount of DnaK associated with RNCs carrying the short apoMb16 and apoMb35 nascent chains prepared from wild type and Δtig strains, due to the high experimental error. The two-tailed Student's t-test shows that the probability that the wild type and Δtig results are equal (p = 0.27 for apoMb16 and p = 0.36 for apoMb35) is far above the standard p<0.05 or 0.1 required to demonstrate that they are different.
The dynamic fluorescence depolarization approach
Initial steady-state anisotropy experiments on RNCs bearing apoMb polypeptides of increasing length (Supporting Figure 4) yielded no insights into the motions of nascent chains. Dynamic fluorescence depolarization (10, 11) is a more powerful approach that relies on the identification of fluorescence anisotropy decays in the frequency domain and enables the explicit discrimination of different types of motions (Figure 3, panel a). This methodology therefore provides specific information on the dynamics of nascent polypeptides in the context of the ribosomal complex.
Figure 3.

Technical aspects of dynamic fluorescence depolarization data collection. a) Representative physical model (3-component) for multiple independent molecular motions and matching equations applicable to rotational correlation times (τi) differing by at least one order of magnitude. The BODIPY-FL fluorophore is shown in green. Fi is the fractional amplitude for the anisotropy decay corresponding to each of the motions. In the case of 2-component RNC dynamics, the intermediate timescale (I) term is lost. b) Representative experimental fluorescence anisotropy data for short (apoMb16) and long (apoMb153) ribosome-bound nascent chains and associated 2- and 3-component fits, respectively. c) Multiexponential curve fitting (2- and 3-component analysis) and residuals for ribosome-bound ApoMb16. d) ApoMb153 analyzed similarly to panel c and 2-component fit with variable r0. e) Simulation illustrating the unique features of typical 2-and 3-component frequency-domain anisotropy decays. f) Expected phase changes upon varying the fraction of intermediate (fI) and fast timescale motions, to illustrate the progression from 2-(fI = 0) to 3-component decays. The 2- and 3-component phase change plots of panel e coincide with simulations A and C. g) Parameters used for the simulations in panel f.
The frequency-domain dynamic fluorescence depolarization approach enables detection of complex anisotropy decays at very good resolution. The following reasons contribute to the high performance of this tool (25). In the frequency domain, differences between the polarized components of the decay are measured directly, at different frequencies of the sinusoidally amplitude-modulated excitation light source. On the other hand, in the more widely used time-domain methodology, which monitors polarized fluorescence emission decays in real time, the desired anisotropy decay profile is calculated from two separate intensity components, I⊥ and I∥. Furthermore, frequency domain data collection and fitting are based on two concurrently collected observables (i.e., the differential polarized phase angle and the ratio of polarized modulated amplitudes), each providing information on multiple anisotropy components and resulting in a better resolution than the observation of either quantity alone.
The BODIPY fluorophore, selectively linked to the N terminus amino group of the nascent chains, serves as a reporter for its own fast local dynamics (F), the local dynamics of the nascent chain (I) and the global dynamics of the whole RNC, dominated by the slow motions of the ribosome. As shown in the Figure, local and global motions are present concurrently within the same species (Figure 3, panel a).
Representative raw data collected by frequency domain fluorometry for short and long ribosome-bound nascent chains are shown (Figure 3). There is a dramatic difference between the dynamics of short and long nascent chains (Figure 3, panel b). The short chains experience a very fast motion, given that the sinusoidal maximum of the phase change falls at frequencies even higher than experimentally detectable. This fast motion has a similar apparent τC to free BODIPY (0.12 ± 0.04 ns, measured in the same medium), and must be rotationally restricted since the anisotropy does not completely decay over the experimental timescale.
The featureless modulation ratio profile further confirms the presence of local segmental dynamics and a very slow global tumbling (≥ 0.5 μs). Upon curve fitting (Figure 3, panel a, and Methods section), the slowest anisotropy phase, which corresponds to the residual anisotropy at time infinity, is assigned to the global motions of the ribosome complex.
Remarkably, the long chains show one additional local motion, which is detectable as a characteristic spectral feature (i.e., a curved bump) of the phase–change data at intermediate modulation frequencies. This feature reveals the presence of a local motion with a 3–7 ns apparent rotational correlation time (τc). The above dynamic component is clearly detectable (Figure 3, panels b, d) and statistically well beyond experimental error (Table 1). Spectral simulations further confirm the correlation between the fraction of depolarization decay assigned to the ns motion and its matching and readily identifiable spectroscopic signature (Figure 3, panels e, f).
Table 1.
Dynamic fluorescence anisotropy parameters and average χ2 for the data in Figure 4. Fit quality was separately assessed for each experimental sample. 3-component decays were chosen over 2-component decays only when a significant decrease in χ2 (by a factor > 2.5) was observed. The χ2 values corresponding to the best fits are shown in bold.
| Regimes of Motion | ||||||||
|---|---|---|---|---|---|---|---|---|
| Polypeptide Chain |
Slow | Intermediate | Fast | χ2 | ||||
| Fractiona | τc (ns) | Fractiona | τc (ns) a | Fractiona | τc (ns) a | 2- Component |
3- Component |
|
| ApoMb16 | 0.72 ± 0.02 | 1000 | 0.28 ± 0.02 | 0.3 ± 0.1 | 1.86 | 1.75 | ||
| ApoMb35 | 0.74 ± 0.01 | 1000 | 0.25 ± 0.01 | 0.4 ± 0.1 | 1.90 | 0.96 | ||
| ApoMb57b | 0.73 ± 0.01 | 1000 | 0.27 ± 0.01 | 0.3 ± 0.01 | 0.57 | 0.53 | ||
| ApoMb57 | 0.74 ± 0.01 | 1000 | 0.10 ± 0.01 | 9 ± 2 | 0.16 ± 0.01 | 0.2 ± 0.1 | 2.63 | 0.22 |
| ApoMb89 | 0.70 ± 0.01 | 1000 | 0.10 ± 0.01 | 5 ± 1 | 0.20 ± 0.04 | 0.4 ± 0.1 | 3.39 | 0.43 |
| ApoMb124 | 0.68 ± 0.01 | 1000 | 0.10 ± 0.02 | 7 ± 1 | 0.22 ± 0.03 | 0.3 ± 0.1 | 4.52 | 0.41 |
| ApoMb153 | 0.65 ± 0.01 | 1000 | 0.13 ± 0.01 | 5 ± 1 | 0.23 ± 0.01 | 0.3 ± 0.1 | 7.01 | 0.26 |
| PIR90 | 0.57 ± 0.01 | 1000 | 0.43 ± 0.01 | 0.3 ± 0.1 | 4.21 | 2.06 | ||
| Released ApoMb153 |
na | na | 0.67 ± 0.01 | 41 ± 2 | 0.32 ± 0.01 | 0.77 ± 0.05 | 0.74 | na |
The error reflects ± one standard error (for 2-7 repeats, unless otherwise stated). In case of a smaller standard error than the curve fitting error for any of the experimental repeats, the curve fitting error is reported.
The reported error for the single 2-component sample of apoMb57 is the curve fitting error.
Data analysis and interpretation
A detailed analysis of the fluorescence depolarization data for all the apoMb chain lengths (Figure 4 and Table 1) reveals that the number and type of observed motions are significantly dependent on the peptide elongation stage. Only two distinct classes of dynamics are identified for short nascent chains while three types are detected for longer chains.
Figure 4.

Frequency domain dynamic fluorescence depolarization of ribosome-associated apoMb and PIR90 nascent chains generated in a wild-type E. coli cell-free system. ApoMb57 displays both 2- and 3-component dynamics. Data for a control sample of ribosome-released ApoMb153 are also shown. The cartoons on the far right highlight the proposed motions (in red) associated with each fluorescence phase. The BODIPY-FL fluorophore is shown in green.
We assign the slow phase to the chain motions associated with the overall tumbling of the higher order complex, dominated by the size of the ribosome. Accordingly, the τc for this motion was set to 1 μs. While this motion cannot be resolved directly, as its timescale is much longer than the fluorophore lifetime, its presence is inferred from the fact that a non-decaying anisotropy component needs to be introduced for the fitting algorithm to converge. The fraction of anisotropy decay for this motion is treated as a floating parameter in the fits.
The phase corresponding to motions occurring on an intermediate timescale (τc = 3–7 ns) provides evidence for the presence of an independent conformation of the ribosome-bound nascent protein. This phase is detected only for the longer nascent chains (apoMb89-153), and its timescale corresponds to the approximate apparent rotational correlation time of a small structured domain. The apparent rotational correlation time for the intermediate timescale motion changes significantly upon release of apoMb153 from the ribosome in the crowded medium, from 4.5 ± 0.7 to 41±14 ns. As expected, the slow motion due to global RNC tumbling is no longer present, for this species. Therefore it is clear that apoMb undergoes some structural and/or shape changes upon release from the ribosome. The fast timescale motion is detected for all samples, including ribosome-released apoMb153.
The fact that the 3–7 ns intermediate timescale motion preserves a constant fraction and a similar τC for the 89- to 153-residue chains suggests that the general nature of this motion does not significantly vary as the protein emerges from the ribosome. While high resolution structural/dynamic details cannot be drawn by fluorescence depolarization alone, the above observations support the fact that this motion is a persistent feature of all RNCs bearing the first ≈60 N-terminal residues of apoMb.
The apoMb57-RNC has a peculiar experimental behavior. It displays 3-component dynamics in only 75% of the experiments, while the remaining 25% fit best to 2-state dynamics, lacking the ns timescale motion (Figure 4). The poor data reproducibility at this chain length may reflect the fact that the independent ns motions of nascent apoMb57 (50–100 % buried in the ribosomal tunnel, Figure 1, panel b) could arise from an unstable structure whose population is strongly affected by small sample-dependent changes in experimental conditions.
In summary, three distinct dynamic regimes are identified for nascent apoMb-RNCs, fast (sub–ns), intermediate timescale (3–7 ns) and slow (>1 μs). These motions are assigned to global tumbling of the ribosomal complex, nascent chain dynamics, and local fluorophore dynamics, respectively. The short nascent chains (16, 35 residues) display only the fast and slow motion while the longer chains (89–153 residues) also display the ns motion.
The behavior of the nascent chains in the absence of molecular chaperones was analyzed by creating chaperone-free RNCs in a TF-deficient cell-free system (Δtig strain, −G conditions). We then treated the resuspended ribosomes bearing either apoMb153-or PIR90-RNCs with GrpE and excess ATP (+G conditions, Figure 5, panel a). This procedure ensures release of any bound DnaK from the nascent chains, as confirmed by immunoblotting. The presence of additional chaperones (DnaJ or SecB) in the RNC has been excluded by immunoblotting (Supporting Figure 2). As shown by the frequency-dependent phase changes (Figure 5, panel b, modulation frequency ≈70 MHz), release of DnaK from full length apoMb does not lead to a decrease in the fraction of the ns motion. In fact, an increase in fraction (from 4–95%) is observed. This result is important because it shows that the 3–7 ns motion is not due to the binding of ribosome-bound nascent chains to DnaK but is a unique feature of the nascent chain. In other words, this independent motion is sampled by the nascent chains regardless of the presence of chaperones.
Figure 5.
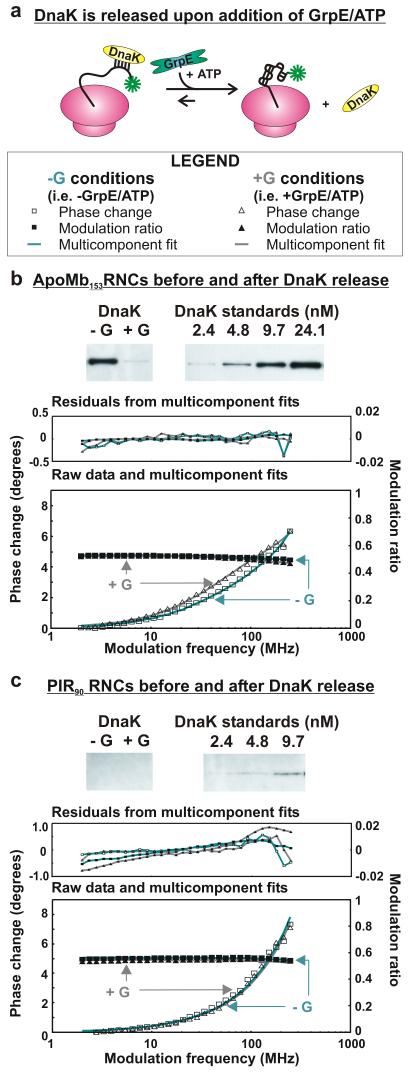
Dynamic fluorescence depolarization of RNCs generated in a trigger factor-depleted (Δtig) cell-free system, before and after release of DnaK. a) Illustration of DnaK release induced by the addition of 2 μM GrpE, 30 μM ATP, and 500 μM KCl (+G conditions). b) Western blot showing that the concentration of apoMb153-RNC-bound DnaK is significantly reduced under +G conditions. This panel also shows the phase shift of the frequency domain fluorescence anisotropy of apoMb153-RNC upon release of DnaK. The shift corresponds to an enhancement in the fraction of ns motions. c) Western blot and fluorescence analysis (as in panel b) of PIR90. No shift from a 2-component fit is detected under +G conditions. Each experiment in panels b and c was repeated 3 times.
Not surprisingly, no changes in nascent chain dynamics are detected for PIR90 under +G conditions.
Models for RNC dynamics
Based on the above data, some important insights into the nature of the independent nascent chain motions can be gained. We will focus the discussion on the nascent chains of sufficient length to emerge from the ribosomal tunnel, as they exhibit the most interesting behavior.
Representative cartoons (Figure 6) highlight the known presence of a dynamic exchange between chaperones and nascent chains and provide a framework for interpretation of the data on the RNCs generated in wild type cell-free systems. Three important facts need to be considered. Namely: (a) the existence of a reversible interaction between nascent chains and trigger factor or DnaK, (b) the fact that TF is effectively “frozen on the ribosome” (i.e., ribosome-bound) on the timescale of TF binding to nascent chains (20, 26), and (c) the μs–s on/off rates for nascent chain interaction with TF (20, 26) and μs–min on/off rates for interaction with DnaK (27). The above observations support the idea that nascent chain emerging from the ribosome are transiently bound to TF and/or DnaK on a slow timescale (μs–s) relative to the dynamic fluorescence depolarization timescale (ns). Therefore, while chaperone-bound nascent chain species are likely to exist, their motions remain spectroscopically unresolved here and merge into the fraction of non-decaying anisotropy of the entire RNC (Figure 4). We conclude that this study does not provide information about the dynamics of chaperone-bound species 1 and 3 (Figure 6). Conversely, BODIPY depolarization is sensitive to the independent chain motions of the chaperone-free species of type 2 or 4.
Figure 6.
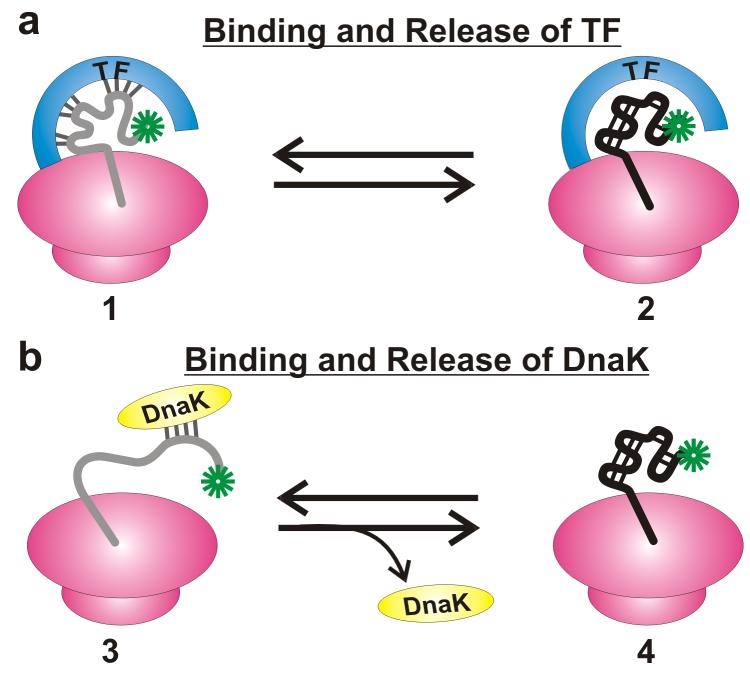
Proposed models for ribosome-bound nascent polypeptides consistent with the observed RNC dynamics. Both TF (a) and DnaK (b) are involved in binding/release events. The nascent chains are likely to interact with both chaperones, in the wild-type cell-free system. Only species of type 2 and 4 contribute to the 3–7 ns motion.
The possibility that ∼ns chemical exchange processes between species of types 1 (or 3) and 2 (or 4) are responsible for the observed 3–7 ns timescale motions is ruled out on the grounds that this type of dynamics is also detected in the absence of any cotranslationally active chaperones (Figure 5). In addition, as discussed above, the literature reports much longer lifetimes (μs–s) for TF- and DnaK-nascent chain complexes.
In summary, we interpret the apoMb89-153 3–7 ns motions as the signature of an independently tumbling structural domain of nascent chains emerging from the ribosome. Shorter apoMb chains buried in the ribosomal tunnel and natively unfolded PIR90 lack this feature.
Nascent chain structure and dynamics
Which specific structure is compatible with such independent ns dynamics? It is clear that this question cannot be answered based on fluorescence depolarization data alone. On the other hand, it is possible to broadly define the class of structures consistent with the spectroscopic results.
The putative size and shape compatible with the observed ns dynamics of apoMb153-RNCs (Figure 7) prompt some broad speculations. The expected rotational correlation times corresponding to rigid extended chains, semi-compact ellipsoids and spheres are shown for different chain lengths. The effective viscosity (required to generate the plots and measured by us in the resuspended ribosome medium, see also Supporting Information) sensed by the nascent chain depends on both crowding of the medium and local structural confinement (28). Two representative limiting viscosities (η) are considered here: η of free BODIPY (panel a) and η of ribosome-released apoMb153 (panel b), measured in RNC solutions.
Figure 7.

Simulations illustrating the expected domain sizes compatible with the experimentally detected rotational correlation time (4.5 ± 0.8 ns) of apoMb153 RNC motions. Three shapes were modeled: rigid fully extended polypeptide (prolate ellipsoid, black), semi-compact chain (prolate ellipsoid with fixed aspect ratio ρ=3.5, blue) and spherical collapsed chain (red). Correlation times were calculated (Supporting Information) assuming either the viscosity of water (a) or the viscosity sensed by ribosome-released full-length apoMb regarded as a globular and monomeric species in the resuspended RNC medium (b). Experimentally feasible chain lengths and structures fall under the shaded regions.
Both panels a and b exclude the presence of fully extended chains, given that the typical polypeptide persistence length is only 4-6 residues. Less elongated ellipsoids and spheres are feasible for a wide range of molecular sizes. Panel a predicts longer chain lengths (90–130 residues) than could possibly emerge form the ribosome in apoMb153. Panel b, conversely, estimates the possible presence of 10- to 15- residue-long spheres and semi-compact ellipsoids.
Large nascent chains emerging from the ribosome may sense local crowding/confinement to a similar extent as ribosome-released apoMb153 while smaller structures may sense a viscosity closer to that of the free fluorophore. While it is impossible to differentiate between the two scenarios based on the currently available information, it follows from the above discussion that the observed tumbling unit should be at least partially compact and possibly correspond to a fairly small stretch of residues. In summary, we speculate that the independent ns dynamics of full length apoMb153 may correspond to a semi-compact ellipsoidal shape of chain length > 8 residues.
Conclusions
We have presented direct spectroscopic evidence for the presence of independent nascent protein conformations during intermediate and late stages of biosynthesis. These species are absent in the case of a natively unfolded control protein incapable of assuming a well defined structure.
The direct biophysical evidence presented here moves a step forward to understand conformational sampling during the earliest stages of a protein's life. The presence of ribosome-bound nascent chain structure has been detected only indirectly before, (9, 29-32) and high resolution information has only been gained for the outer domains of multidomain proteins (33). Here, for the first time, we (a) present direct evidence for the conformational dynamics of nascent polypeptides encoding a single-domain protein both inside and outside the ribosomal exit tunnel, and (b) demonstrate the distinctive dependence of nascent chain structural dynamics on the stage of chain elongation and amino acid sequence. While more investigations are needed to unveil further details at higher resolution, this work takes an initial step at exploring the structure/dynamics of nascent proteins.
In contrast with purified N-terminal fragments, which become structured only extremely close to chain completion or heavily aggregate (34), we show here that ribosome-bound apoMb explores independent conformations even when a large C-terminal fraction is missing.
Finally, this investigation introduces dynamic fluorescence depolarization as a tool to study cotranslational protein folding. The power of this technique stems from its simplicity. Only one site-specific label is needed, in contrast with other approaches (e.g., FRET), which typically require multiple probes. In addition, dynamic fluorescence depolarization enables the resolution of multiple concurrent motions in a single experiment.
METHODS
Bacterial strains and plasmids
The E. coli K12 strain A19 (35) was supplied by G. Kramer. The MC4100Δtig::cat E. coli strain was provided by P. Genevaux and F.U. Hartl (36). Construction of the E. coliA19Δtig strain was carried out by transferring the Δtig::cat allele from MC4100Δtig::cat into the A19 strain by P1 transduction using the P1vir phage. Transductants were selected at 37°C on Luria-Bertani (LB) agar containing chloramphenicol (15 μg/ml) and 10 mM sodium citrate. Colonies were further purified by restreaking on the same plates. The absence of TF was confirmed by Western blot.
The plasmid containing the sperm whale Mb gene was described previously (15). A pET-28b (Novagen) plasmid carrying the gene for Grb14 PIR domain was supplied by I. Broutin (17). The PIR stop codon (TGA) was mutated to GAT with the QuikChange® Site-Directed Mutagenesis Kit (Stratagene). The pTf16 plasmid containing the wild-type tig gene was purchased from Takara Mirus Bio.
Generation of BODIPY-FL Met-tRNAfMet
BODIPY® FL (Invitrogen) and tRNAfMet (Sigma-Aldrich) were used without further purification. Aminoacylation of tRNAfMet was performed as described (37) with overexpressed and purified E. coli Methionyl tRNA synthetase (38). Met-tRNAfMet was conjugated to the succinimidyl ester of BODIPY-FL (10.0 mM) according to known protocols (39, 40). The reaction was quenched with tris-HCl (pH 7.5, 0.3 mM), brought to pH 5 with acetic acid (AcOH), and diluted 6× with aqueous NaOAc (0.3 mM, pH 5.4) followed by phenol extraction and ethanol precipitation twice. The pellet was resuspended in 0.25 volumes of H2O. Fluorescent labeling was confirmed by NaOAc-urea-PAGE (7 M urea, 9.7% acrylamide, 0.3% bis-acrylamide) adapted from (41), followed by fluorescence imaging (UC 4×4 scanner from Genomic Solutions, λex 488 nm, emission channel bandpass filter centered at 512 nm) and staining with StainsAll (Sigma-Aldrich).
Cell-free protein synthesis
E. coli S30 extracts were prepared from either wild-type A19 (15) or trigger factor-deficient A19Δtig::cat strains.
Protein biosynthesis was carried out as described (15). Folinic acid was omitted from the transcription-translation mixture and BODIPY-FL-Met-tRNAfMet was added (final concentration ∼3 U/ml) except for fluorescence negative controls, which lacked fluorescent tRNA but included folinic acid.
Protein synthesis (75 μl) was allowed to proceed for 30 min at 37°C. BODIPY-labeled ribosome-released full length apoMb was generated from wild-type RNCs upon addition of 1.5 M NH2OH in the presence of 0.4 μM GrpE, 0.4 μM DnaJ, 30 μM ATP and 500 μM KCl.
Generation and isolation of RNCs
Ribosome-bound nascent chains were generated by oligodeoxynucleotide-directed mRNA cleavage (Supporting Information). Ribosomal pellets (including ribosome-bound peptides and associated proteins) were isolated upon ultracentrifugation (Beckman TL-100 with TLA 100.1 or equivalent rotor) as follows. Cell-free expression mixtures (75 μl) were loaded onto a 150 μl of sucrose cushion (1.1 M sucrose, 20 mM tris-HCl, 10 mM MgOAc2, 500 mM NH4Cl, 0.5 mM EDTA and 1 mM dl-dithiothreitol, pH adjusted to 6.9) (42) and ultracentrifuged at 160,000 × g for 60 min at 4°C. The ribosomal pellet was resuspended in 15 μl (i.e., 1/5 of the original volume) of buffer (10 mM tris-HCl, 10 mM Mg(OAc)2, 60 mM NH4Cl, 0.5 mM EDTA, 1 mM dl-dithiothreitol, pH 6.9) by shaking for 60 min on ice in an orbital shaker. The ribosome-bound status of nascent chains was tested by treatment with puromycin (Fig. 1d) added post-translationally (final concentration 0.5 mM), followed by incubation for 15 min at 37°C.
Generation of TF- and DnaK-free samples
In order to analyze nascent proteins in the absence of DnaK and TF, Δtig RNCs were incubated with 2 μM GrpE, 30 μM ATP, and 500 μM KCl (+G conditions). The presence of DnaK in resuspended RNCs was tested under −G and +G conditions by an additional ultracentrifugation/resuspension step.
Determination of DnaK and TF concentrations
Cell-free proteins were separated by SDS-PAGE (8% tris-glycine polyacrylamide gels) (43) and transferred to a PVDF membrane, followed by probing with mouse monoclonal anti-DnaK (Stressgen) or rabbit anti-TF (Genevaux & Hartl) polyclonal antibodies. Goat anti-rabbit or goat anti-mouse alkaline phosphatase conjugates (Novagen) were used as secondary antibodies. Protein bands were detected by chemiluminescence, using CDP-Star® substrate (Novagen) for TF and Lumi-Phos® substrate (Pierce) for DnaK. Band intensities were quantified by ImageJ (44) and converted to chaperone concentrations via a calibration curve correlating band intensities with intensities of protein standards (TF or DnaK) of known concentration. TF concentrations of apoMb samples range from 10 to 90 nM. DnaK concentrations of apoMb samples range from 20 to 65 nM in WT and Δtig samples. TF and DnaK concentrations of PIR samples and negative controls (either lacking DNA or reacted with puromycin) were 2-15 nM. To assess chaperone content per nascent chain, chaperone concentrations were divided by the corresponding relative fluorescence intensities evaluated at 123 MHz modulation frequency (Chronos Spectrofluorometer, ISS). Intensities were corrected by background subtraction and then divided by the value obtained for wild-type apoMb153 in each experiment, to ensure reliable cross-comparisons.
Fluorescence instrumentation and analysis
All measurements were performed at room temperature. Anisotropy decay data were collected by the multifrequency phase and modulation technique with a Chronos spectrofluorimeter (ISS) equipped with calcite prism polarizers and a laser diode (λex = 473 nm, λem > 510 nm with a 51294 filter, Newport Corp.-Oriel). Lifetime measurements were performed on all samples with vertically polarized excitation and 54.7° polarized emission. All frequency-domain fluorescence data were analyzed using the GLOBALS software package (45). A frequency-independent standard deviation of 0.2° for phase and 0.004 for modulation was applied. Lifetime curve fitting required three discrete components, one kept fixed to 0.001 ns to account for minor contributions from light scattering (less than 2% of total intensity). The frequency dependent G-factor was measured independently. Frequency-dependent polynomial corrections were applied to all phase and modulation data to take the G value into account. Depolarization data were fit to multiexponential decay expressions (Figure 3, panel a) including either two or three discrete components (10). In the case of two-components, only two terms, describing the fast (F) and slow (S) components, were included. The fractional amplitudes (FS and FF) and apparent rotational correlation time for the faster motion (τF) were allowed to vary while the fundamental anisotropy and the slow correlation time were fixed (r(0)=0.37, τs=1 μs). In all cases, a three-component expression was also considered, with an added term including FI and τI. The three component analysis was retained only if a significant improvement in fit quality was achieved (Table 1). Spectral simulations were performed with the Vinci software (ISS).
Fluorescence-detected gel electrophoresis
Puromycin-released chains were analyzed by SDS-PAGE with a three layer tris-tricine gel (15, 46). Low pH gels (47) were employed to reveal -/+ puromycin treated peptidyl-tRNAs.
Supplementary Material
ACKNOWLEDGMENTS
We thank D. Jameson, B. Barbieri, T. Hazlett, G. Kramer, S.I. Chan, J. Burstyn, L. Smith, R. Gourse and R. Fillingame for valuable advice, instrumentation and technical assistance. We are grateful to L. Randall, J. Crane, F.U. Hartl, P. Genevaux and I. Broutin for the gift of bacterial strains, plasmids and antibodies. This research was supported by NIH grant R21GM071012. J.P.E. was the recipient of an NIH Molecular Biophysics Training Fellowship (T32 GM08293).
Footnotes
Supporting INFORMATION
Supporting Information Available: This material is free of charge via the Internet.
References
- 1.Schuwirth BS, Borovinskaya MA, et al. Structures of the bacterial ribosome at 3.5 .ANG. resolution. Science. 2005;310:827–834. doi: 10.1126/science.1117230. [DOI] [PubMed] [Google Scholar]
- 2.Nissen P, Hansen J, et al. The structural basis of ribosome activity in peptide bond synthesis. Science. 2000;289:920–930. doi: 10.1126/science.289.5481.920. [DOI] [PubMed] [Google Scholar]
- 3.Harms J, Schluenzen F, et al. High Resolution Structure of the Large Ribosomal Subunit from a Mesophilic Eubacterium. Cell. 2001;107:679–688. doi: 10.1016/s0092-8674(01)00546-3. [DOI] [PubMed] [Google Scholar]
- 4.Baram D, Pyetan E, et al. Structure of trigger factor binding domain in biologically homologous complex with eubacterial ribosome reveals its chaperone action. Proc. Natl. Acad. Sci. U. S. A. 2005;102:12017–12022. doi: 10.1073/pnas.0505581102. [DOI] [PMC free article] [PubMed] [Google Scholar]
- 5.Ferbitz L, Maier T, et al. Trigger factor in complex with the ribosome forms a molecular cradle for nascent proteins. Nature. 2004;431:590–596. doi: 10.1038/nature02899. [DOI] [PubMed] [Google Scholar]
- 6.Teter SA, Houry WA, et al. Polypeptide Flux through Bacterial Hsp70: DnaK Cooperates with Trigger Factor in Chaperoning Nascent Chains. Cell. 1999;97:755–765. doi: 10.1016/s0092-8674(00)80787-4. [DOI] [PubMed] [Google Scholar]
- 7.Mayer M, Bukau B. Hsp70 chaperones: Cellular functions and molecular mechanism. Cell. Mol. Life Sci. 2005;62:670–684. doi: 10.1007/s00018-004-4464-6. [DOI] [PMC free article] [PubMed] [Google Scholar]
- 8.Deuerling E, Patzelt H, et al. Trigger Factor and DnaK possess overlapping substrate pools and binding specificities. Mol. Microbiol. 2003;47:1317–1328. doi: 10.1046/j.1365-2958.2003.03370.x. [DOI] [PubMed] [Google Scholar]
- 9.Kudlicki W, Odom OW, Kramer G, Hardesty B. Chaperone-dependent folding and activation of ribosome-bound nascent rhodanese. Analysis by fluorescence. J. Mol. Biol. 1994;244:319–331. doi: 10.1006/jmbi.1994.1732. [DOI] [PubMed] [Google Scholar]
- 10.Jameson DM, Hazlett TL. Time-resolved fluorescence in biology and biochemistry. Biophysical Biochemical Aspects of Fluorescence Spectroscopy. 1991:105–133. [Google Scholar]
- 11.Lakowicz JR, Gratton E, et al. Determination of time-resolved fluorescence emission spectra and anisotropies of a fluorophore-protein complex using frequency-domain phase-modulation fluorometry. J. Biol. Chem. 1984;259:10967–10972. [PubMed] [Google Scholar]
- 12.Jennings PA, Wright PE. Formation of a molten globule intermediate early in the kinetic folding pathway of apomyoglobin. Science. 1993;262:892–896. doi: 10.1126/science.8235610. [DOI] [PubMed] [Google Scholar]
- 13.Nishimura C, Dyson HJ, Wright PE. Identification of native and non-native structure in kinetic folding intermediates of apomyoglobin. J. Mol. Biol. 2006;355:139–156. doi: 10.1016/j.jmb.2005.10.047. [DOI] [PubMed] [Google Scholar]
- 14.Eliezer D, Wright PE. Is apomyoglobin a molten globule? Structural characterization by NMR. J. Mol. Biol. 1996;263:531–538. doi: 10.1006/jmbi.1996.0596. [DOI] [PubMed] [Google Scholar]
- 15.Bakke CK, Jungbauer LM, Cavagnero S. In vitro expression and characterization of native apomyoglobin under low molecular crowding conditions. Protein Expr. Purif. 2006;45:381–392. doi: 10.1016/j.pep.2005.08.001. [DOI] [PubMed] [Google Scholar]
- 16.Chow CC, Chow C, et al. Chain Length Dependence of Apomyoglobin Folding: Structural Evolution from Misfolded Sheets to Native Helices. Biochemistry. 2003;42:7090–7099. doi: 10.1021/bi0273056. [DOI] [PubMed] [Google Scholar]
- 17.Moncoq K, Broutin I, et al. SAXS Study of the PIR Domain from the Grb14 Molecular Adaptor. Biophys. J. 2004;87:4056–4064. doi: 10.1529/biophysj.104.048645. [DOI] [PMC free article] [PubMed] [Google Scholar]
- 18.Lill R, Crooke E, Guthrie B, Wickner W. The “trigger factor cycle” includes ribosomes, presecretory proteins and the plasma membrane. Cell. 1988;54:1013–1018. doi: 10.1016/0092-8674(88)90116-x. [DOI] [PubMed] [Google Scholar]
- 19.Raine A, Lovmar M, Wikberg J, Ehrenberg M. Trigger Factor Binding to Ribosomes with Nascent Peptide Chains of Varying Lengths and Sequences. J. Biol. Chem. 2006;281:28033–28038. doi: 10.1074/jbc.M605753200. [DOI] [PubMed] [Google Scholar]
- 20.Rutkowska A, Mayer MP, et al. Dynamics of Trigger Factor Interaction with Translating Ribosomes. J. Biol. Chem. 2008;283:4124–4132. doi: 10.1074/jbc.M708294200. [DOI] [PubMed] [Google Scholar]
- 21.Patzelt H, Rudiger S, et al. Binding specificity of E coli trigger factor. Proc. Natl. Acad. Sci. U. S. A. 2001;98:14244–14249. doi: 10.1073/pnas.261432298. [DOI] [PMC free article] [PubMed] [Google Scholar]
- 22.Kaiser CM, Chang H-C, et al. Real-time observation of trigger factor function on translating ribosomes. Nature. 2006;444:455–460. doi: 10.1038/nature05225. [DOI] [PubMed] [Google Scholar]
- 23.Ghosh J, Basu A, et al. Ribosome-DnaK interactions in relation to protein folding. Mol. Microbiol. 2003;48:1679–1692. doi: 10.1046/j.1365-2958.2003.03538.x. [DOI] [PubMed] [Google Scholar]
- 24.Schaffitzel E, Rudiger S, Bukau B, Deuerling E. Functional dissection of Trigger factor and DnaK: Interactions with nascent polypeptides and thermally denatured proteins. Biol. Chem. 2001;382:1235–1243. doi: 10.1515/BC.2001.154. [DOI] [PubMed] [Google Scholar]
- 25.Lakowicz JR. Principles of Fluorescence Spectroscopy. Springer Science; New York: 2006. [Google Scholar]
- 26.Maier R, Eckert B, et al. Interaction of trigger factor with the ribosome. J. Mol. Biol. 2003;326:585–592. doi: 10.1016/s0022-2836(02)01427-4. [DOI] [PubMed] [Google Scholar]
- 27.Mally A, Witt SN. GrpE accelerates peptide binding and release from the high affinity state of DnaK. Nat. Struct. Biol. 2001;8:254–257. doi: 10.1038/85002. [DOI] [PubMed] [Google Scholar]
- 28.Verkman AS. Solute and macromolecule diffusion in cellular aqueous compartments. Trends Biochem. Sci. 2002;27:27–33. doi: 10.1016/s0968-0004(01)02003-5. [DOI] [PubMed] [Google Scholar]
- 29.Tomic S, Johnson AE, Hartl FU, Etchells SA. Exploring the capacity of trigger factor to function as a shield for ribosome bound polypeptide chains. FEBS Lett. 2006;580:72–76. doi: 10.1016/j.febslet.2005.11.050. [DOI] [PubMed] [Google Scholar]
- 30.Hoffmann A, Merz F, et al. Trigger Factor Forms a Protective Shield for Nascent Polypeptides at the Ribosome. J. Biol. Chem. 2006;281:6539–6545. doi: 10.1074/jbc.M512345200. [DOI] [PubMed] [Google Scholar]
- 31.Clark PL, King J. A Newly Synthesized, Ribosome-bound Polypeptide Chain Adopts Conformations Dissimilar from Early in Vitro Refolding Intermediates. J. Biol. Chem. 2001;276:25411–25420. doi: 10.1074/jbc.M008490200. [DOI] [PubMed] [Google Scholar]
- 32.Gilbert R, Fucini P, et al. Three-dimensional structures of translating ribosomes by Cryo-EM. Mol. Cell. 2004;14:57–66. doi: 10.1016/s1097-2765(04)00163-7. [DOI] [PubMed] [Google Scholar]
- 33.Hsu S-TD, Fucini P, et al. Structure and dynamics of a ribosome-bound nascent chain by NMR spectroscopy. Proc. Natl. Acad. Sci. U. S. A. 2007;104:16516–16521. doi: 10.1073/pnas.0704664104. [DOI] [PMC free article] [PubMed] [Google Scholar]
- 34.Cavagnero S, Kurt N. Folding and Misfolding as a Function of Polypeptide Chain Elongation. In: Murphy R, Tsai A, editors. Misbehaving Proteins: Protein (Mis)Folding, Aggregation and Stability. Springer; 2006. pp. 217–246. [Google Scholar]
- 35.Gesteland RF. Isolation and characterization of ribonuclease I mutants of Escherichia coli. J. Mol. Biol. 1966;16:67–84. doi: 10.1016/s0022-2836(66)80263-2. [DOI] [PubMed] [Google Scholar]
- 36.Genevaux P, Keppel F, et al. In vivo analysis of the overlapping functions of DnaK and trigger factor. EMBO Rep. 2004;5:195–200. doi: 10.1038/sj.embor.7400067. [DOI] [PMC free article] [PubMed] [Google Scholar]
- 37.Odom OW, Kudlicki W, Hardesty B. In Vitro Engineering Using Acyl-Derivatized tRNAs. Methods Mol. Biol. 2000;77 doi: 10.1385/0-89603-397-X:93. [DOI] [PubMed] [Google Scholar]
- 38.Gao W, Goldman E, Jakubowski H. Role of Carboxy-Terminal Region in Proofreading Function of Methionyl-tRNA Synthetase in E coli. Biochemistry. 1994;33:11528–11535. doi: 10.1021/bi00204a015. [DOI] [PubMed] [Google Scholar]
- 39.Hardesty B, Kramer G, Ramachandiran V. Cotranslational incorporation of chemically modified initiator tRNA. Rec. Res. Dev. Anal. Biochem. 2001;1:39–48. [Google Scholar]
- 40.Gite S, Mamaev S, Olejnik J, Rothschild K. Ultrasensitive Fluorescence-Based Detection of Nascent Proteins in Gels. Anal. Biochem. 2000;279:218–225. doi: 10.1006/abio.1999.4472. [DOI] [PubMed] [Google Scholar]
- 41.Ho Y-S, Wai Kan Y. In vivo aminoacylation of human and Xenopus suppressor tRNAs contructed by site-specific mutagenesis. Proc. Natl. Acad. Sci. U. S. A. 1987;84:2185–2188. doi: 10.1073/pnas.84.8.2185. [DOI] [PMC free article] [PubMed] [Google Scholar]
- 42.Spedding G. Isolation and analysis of ribosomes from prokaryotes, eukaryotes and organelles. In: Spedding G, editor. Ribosomes and Protein Synthesis: A Practical Approach. Oxford University Press; Oxford, United Kingdom: 1990. pp. 1–27. [Google Scholar]
- 43.Sambrook J, Fritsch EF, Maniatis T. Molecular Cloning: a laboratory manual. 2nd ed. Cold Spring Harbor Laboratory Press; Cold Spring Harbor, NY: 1989. [Google Scholar]
- 44.Abramoff MD, Magelhaes PJ, Ram SJ. Image Processing with ImageJ. Biophotonics International. 2004;11:36–42. [Google Scholar]
- 45.Beechem JM, Gratton E. Fluorescence Spectroscopy Data Analysis Environment A Second Generation Global Analysis Program. In: Lakowicz J, editor. Time-Resolved Laser Spectroscopy in Biochemistry. SPIE; 1988. pp. 70–81. [Google Scholar]
- 46.Schagger H, von Jagow G. Tricine-sodium dodecyl sulfate-polyacrylamide gel electrophoresis for the separation of proteins in the range from 1 to 100 kDa. Anal. Biochem. 1987;166:368–379. doi: 10.1016/0003-2697(87)90587-2. [DOI] [PubMed] [Google Scholar]
- 47.Kirchdoerfer RN, Huang JJ-T, Isola MK, Cavagnero S. Fluorescence-Based Analysis of Aminoacyl- and Peptidyl-tRNA by Low-pH SDS PAGE. Anal. Biochem. 2007;364:92–94. doi: 10.1016/j.ab.2007.01.019. [DOI] [PMC free article] [PubMed] [Google Scholar]
- 48.Vega C, Kurt N, et al. Binding Specificity of an Alpha-Helical Protein to Full Length Hsp70 Chaperone and Its Minimal Substrate Binding Domain. Biochemistry. 2006;45:13835–13846. doi: 10.1021/bi061432a. [DOI] [PubMed] [Google Scholar]
Associated Data
This section collects any data citations, data availability statements, or supplementary materials included in this article.