

Abstract
Objectives
The purpose of this study was to assess a new signal-processing strategy, Spatiotemporal Pattern Correction (SPC), for a group of listeners with varying degrees of sensorineural hearing loss. SPC is based on a physiological model of the level-dependent temporal response properties of auditory nerve (AN) fibers in normal and impaired ears. SPC attempts to “correct” AN response patterns by introducing time-varying group delays that differ across frequency channels. Listeners’ speech intelligibility and preference judgments were obtained at different strengths of SPC processing.
Design
Fifteen listeners, 12 with bilateral sensorineural hearing loss and 3 with normal hearing, participated in this study. Listeners with hearing impairment were separated into 3 groups (mild, moderate, and moderate-to-severe), based on their pure-tone averages at 0.5, 1, 2, and 4 kHz. All preference judgments were made using sentences from the Hearing-In-Noise-Test (HINT). The sentences were processed at five SPC strengths (1.0, 1.1, 1.2, 1.3, and 1.4). At an SPC strength of 1.0, the speech was processed through the SPC signal processor, becoming bandlimited, but no dynamic group delays were added to the signal. On each trial, listeners were presented a single sentence at two different SPC strengths, 1.0 (uncorrected) and a randomly selected SPC strength. Listeners were instructed to identify which of the two sentences they preferred. Sixteen vowel-consonant syllables, a subset of the Nonsense Syllable Test (NST), were used to assess speech intelligibility at three SPC strengths (1.0, 1.1, and 1.2). Listeners were asked to push one of 16 buttons on a response box that corresponded to the vowel-consonant syllable they heard. The moderate-to-severe hearing loss group was also tested using the low-probability sentences of the Speech-Perception-In-Noise (SPIN) test.
Results
Listeners with normal hearing and listeners with mild hearing loss preferred the quality of uncorrected sentences (SPC strength of 1.0) compared with SPC-processed sentences. As the strength of SPC increased, listeners’ preference for uncorrected sentences also increased. Listeners with moderate and moderate-to-severe hearing loss had difficulty differentiating between uncorrected and lower strength SPC-processed sentences but strongly preferred the uncorrected sentences as compared with high strength SPC-processed sentences. Vowel-consonant intelligibility was not improved or degraded by SPC. Sentence recognition scores for listeners with moderate-to-severe hearing loss decreased with SPC processing.
Conclusions
Although SPC-processed speech was not preferred by listeners with hearing loss, the listeners with a more moderate degree of impairment could not differentiate the unprocessed sentences from the SPC processed sentences. Speech intelligibility was not improved by SPC processing.
Spatiotemporal pattern correction (SPC) is a physiologically based signal-processing scheme that was introduced by Shi, Carney & Doherty (2006). This algorithm was developed to compensate for the loss of cochlear nonlinearity observed in listeners with sensorineural-hearing loss. The signal processing of SPC is based on signal-processing style (or phenomenological) physiological models of the auditory system (e.g., Heinz, Zhang, Bruce & Carney, 2001; Zhang, Heinz, Bruce, & Carney, 2001).
It is well known that a normal ear has sharply tuned peripheral filters, but the auditory filters in an impaired ear are broadly tuned (e.g., Dubno & Schaefer, 1995; Florentine, Buus, Scharf, & Zwicker, 1980; Leek & Summers, 1993; Moore, 1985; Moore, Vickers, Plack, & Oxenham, 1999; Nelson, 1991; Oxenham & Bacon, 2003; Turner & Henn, 1989). In a normal ear, auditory filters can fluctuate between being sharply tuned for low-level inputs and broadly tuned for high-level inputs. Changes in gain accompany these changes in tuning or bandwidth; the ear provides more gain for low-level sounds and less gain for high-level sounds (Fig. 1). This nonlinear dynamic property of the normal ear is reduced or absent in an ear with a sensorineural impairment. In the impaired ear, the auditory filters are relatively broad regardless of input level and less gain is provided for low-level input sounds.
Fig. 1.

Schematic illustration of level-dependent changes in magnitude and phase properties of peripheral filters. Solid lines represent filter properties at low SPLs; dashed lines represent high SPLs. The gain and bandwidth vary more with level in the normal ear than in the impaired ear. Similarly, changes in the phase properties of the filter vary more as a function of sound level in the normal ear than in the impaired.
Gain is not the only property that covaries with filter bandwidth. Changes in filter shape also result in changes in the phase and build-up time of the filters. Sharply tuned filters have long build-up times, whereas broadly tuned filters have short build-up times. The build-up time of a filter is proportional to the filter’s group delay, which is the overall delay imposed on a signal that passes through a filter due to the filter’s tuning properties. Because the shape of filters in the normal ear dynamically change as a function of input level, in normal ears group delay constantly fluctuates between short and long delays (Fig. 2). In contrast, the group delay of the impaired ear varies much less with differences in sound pressure level (SPL). The differences in group delay properties between normal and impaired ears may account for some of the difficulty that listeners with hearing impairment have understanding speech (Greenberg, Aria, & Silipo, 1998).
Fig. 2.

Illustration of level-dependent group delay for normal and impaired ears. Left: Impulse responses of filters in the normal (top panel) and impaired (bottom panel) periphery. The impulse response of the filter depends on how sharply tuned the filter is (filter functions shown at the right). Broad filters have a short build-up time, whereas sharp filters have a long build-up time. The build-up time is proportional to the group delay; the vertical lines show the group-delay approximation for gammatone filters used in the SPC system. In the normal ear, the group delay constantly fluctuates between the low- and high-SPL group-delay values (see arrow labeled dynamic group delay). In the impaired ear, the group delay varies much less across SPLs (vertical lines are closer to each other). However, by adding a dynamic delay (SPC), the normal dynamic group delay can be approximated on the output of the impaired filter.
Currently, gain is the primary factor that is compensated by hearing aids. Most modern hearing aids provide nonlinear gain known as Wide Dynamic Range Compression (WDRC). WDRC was designed to compensate for the loss of cochlear nonlinearity in the impaired ear and improve a listener’s perception of amplified sound by providing more gain to low-level inputs and less gain to high-level inputs. This strategy maximizes a listener’s dynamic range of hearing and thereby increases the comfort of amplified sounds for listeners with hearing loss (e.g., Boothroyd, Springer, Smith, & Schulman, 1988). Interestingly, most studies that have compared WDRC to linear amplification have not shown significant improvements in objective or subjective measures (Humes, Humes, & Wilson, 2004; Shanks, Wilson, Larson, & Williams, 2002; Walden, Surr, Cord, & Olson, 2000), possibly due to the fact that most testing done in controlled laboratory settings uses moderate input levels, for which WDRC and linear amplification potentially provide very similar gains. Nevertheless, there have been studies that indicate the benefits of WDRC with respect to both listener satisfaction and speech intelligibility in comparison to linear circuitry (Gatehouse, Naylor, & Elberling, 2006; Jenstad, Seewald, Cornelisse, & Shantz, 1999; Marriage, Moore, Stone & Baer, 2005).
Shi et al. (2006) presented SPC as an alternative approach to compensate for the loss of cochlear nonlinearity in the impaired ear. They tested a small group of subjects and showed that some subjects’ Nonsense Syllable Test (NST; Dubno & Schaefer, 1995) scores were improved when the speech was processed with SPC. Also, several of the subjects with hearing loss preferred the quality of the SPC processed speech compared to the unprocessed speech.
The primary purpose of this study was to test SPC on a group of listeners with various degrees and configurations of sensorineural-hearing loss. Also, given the limited improvement found in Shi et al. (2006), another goal of the current study was to adjust specific parameters in the SPC processor to maximize its performance.
Methods
Subjects
A total of 15 listeners (3 with normal hearing and 12 listeners with sensorineural-hearing loss) participated in the current study. Pure-tone audiometric thresholds were recorded via a GSI-16 audiometer (Grason-Stadler; Madison, Wisc.) using standard audiometric procedures (ANSI, 2004) at octave frequencies between 250 and 8000 Hz. Listeners with normal hearing (3 females) with a mean age of 51 yr (ranging from 22 to 68 yr) had hearing thresholds less than 20 dB HL at the octave frequencies between 250 and 4000 Hz (ANSI, 2000). The 12 listeners with sensorineural-hearing loss (4 female and 8 male) had a mean age of 64 yr (ranging from 21 to 84 yr) and were assigned to one of three groups based on their pure-tone average threshold (PTA), which was the average of thresholds at 500, 1000, 2000, and 4000 Hz (see Fig. 3). Four listeners were assigned to the mild hearing loss group (PTA <35 dB HL); 5 to the moderate hearing loss group (PTA <45 dB HL); and 3 to the moderate-to-severe hearing loss group (PTA >55 dB HL). Air-bone gaps were ≤15 dB for all listeners.
Fig. 3.

Average binaural audiometric data for all 12 listeners with hearing loss. Averaged audiometric data is also shown for the normal-hearing listeners (top left). Listeners with hearing loss were separated into three hearing loss groups; listeners in the mild group had a PTA <35 dB HL (top right), those in the moderate group had a PTA <45 dB HL (bottom left), and those listeners in the moderate-severe group had a PTA >55 (bottom right).
Listeners’ word-recognition scores (WRS) were obtained in quiet and in noise using a recorded version of the Northwestern University Test No. 6 (NU-6; Tillman & Carhart, 1966). Words were presented via TDH-49 headphones at 30 dB re: the listener’s speech reception threshold (SRT). This was adjusted when listeners reported that the stimuli were too loud. Speech was presented in a speech-shaped noise at a +10-dB signal-to-noise ratio (SNR). The speech-in-noise test was repeated at +15-dB SNR if a listener’s speech-in-noise score was 30% lower than their quiet scores. Stimuli were never presented above a listener’s loudness discomfort level (LDL). LDLs were measured binaurally at 750, 1500, and 3000 Hz (Bentler & Nelson, 2001) and for conversational speech using monitored live voice. No frequency shaping was used for any speech testing throughout this paper, except where mentioned below.
Distortion product otoacoustic emission (DPOAE) testing was conducted in both ears using the ILO88 system and standard ILO probe tips (Otodynamics; London, England). The frequencies of the primaries (F1 and F2) were fixed at a F1/F2 ratio of 1.22. The F2 frequency ranged from 1000 to 4000 Hz, in half-octave steps. The levels of the primaries were fixed at 65 and 55 dB SPL for F1 and F2, respectively. These levels have been shown to be effective in assessing auditory status regardless of an individual listener’s threshold (Dhar, Long, & Culpepper 1998; Gaskill & Brown, 1990; Gorga, Neely, Ohlrich, et al., 1997). Averaging was continued at each frequency until noise estimates were below -10 dB SPL or until 30 sec of artifact-free averaging had elapsed. Listeners were considered to have present DPOAEs if they had an emission greater than -5 dB SPL with a SNR of at least 10 dB SPL for at least two of the frequencies tested. Each listener had normal middle-ear function the day of DPOAE testing (Wiley, Oviatt, & Block, 1987). Normal middle-ear function was defined as a normal 226-Hz tympanogram as measured with a GSI TympStar (Grason-Stadler; Madison, Wisc.).
Procedures
Listeners were seated in a double-walled sound-treated booth and presented stimuli using a custom-made loudspeaker that had a flat frequency response through 10,000 Hz that was placed 1 meter from the listener. All speech stimuli were presented using a personal computer with a Tucker Davis Technology (TDT) System II acoustic system. A programmable attenuator (TDT PA4) and Crown D-75A amplifier were used to adjust the level of the stimulus. For all listeners stimulus levels were initially set to 30 dB re: SRT. Two listeners requested that the level be decreased 5 and 10 dB, respectively, to reach their comfortable listening level.
A listening preference test was used to determine the range of SPC strengths used to test each listener. In the preference test, listeners were asked to complete a two-alternative forced choice task (2AFC) to compare a single sentence from the Hearing-in-Noise-Test (HINT; Nilsson, Soli, & Sullivan, 1994) that was processed at an SPC strength of 1.0 (processed with no correction) and at one of four SPC strengths (1.1, 1.2, 1.3, or 1.4) presented in random order. Six different HINT sentences were randomly used throughout testing. Listeners were instructed to identify which of the two sentences they “preferred.” If SPC 1.0 was preferred, a sign of -1 was assigned for that specific preference trial. If one of the four SPC strengths was preferred, a sign of +1 was assigned to the trial. After each trial, the listener was then asked to rank their preference judgment. Four choices were available to the listener, no difference [value = 0 (indicating that the listener could not hear a difference between the two sentences, yet was forced to choose in the 2AFC task)], slight preference (value = 1), moderate preference (value = 2), and strong preference (value = 3) (Hansen, 2002). For each trial, the sign [-1 or + 1 (dependent on which sentence was preferred in the 2AFC task)] and a value of 0, 1, 2, or 3 (the preference rank) were multiplied and resulted in the score for each trial. Preference judgments were made based on a total of 108 trials (4 blocks × 27 trials). In each block the uncorrected SPC (1.0) was compared with one of the four SPC strengths. The four blocks of SPC strengths were presented in random order across listeners. Listeners’ most preferred SPC strength was defined as the SPC strength they selected the greatest number of times.
Speech intelligibility was tested using a subset of the NST. Specifically, the vowel /i/ was coupled with one of the following 16 consonants: /p/, /b/, /t/, /d/, /k/, /g/, /f/, /v/, /θ/, /ð/, /s/, /z/, /ʃ/ /ʒ/, /m/, and /n/ spoken by a female speaker. The 16 vowel-consonant (VC) syllables were processed at three SPC strengths, 1.0 (processed with no correction), the listener’s preferred SPC strength, and at one SPC strength higher than their preferred strength. For example, if a listener preferred an SPC strength of 1.1, then they would be tested at SPC strengths of 1.0, 1.1, and 1.2. Overall percent-correct scores were based on 400 trials (16 syllables × 25 trials) for each SPC strength. Therefore, listeners were presented a total of 1200 trials (16 syllables × 3 SPC strengths × 25 trials).
In addition to the standard testing described above there were two additional conditions tested. Given that there was no general frequency shaping imposed on the NST stimuli, listeners’ performance may have been limited if they had a steeply sloping hearing loss. The listener with the most steeply sloping hearing loss (subject HI8) performed the NST task with and with out his hearing aids (Oticon Gaias). HI8 was tested with his hearing aids set at his typical user settings, which provided adequate gain and frequency shaping as was confirmed using real-ear measurements (AudioScan Verifit) (AudioScan; Dorchester, Ontario, Canada). The NST stimuli were presented at a normal conversational level (65 dB SPL).
Testing in this study was performed using NST stimuli, which can be analyzed for acoustic perceptual errors, but is not the typical type of speech material a listener would hear everyday. Therefore, three listeners (subjects HI7, HI8, and HI12), in the moderate-to-severe hearing loss group, performed an additional speech-intelligibility test using the low-probability sentences from the Speech-Perception-in-Noise (SPIN) test (Bilger, Nuetzel, Rabinowitz, & Rzeczkowski, 1984). The high-probability sentences were not included to avoid ceiling effects. Sentences were presented in quiet and listeners were asked to repeat the last word in the sentence and write it on an answer sheet. A written-answer response was chosen to prevent examiner errors in interpreting the listener’s spoken response. Post hoc scoring compared examiner’s recorded words with those the listener wrote down. The SPIN sentences were processed at three SPC strengths, 1.0 (processed with no correction), and at two higher SPC strengths, 1.1 and 1.2. A total of 90 sentences (30 sentences × 3 SPC strengths) were randomly presented to each listener.
SPC Signal Processing
A detailed description of the original SPC signal processor can be found in Shi et al. (2006). A description of the SPC processor and changes made to the processor’s parameters for this study are discussed below. In general, SPC is based on the level-dependent temporal response properties of auditory nerve (AN) fibers in normal and impaired ears (Heinz et al., 2001). The SPC signal processor computes level-dependent temporal response properties of healthy and impaired AN fibers by using a nonlinear AN model with compression (Heinz et al., 2001). The SPC signal processor varies compression as a function of center frequency through the use of this AN model. The temporal property that SPC focuses on is group delay. Group delay is related to the bandwidth of a filter in that it is a measure of the overall delay of a signal that passes through the filter. This delay varies with bandwidth, and thus is a fundamental temporal property that changes with sound level in the normal ear, but changes minimally in an impaired ear. The differences in group-delay properties between normal and impaired ears were computed for 64 different characteristic frequency (CF) AN-fiber channels. In an attempt to “correct” for the abnormal spatiotemporal response pattern in the impaired ear the difference between the group delay of the healthy and impaired AN fibers at all 64 CFs was determined, and the SPC processor introduced the group delay differences in each frequency channel below 2000 Hz.
The SPC signal processor consists of two signal-processing paths (Fig. 4). The first path consists of the AN model with compression (Heinz et al., 2001) that is based on a healthy auditory system. The AN model includes compression because the signal path that controls the AN tuning bandwidth saturates as a function of sound level (this saturation is presumably related to the saturation of outer hair cells). The compression within the AN model results in level-dependent cochlear amplification. The AN model’s compression includes changes in the gain, bandwidth, and phase properties of AN filters as a function of stimulus level for each frequency channel. The time-varying slope of the phase function of each model AN fiber is proportional to the timevarying group delay in that channel for a normal ear. AN fibers of impaired ears have less compressive nonlinearity and thus are less dynamic, resulting in more static gain, bandwidth and phase properties as a function of stimulus level. The loss of cochlear nonlinearity leads to less dynamic group delay in each channel for impaired ears. The goal of SPC is to restore the loss of dynamic group delays in the impaired auditory system.
Fig. 4.

Schematic diagram of low-frequency SPC system. Based on the auditory nerve model (Heinz et al., 2001; Zhang et al., 2001), the control pathways (left) computed the amount of correction in group delay and then submitted it to the analysis-synthesis filter bank (right) where the correction was applied to frequency channels lower than 2000 Hz. The “corrected” stimulus was then created by re-synthesis.
In the first path of the signal processor the speech stimulus gets passed through the AN model. The AN model consists of 64 AN fiber models tuned to different frequencies with two filters per equivalent rectangular bandwidth (ERB). The “correction” (i.e., the time-varying delay to be inserted in each frequency channel) is calculated as the difference between the group delay expected for a normal AN fiber with a given characteristic frequency (CF) and the group delay expected for an impaired AN fiber of the same CF. Group delay for an impaired filter is always smaller than that of a healthy filter, because broad filters have shorter build-up times. Therefore, SPC always resulted in an inserted delay. These corrections are only applied to the frequency channels below 2000 Hz. The dynamic changes in group delay associated with the compressive nonlinearity are smaller at high frequencies (>2000 Hz). In informal tests, these changes at high frequencies were not detectable by listeners with normal hearing, and thus they were not included in the SPC processing.
The SPC “strength” is referred to as the reciprocal of the fraction of the normal compressive nonlinearity that remains in the impaired model AN fibers used in the calculations. For example, SPC strength based on AN models with only 80% of normal compressive nonlinearity would require an SPC strength of 1/0.80, or 1.25, for restoration of the spatio-temporal response to that expected for the healthy ear. It has been suggested that outer hair cell loss accounts for 64 to 100% of hearing losses up to 65 dB HL (Moore & Glasberg, 2004), based on a model for loudness perception. However, there is not a well described relationship between a given amount of hearing loss and the decrease in cochlear amplification. Therefore, our strategy was to test each listener across a range of SPC strengths.
The level-dependent and time-varying corrections were computed for every time point during the stimulus and for each frequency channel. SPC strengths were the same across all frequency channels; however, the effective correction was not. This was due to the fact that the amount of nonlinearity SPC compensates for is frequency-dependent. For example, in Figure 5, the inserted delays of four frequency channels (10, 14, 18, and 22) for the syllable /iʒ/ are different for a single SPC strength of 1.3. This center-frequency dependence of compression is incorporated into the AN model used in the SPC signal processor. The inserted time-varying corrections that the SPC signal processor imposed on the signal are very small as can be seen by comparing the time waveforms of the four frequency channels. The corrections were made by inserting time-shifts (in units of stimulus time samples, either 22.7 μsec or 30.3 μsec, see below). Because these small time delays were inserted, as required, after each time sample, unwanted audible distortion due to discontinuities in the waveform was minimal. Figure 6 illustrates the spectrograms and the time waveforms for the VC syllable /it/ processed at three different SPC strengths (1.0, 1.2, and 1.4). Two short time segments of each time waveform (A and B) were replotted below the original time waveforms for ease of comparison between the three SPC strengths.
Fig. 5.

Delays introduced by the SPC signal processor at four different channels (10, 14, 18, and 22) for the portion of the vowel part of the syllable /iʒ/ at a SPC strength of 1.3.
Fig. 6.

Effect of SPC processing on VC syllable /it/. The top and middle panels show the spectrograms and time waveforms, respectively, for the VC syllable processed at three SPC strengths (1.0, 1.2, and 1.4). The bottom panel shows two different short time segments of the VC syllable /it/,comparing the effects of SPC (1.0, 1.2, and 1.4 time waveforms are shown in black, dark gray, and light gray, respectively).
In the second path of the signal processor the speech stimulus was passed through a rectangular filter bank with the same center frequencies as in the first path (64 channels, 2 filters/ERB). The time-varying delays provided by the first path (i.e., for each frequency channel with the same center frequency and equivalent rectangular bandwidth) were inserted into the corresponding channels in the second path. The time-varying delays were intended to change the spatio-temporal response of an impaired ear to better match that of a normal ear. While being passed through the second path of the processor, the stimulus was also bandlimited to an upper cutoff frequency of 11,000 Hz. This output was then re-synthesized, combining the signals across the frequency channels to result in the “corrected” stimulus.
In the current paper several changes were made to the original SPC processor that was used in Shi et al. (2006). Gammatone analysis and synthesis filter banks (Hohmann, 2002) were used in the second path in Shi et al. (2006); in the present paper, rectangular filters were used in the analysis and reconstruction filter banks. Rectangular filters have less overlap between the filters compared with gammatone filters, which should reduce cross-talk between the frequency channels. Rectangular filters were implemented as FIR filters of length 600. A second change was related to the symmetry of the nonlinear function used to introduce compression in the AN model. In the original processor, both positive and negative parts of the signal were compressed symmetrically at the output of the AN-model control path (Zhang et al., 2001). The symmetrical compression resulted in an introduction of high-frequency components due to a frequency-doubling in the control-path signal. In the present study, the AN model had compression only for positive pressures, and the compression was gradually reduced for stimulus levels below 0 Pa. The asymmetric compression resulted in a smoother variation in the output of the AN-model control path. Unfortunately, there is currently not sufficient evidence from physiological experiments to determine which of these strategies is more accurate. The changes made to the signal processor for the experiments in this paper were systematically tested on eight listeners with hearing loss. The changes made were preferred by listeners in preliminary testing.
SPC stimuli were processed using MATLAB (Mathworks; Natick, MA). Preference and SPIN stimuli were processed at a 44.1-kHz sampling rate and the NST stimuli were processed at a 33-kHz sampling rate, the same sampling rates used when the original stimuli were created. All speech stimuli were presented at the input to the SPC system at 65 dB SPL, which was chosen to be representative of sound levels typically experienced in conversational speech. Processed stimuli were presented to subjects at a level that made the entire speech signal audible without exceeding their LDL for all listeners except HI8. This listener had a severely sloping hearing loss and audibility was attempted but could not be insured without frequency shaping.
Results
Preference Scores
Results from listeners’ preference judgments are shown in Figure 7. For ease of comparing across listeners’ preference scores, the scores were normalized by taking the sum of the absolute value of each listener’s total SPC preference score on each condition (1.1, 1.2, 1.3, and 1.4) and dividing it by the sum of the absolute values of the listener’s scores on all four of the SPC preference conditions. Thus, the sum of the normalized score for all conditions equaled 1.0. Recall that if a listener selected SPC 1.0 (processed with no correction) as their preferred sentence their preference scores were assigned a negative value. Thus, positive values indicate a favorable SPC preference, while negative values indicate a lack of preference for SPC processing. Therefore, the negative values were reinstated after the scores were normalized to demonstrate the direction of the listeners’ preference judgments (e.g., in favor or against SPC processing). The preference judgments in Figure 7 are plotted as normalized preference scores, whereby 0.0 indicates listeners’ had no preference for either sentence (i.e., they were unable to perceive a difference between the two sentences). All listeners with normal hearing and mild hearing loss consistently gave their highest preference scores to the uncorrected sentences (processed at 1.0) compared with sentences processed with SPC strengths between 1.1 and 1.4 (top panels, Fig. 7), as indicated by the predominately negative scores. As the SPC strength increased, the strength of their preference for the uncorrected sentence increased. Listeners in the moderate and moderate-to-severe hearing loss groups could not clearly differentiate between the uncorrected sentences and those processed at low SPC strengths (bottom panels, Fig. 7). However, these listeners strongly preferred the uncorrected sentences when compared to sentences processed at higher SPC strengths.
Fig. 7.
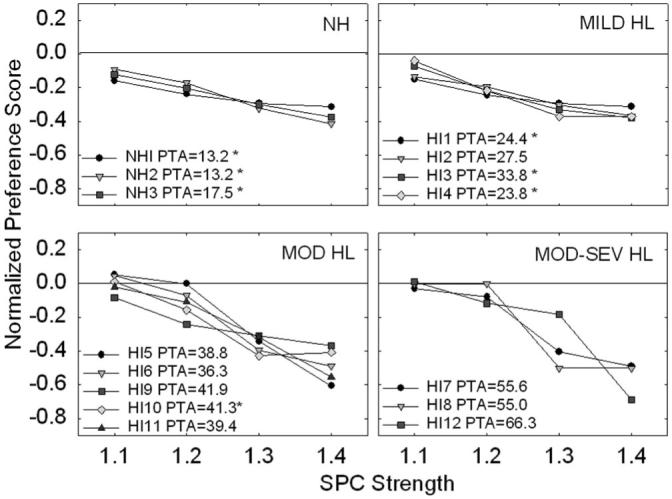
Individual normalized preference test results for all 15 listeners. Listeners are divided up by listening groups. Listeners PTAs are indicated in the legend of each subplot. A star (*) symbol next to the listener’s PTA is indicative of the listener having present OAEs (as defined in the manuscript). The abscissa indicates the four SPC conditions that are each compared with an SPC strength of 1.0. The line in each subplot at 0.0 designates no preference between the two conditions being compared; in other words, the listeners were unable to hear a difference between the two conditions.
NST Speech Intelligibility Scores
Given the listener’s lack of preference for higher SPC strengths (1.3 and 1.4), the two lowest SPC strengths (1.1 and 1.2) were used for all speech-intelligibility testing. Means and standard errors for the groups of listeners’ VC intelligibility scores are shown in Figure 8 for three SPC strengths. The figure shows that, overall, SPC signal processing did not significantly improve or degrade listeners’ perception of VC syllables. However, one listener (HI12) did show benefits from processing (see below). As was expected, as degree of hearing loss increased overall percent-correct scores decreased and variance within groups increased.
Fig. 8.

Averaged group results for VC intelligibility testing. Listeners were separated into four listening groups based on their PTAs, as described in the text. Error bars indicate 1 standard error of the mean.
HI12
One listener (HI12) in the moderate-to-severe hearing loss group obtained her highest NST intelligibility score with an SPC processing strength of 1.1. Her overall NST scores were 53%, 61.3%, and 59.3% at 1.0, 1.1, and 1.2 SPC strengths, respectively. The greatest improvements were as large as 52% and 44% for the VC syllables /is/ and /iʒ/, respectively. Although SPC either improved or minimally changed listener HI12′s VC recognition, a 28% decrease was observed in her recognition of the VC /in/.
Aided NST Speech Intelligibility Scores
Frequency shaping would have likely had the greatest affect on listeners who have a more steeply sloping hearing loss. Listener HI8 had the most severely sloping hearing loss out of all 12 listeners with hearing loss. Therefore, this listener was retested on the NST intelligibility test while wearing his hearing aids. Real-ear measurements demonstrated that his hearing aids were providing appropriate gain and frequency shaping for his degree and configuration of hearing loss. The output of the hearing aids closely matched targets prescribed by NAL-NL1 (National Acoustics Laboratories; Chatswood, Australia). Unaided and aided NST scores for listener HI8 were very similar with and without frequency shaping across SPC strengths (Fig. 9). The largest difference seen between unaided and aided NST scores was for an SPC strength of 1.2. For this SPC strength, HI8′s unaided score was 37.5% correct, whereas HI8′s aided score slightly increased to 43.5% correct. Overall, it did not appear that frequency shaping had an affect on SPC signal processing.
Fig. 9.

VC recognition was tested with and without hearing aids for the listener with the most severely sloping loss (HI8) in the study to ensure that frequency shaping was not playing a role in this listener’s performance. Results from aided and unaided conditions are almost identical.
SPIN Speech Intelligibility Scores
Three listeners (HI7, HI8 and HI12) from the moderate-to-severe group who were previously tested on the NST (results in Fig. 8) were tested again using low probability SPIN sentences. Results for the SPC processed VC syllables were different from those obtained for the SPC processed sentences (Figure 10). SPC processed sentence recognition decreased 15 to 30% at an SPC strength of 1.2 compared with uncorrected (1.0), whereas relatively small changes in percent correct scores were observed across SPC strengths for the NST.
Fig. 10.

The three listeners in the moderate-to-severe hearing loss group were tested using the low probability SPIN sentences. The PTA of each listener is shown in the upper right-hand corner of each subplot. Unlike the results from the VC intelligibility testing, listeners’ recognition scores decreased with increasing SPC strengths. Note that the y-axes of the three subplots are scaled for each listener’s individual scores.
Word Recognition Scores
Recognition scores of the listeners with hearing loss for unprocessed NU-6 words ranged from 52 to 100% in quiet and from 28 to 88% in noise. There was no relationship between listeners’ word recognition scores and their performance on the NST speech intelligibility SPC task. That is, SPC had the same affect on listeners’ speech intelligibility with low recognition scores as it did on listeners with high recognition scores.
Discussion
In this study, a physiologically based signal-processing strategy, SPC, was evaluated in listeners with varying degrees of hearing loss. The SPC signal processor introduces different time-varying group delays in frequency channels below 2000 Hz. The delays are intended to “correct” the spatio-temporal response of an impaired ear to better match that of a normal ear. Listeners with normal hearing and listeners with mild hearing loss consistently preferred the sound quality of unprocessed sentences compared to SPC processed sentences. Listeners with moderate and moderate-to-severe hearing loss had difficulty differentiating between unprocessed sentences and sentences processed at low SPC strengths (1.1 and 1.2). However, all listeners preferred the unprocessed sentences more than the SPC processed sentences at higher SPC strengths (1.3 and 1.4). Overall percent-correct recognition scores for VC syllables and sentences did not improve with SPC signal processing.
It has been shown that a strong relationship exists between group delay and cochlear nonlinearity (Carney, 1994; Cheatham & Dallos, 1998). The goal of SPC is to restore some of the nonlinear properties of the impaired ear by adding time-varying group delays in low-frequency channels. Although the loss of nonlinear properties (or group delay) in impaired ears is not completely predictable or equivalent to audiometric hearing thresholds, otoacoustic emissions (OAEs) have been shown to be an indirect measure of cochlear nonlinearity (Brownell, 1990; Neely, Gorga, & Dorn, 2003). Thus, one may assume that absent OAEs would indicate a loss of cochlear nonlinear function and as a result SPC might provide benefit. In the present study, DPOAEs were present for three of the four listeners with mild hearing loss and for one of the five listeners in the moderate hearing loss group. However, benefit from SPC processing was the same for listeners with absent OAEs as it was for listeners with present OAEs.
In general, with the exception of one listener, SPC did not improve or degrade the intelligibility of VC syllables. van Schijndel, Houtgast, & Festen (2001) suggested that distorted coding of spectral information may be more detrimental to speech intelligibility than temporal distortions. However, it was surprising that the temporal distortions added to the signal at high SPC strengths did not decrease the intelligibility scores for listeners with normal hearing. To ensure that higher SPC strengths did not lead to greater improvements in speech intelligibility, two of the listeners in the moderate-to-severe hearing loss group (HI7 and HI8) also performed intelligibility testing at SPC strengths of 1.3 and 1.4. Their VC intelligibility was stable, not increasing or decreasing, between SPC strengths of 1.0 to 1.4. The stability of these results indicates that even higher SPC strengths, which were least preferred, did not improve intelligibility.
Interestingly, the one listener, HI12, whose VC syllable recognition improved by 8.3% at an SPC strength of 1.1 had the most severe hearing loss in the study (see Fig. 3) and was also the youngest participant (21 yr old). This listener was unable to perceive a qualitative difference between uncorrected and SPC 1.1 processed sentences. Because we only had one young subject with hearing loss (the next youngest listener with hearing loss was 63 yr old) no conclusions can be made about how age could have affected the listeners’ ability to benefit from SPC. However, there is some evidence that suggests young listeners understand speech with temporal manipulations better than elderly listeners (Gordon-Salant, Yeni-Komshian, Fitzgibbons, & Barrett, 2006).
One drawback with using VC syllable stimuli is that they are not representative of everyday listening. However, it is difficult to use sentences in quiet because of ceiling effects. In the present study, the three listeners in the moderate-to-severe hearing loss group were tested using low-probability SPIN sentences. All three listeners’ sentence recognition scores decreased at an SPC strength of 1.2. This included the one listener who showed an improvement in VC recognition at an SPC strength of 1.1. To ensure that a slightly weaker or stronger SPC strength would not have changed the results, two listeners in the moderate-to-severe hearing loss group (HI7 and HI12) were tested at two additional SPC strengths, 1.05 and 1.3. Recognition scores at these two correction strengths were similar to the other SPC results.
As discussed in the Methods section, changes were made in the present study to the original SPC processor used in Shi et al. (2006). One change was related to the filter bank that was used. In the original SPC processor a gammatone (Hohmann, 2002) filter bank was implemented. This may have added undesired distortions to the signal due to overlapping filters. We asked a group of listeners with hearing loss to indicate if they preferred listening to the stimuli processed through a rectangular filter bank versus a gammatone filter bank. They all preferred the rectangular filter bank. Thus, one of the major changes made to the SPC signal processor for this study was to replace the gammatone filter bank with a rectangular filter bank. Yet the results from this study indicate that the rectangular filter bank did not improve the performance of listeners with hearing loss with the SPC processor. In fact, the results reported in Shi et al. (2006) indicated some SPC benefit; thus, implementing a rectangular filter bank may have decreased speech intelligibility regardless of the fact that it was subjectively preferred by most of the listeners. There is also a chance that if the overlapping filters implemented in Shi et al. (2006), via the gammatone filter bank, did indeed cause distortion, it may have actually provided listeners with cues they could have used to perform the closed-set speech intelligibility task.
In conclusion, adding a group delay to a speech signal to compensate for the loss of cochlear nonlinearity in an impaired ear, as is done with SPC, does not significantly improve speech intelligibility. We are currently exploring other possible signal processing algorithms that could help counteract the negative effects that result from reduced cochlear nonlinear function in an impaired ear.
Acknowledgments
This work was supported by grant R21 DC006057 from the National Institute on Deafness and Other Communication Disorders. The authors would like to thank Dr. Michael Anzalone for his help in programming and stimulus preparation. The authors would also like to thank the reviewers and Dr. Janet Koehnke for providing helpful comments on an earlier version of this manuscript. Portions of this work were presented at the 2005 American Auditory Society meeting in Scottsdale, Arizona, and the 5th Biannual Lake Ontario Auditory Neuroscience Meeting in Hamilton, Ontario, Canada.
REFERENCES
- American National Standards Institute (ANSI) International Organization for Standardization - Acoustics - Statistical distribution of hearing thresholds as a function of age. ANSI; New York: 2000. ISO 7029:2000. [Google Scholar]
- American National Standards Institute (ANSI) American National Standards Specifications for Audiometers. Standards Secretariat, Acoustical Society of America; New York, NY: 2004. Specifications for audiometers. ANSI S3.6. ANSI S3.6. [Google Scholar]
- Bentler RA, Nelson JA. Effect of spectral shaping and content on loudness discomfort. Journal of American Academy of Audiology. 2001;12:462–470. [PubMed] [Google Scholar]
- Bilger RC, Nuetzel JM, Rabinowitz WM, Rzeczkowski C. Standardization of a test of speech perception in noise. Journal of Speech, Language, and Hearing Research. 1984;27:32–48. doi: 10.1044/jshr.2701.32. [DOI] [PubMed] [Google Scholar]
- Boothroyd A, Springer N, Smith L, Schulman J. Amplitude compression and profound hearing loss. Journal of Speech and Hearing Research. 1988;31:362–376. doi: 10.1044/jshr.3103.362. [DOI] [PubMed] [Google Scholar]
- Brownell WE. Outer hair cell electromotility and otoacoustic emissions. Ear and Hearing. 1990;11:82–92. doi: 10.1097/00003446-199004000-00003. [DOI] [PMC free article] [PubMed] [Google Scholar]
- Carney LH. Spatiotemporal encoding of sound level: Models for normal encoding and recruitment of loudness. Hearing Research. 1994;76:31–44. doi: 10.1016/0378-5955(94)90084-1. [DOI] [PubMed] [Google Scholar]
- Cheatham MA, Dallos P. The level dependence of response phase: observations from cochlear hair cells. Journal of the Acoustical Society of America. 1998;104:356–359. doi: 10.1121/1.423245. [DOI] [PubMed] [Google Scholar]
- Dhar S, Long GR, Culpepper NB. The dependence of the distortion product 2f1-f2 on primary levels in non-impaired human ears. Journal of Speech, Language, and Hearing Research. 1998;41:1307–1318. doi: 10.1044/jslhr.4106.1307. [DOI] [PubMed] [Google Scholar]
- Dubno JR, Schaefer AB. Frequency selectivity and consonant recognition for hearing-impaired and normal-hearing listeners with equivalent masked thresholds. Journal of the Acoustical Society of America. 1995;97:1165–1174. doi: 10.1121/1.413057. [DOI] [PubMed] [Google Scholar]
- Florentine M, Buus S, Scharf B, Zwicker E. Frequency selectivity in normally-hearing and hearing-impaired observers. Journal of Speech and Hearing Research. 1980;23:646–649. doi: 10.1044/jshr.2303.646. [DOI] [PubMed] [Google Scholar]
- Gaskill SA, Brown AM. The behavior of the acoustic distortion product, 2f1 - f2, from the human ear and its relation to auditory sensitivity. Journal of the Acoustical Society of America. 1990;88:821–839. doi: 10.1121/1.399732. [DOI] [PubMed] [Google Scholar]
- Gatehouse S, Naylor G, Elberling C. Linear and nonlinear hearing aid fittings: 1, Patterns of benefit. International Journal of Audiology. 2006;45:130–152. doi: 10.1080/14992020500429518. [DOI] [PubMed] [Google Scholar]
- Gordon-Salant S, Yeni-Komshian GH, Fitzgibbons PJ, Barrett J. Age-related differences in identification and discrimination of temporal cues in speech segments. Journal of the Acoustical Society of America. 2006;119:2455–2466. doi: 10.1121/1.2171527. [DOI] [PubMed] [Google Scholar]
- Gorga MP, Neely ST, Ohlrich B, Hoover B, Redner J, Peters J. From laboratory to clinic: A large scale study of distortion product otoacoustic emissions in ears with normal hearing and ears with hearing loss. Ear and Hearing. 1997;18:440–455. doi: 10.1097/00003446-199712000-00003. [DOI] [PubMed] [Google Scholar]
- Greenberg S, Arai T, Silipo R. Speech intelligibility derived from exceedingly sparse spectral information; Proceedings of the International Conference of Spoken Language Processing; Sydney, Australia. December 1- 4, 1998.1998. [Google Scholar]
- Hansen M. Effects of multi-channel compression time constants on subjectively perceived sound quality and speech intelligibility. Ear and Hearing. 2002;23:369–380. doi: 10.1097/00003446-200208000-00012. [DOI] [PubMed] [Google Scholar]
- Heinz MG, Zhang X, Bruce IC, Carney LH. Auditory-nerve model for predicting performance limits of normal and impaired listeners. Acoustics Research Letters Online. 2001;2:91–96. [Google Scholar]
- Hohmann V. Frequency analysis and synthesis using a Gammatone filter bank. Acustica. 2002;88:433–442. [Google Scholar]
- Humes LE, Humes LE, Wilson DL. A comparison of single-channel linear amplification and two-channel wide-dynamic-range-compression amplification by means of an independent-group design. American Journal of Audiology. 2004;13:39–53. doi: 10.1044/1059-0889(2004/007). [DOI] [PubMed] [Google Scholar]
- Jenstad M, Seewald RC, Cornelisse LE, Shantz J. Comparison of linear gain and wide dynamic range compression hearing aid circuits: aided speech perception measures. Ear and Hearing. 1999;20:117–126. doi: 10.1097/00003446-199904000-00003. [DOI] [PubMed] [Google Scholar]
- Leek MR, Summers V. Auditory filter shapes of normal-hearing and hearing-impaired listeners in continuous broadband noise. Journal of the Acoustical Society of America. 1993;94:3127–3137. doi: 10.1121/1.407218. [DOI] [PubMed] [Google Scholar]
- Marriage JE, Moore BC, Stone MA, Baer T. Effects of three amplification strategies on speech perception by children with severe and profound hearing loss. Ear and Hearing. 2005;26:35–47. doi: 10.1097/00003446-200502000-00004. [DOI] [PubMed] [Google Scholar]
- Moore BCJ. Frequency selectivity and temporal resolution in normal and hearing-impaired listeners. British Journal of Audiology. 1985;19:189–201. doi: 10.3109/03005368509078973. [DOI] [PubMed] [Google Scholar]
- Moore BCJ, Glasberg BR. A revised model of loudness perception applied to cochlear hearing loss. Hearing Research. 2004;188:70–88. doi: 10.1016/S0378-5955(03)00347-2. [DOI] [PubMed] [Google Scholar]
- Moore BCJ, Vickers DA, Plack CJ, Oxenham AJ. Inter-relationship between different psychoacoustic measures assumed to be related to the cochlear active mechanism. Journal of the Acoustical Society of America. 1999;106:2261–2278. doi: 10.1121/1.428133. [DOI] [PubMed] [Google Scholar]
- Neely ST, Gorga MP, Dorn PA. Cochlear compression estimates from measurements of distortion-product otoacoustic emissions. Journal of the Acoustical Society of America. 2003;114:1499–1507. doi: 10.1121/1.1604122. [DOI] [PubMed] [Google Scholar]
- Nelson DA. High-level psychophysical tuning curves: Forward masking in normal-hearing and hearing-impaired listeners. Journal of Speech and Hearing Research. 1991;34:1233–1249. [PubMed] [Google Scholar]
- Nilsson M, Soli SD, Sullivan JA. Development of the Hearing in Noise Test for the measurement of speech reception thresholds in quiet and in noise. Journal of the Acoustical Society of America. 1994;95:1085–1099. doi: 10.1121/1.408469. [DOI] [PubMed] [Google Scholar]
- Oxenham AJ, Bacon SP. Cochlear compression: Perceptual measures and implications for normal and impaired hearing. Ear and Hearing. 2003;24:352–366. doi: 10.1097/01.AUD.0000090470.73934.78. [DOI] [PubMed] [Google Scholar]
- Shanks JE, Wilson RH, Larson V, Williams D. Speech recognition performance of patients with sensorineural hearing loss under unaided and aided conditions using linear and compression hearing aids. Ear and Hearing. 2002;23:280–290. doi: 10.1097/00003446-200208000-00003. [DOI] [PubMed] [Google Scholar]
- Shi L, Carney LH, Doherty KA. Correction of the peripheral spatiotemporal response pattern: A potential new signal-processing strategy. Journal of Speech, Language and Hearing Research. 2006;49:848–855. doi: 10.1044/1092-4388(2006/060). [DOI] [PMC free article] [PubMed] [Google Scholar]
- Tillman TW, Carhart R. USAF School of Aerospace and Medicine. Brooks Air Force Base; Texas: 1966. An expanded test for speech discrimination utilizing CNC monosyllabic words: Northwestern University Auditory Test No. 6. Technical Report No SAM-TR-66-55 (pp. 1-12) [DOI] [PubMed] [Google Scholar]
- Turner CW, Henn CC. The relation between vowel recognition and measures of frequency resolution. Journal of Speech and Hearing Research. 1989;32:49–58. doi: 10.1044/jshr.3201.49. [DOI] [PubMed] [Google Scholar]
- van Schijndel NH, Houtgast T, Festen JM. Effects of degradation of intensity, time, or frequency content on speech intelligibility for normal-hearing and hearing-impaired listeners. Journal of the Acoustical Society of America. 2001;110:529–542. doi: 10.1121/1.1378345. [DOI] [PubMed] [Google Scholar]
- Walden BE, Surr RK, Cord MT, Olson L. Comparison of benefits provided by different hearing aid technologies. Journal of American Academy of Audiology. 2000;11:540–560. [PubMed] [Google Scholar]
- Wiley TL, Oviatt DL, Block MG. Acoustic-immittance measures in normal ears. Journal of Speech and Hearing Research. 1987;30:161–170. doi: 10.1044/jshr.3002.161. [DOI] [PubMed] [Google Scholar]
- Zhang X, Heinz MG, Bruce IC, Carney LH. A phenomenological model for the responses of auditory-nerve fibers: I, Nonlinear tuning with compression and suppression. Journal of the Acoustical Society of America. 2001;109:648–670. doi: 10.1121/1.1336503. [DOI] [PubMed] [Google Scholar]